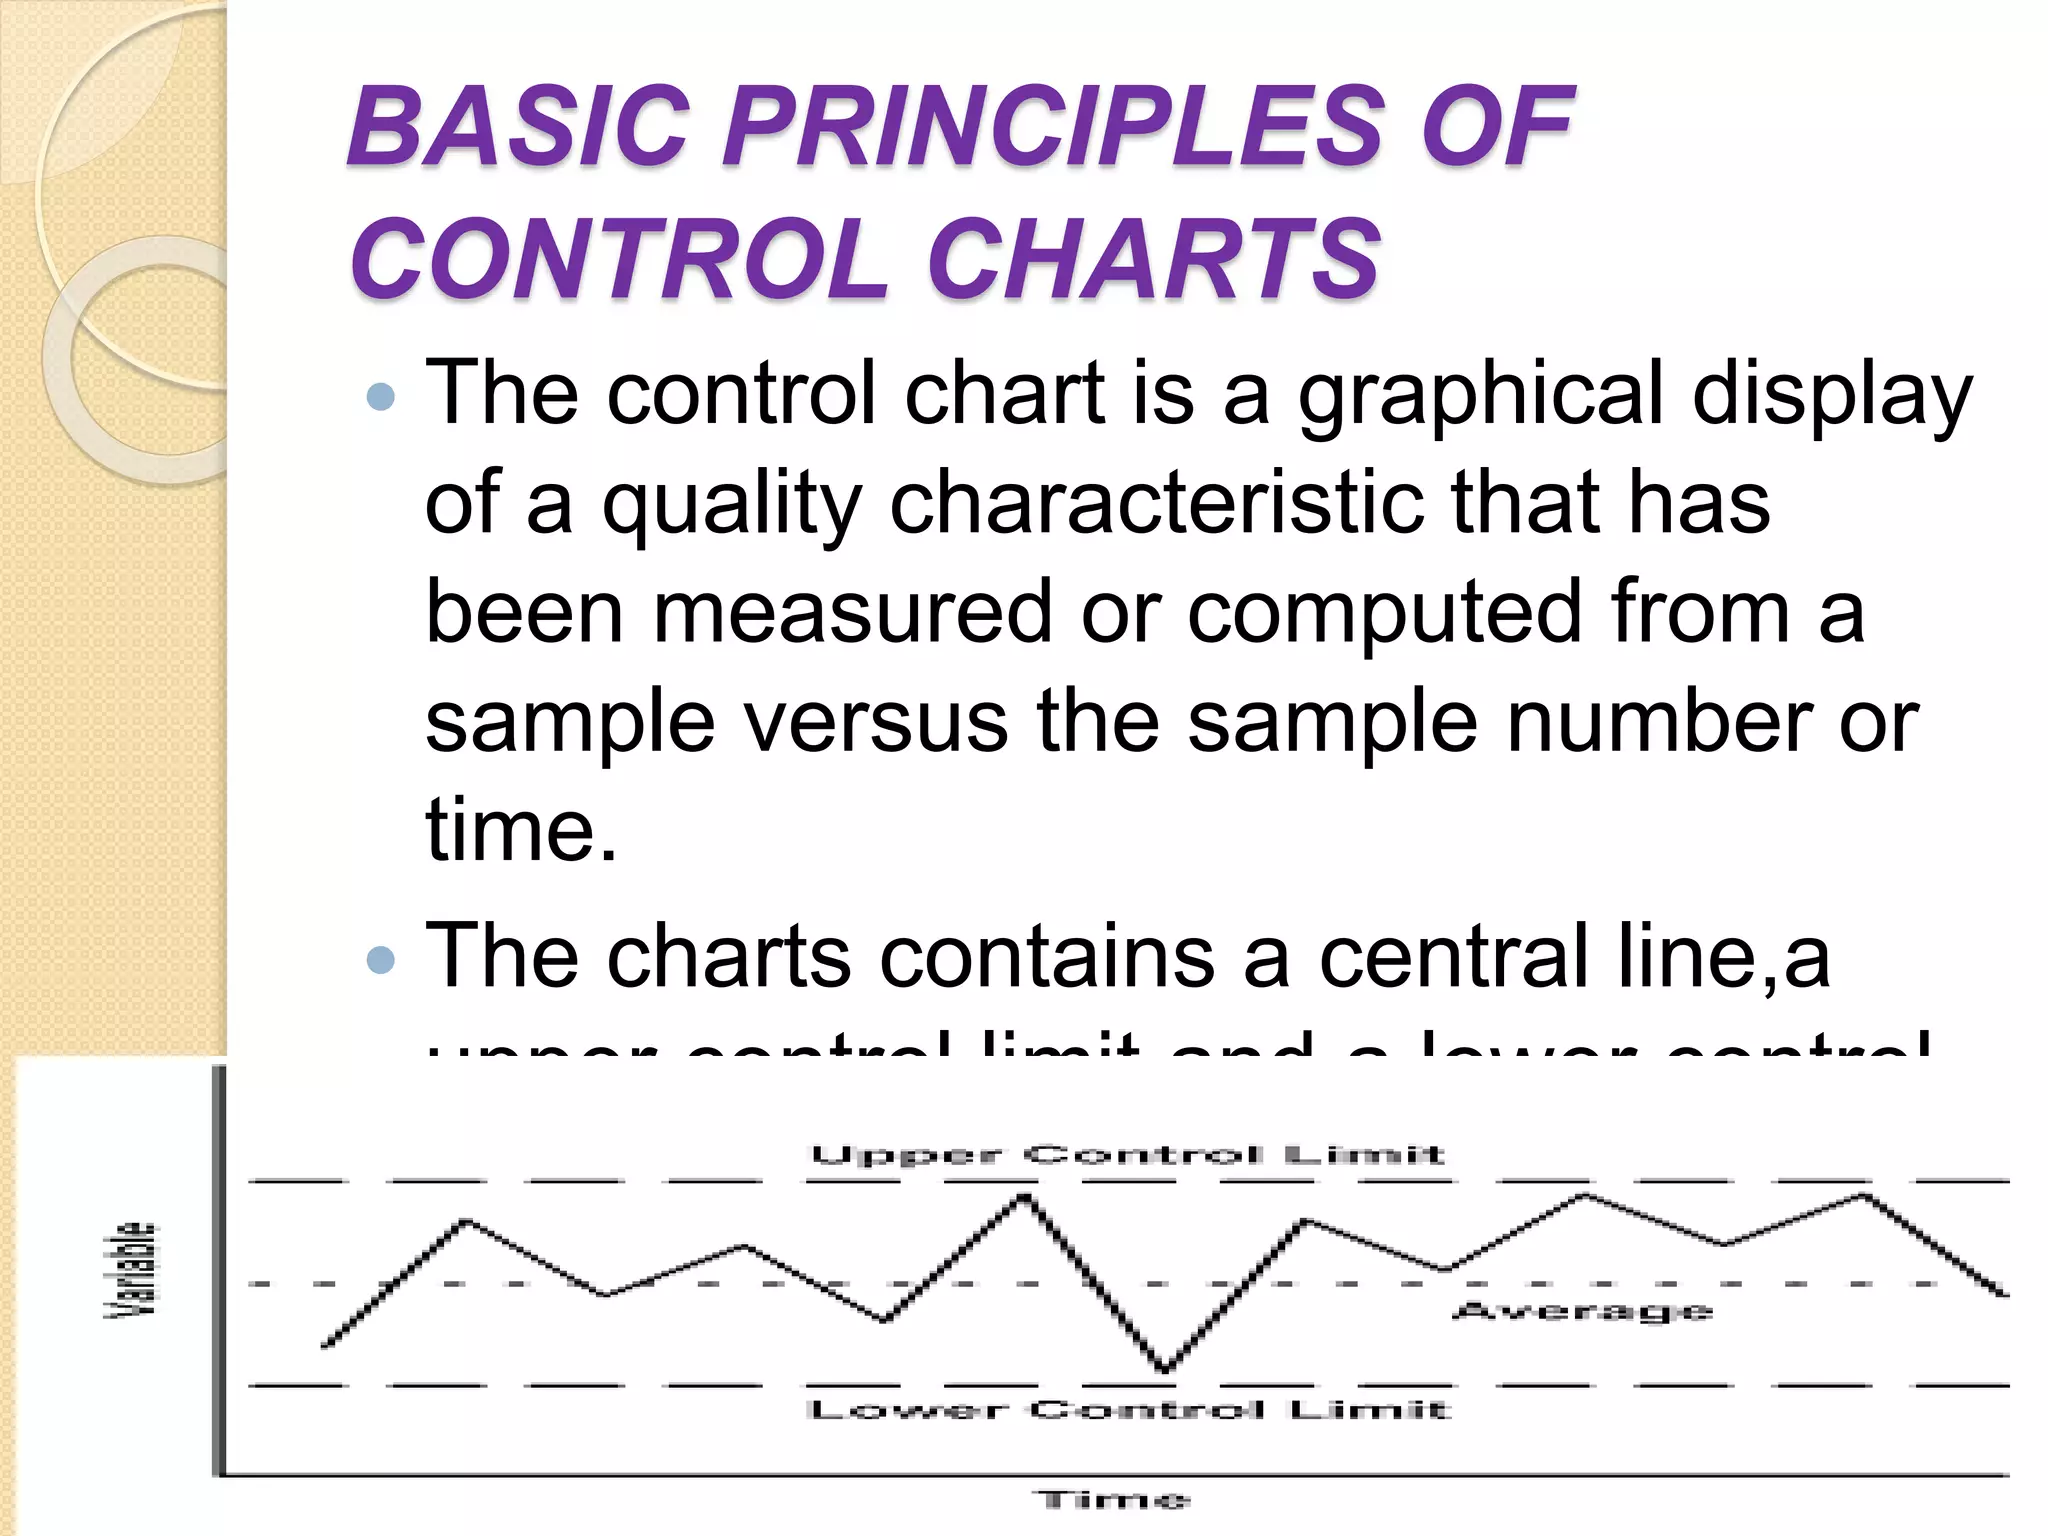
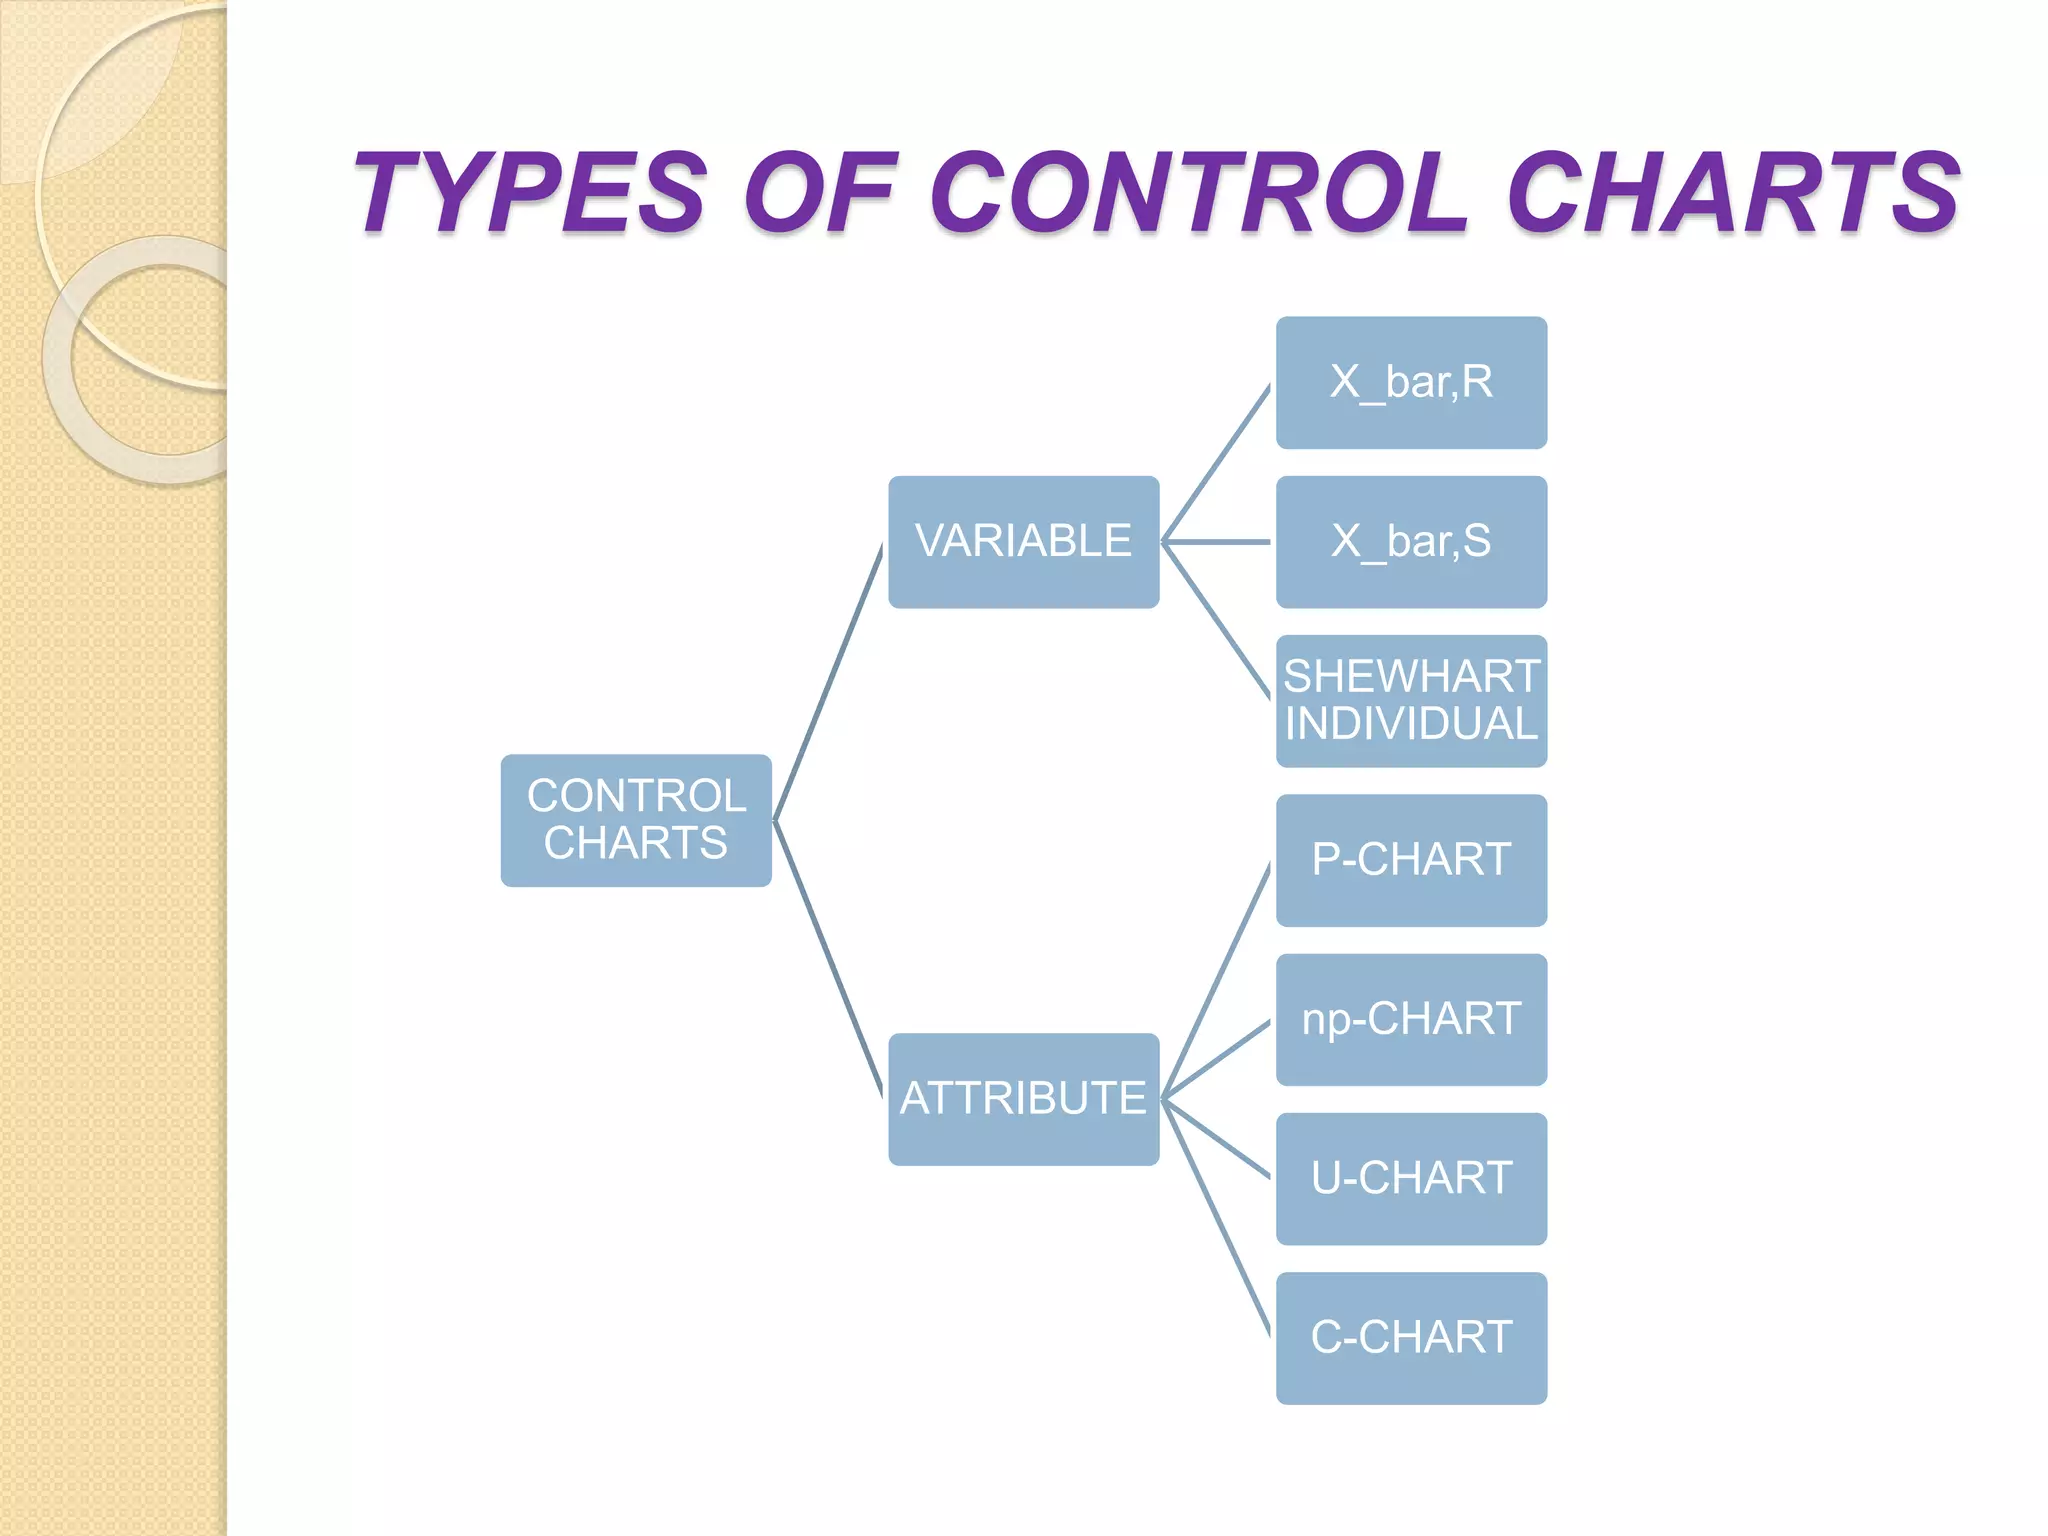
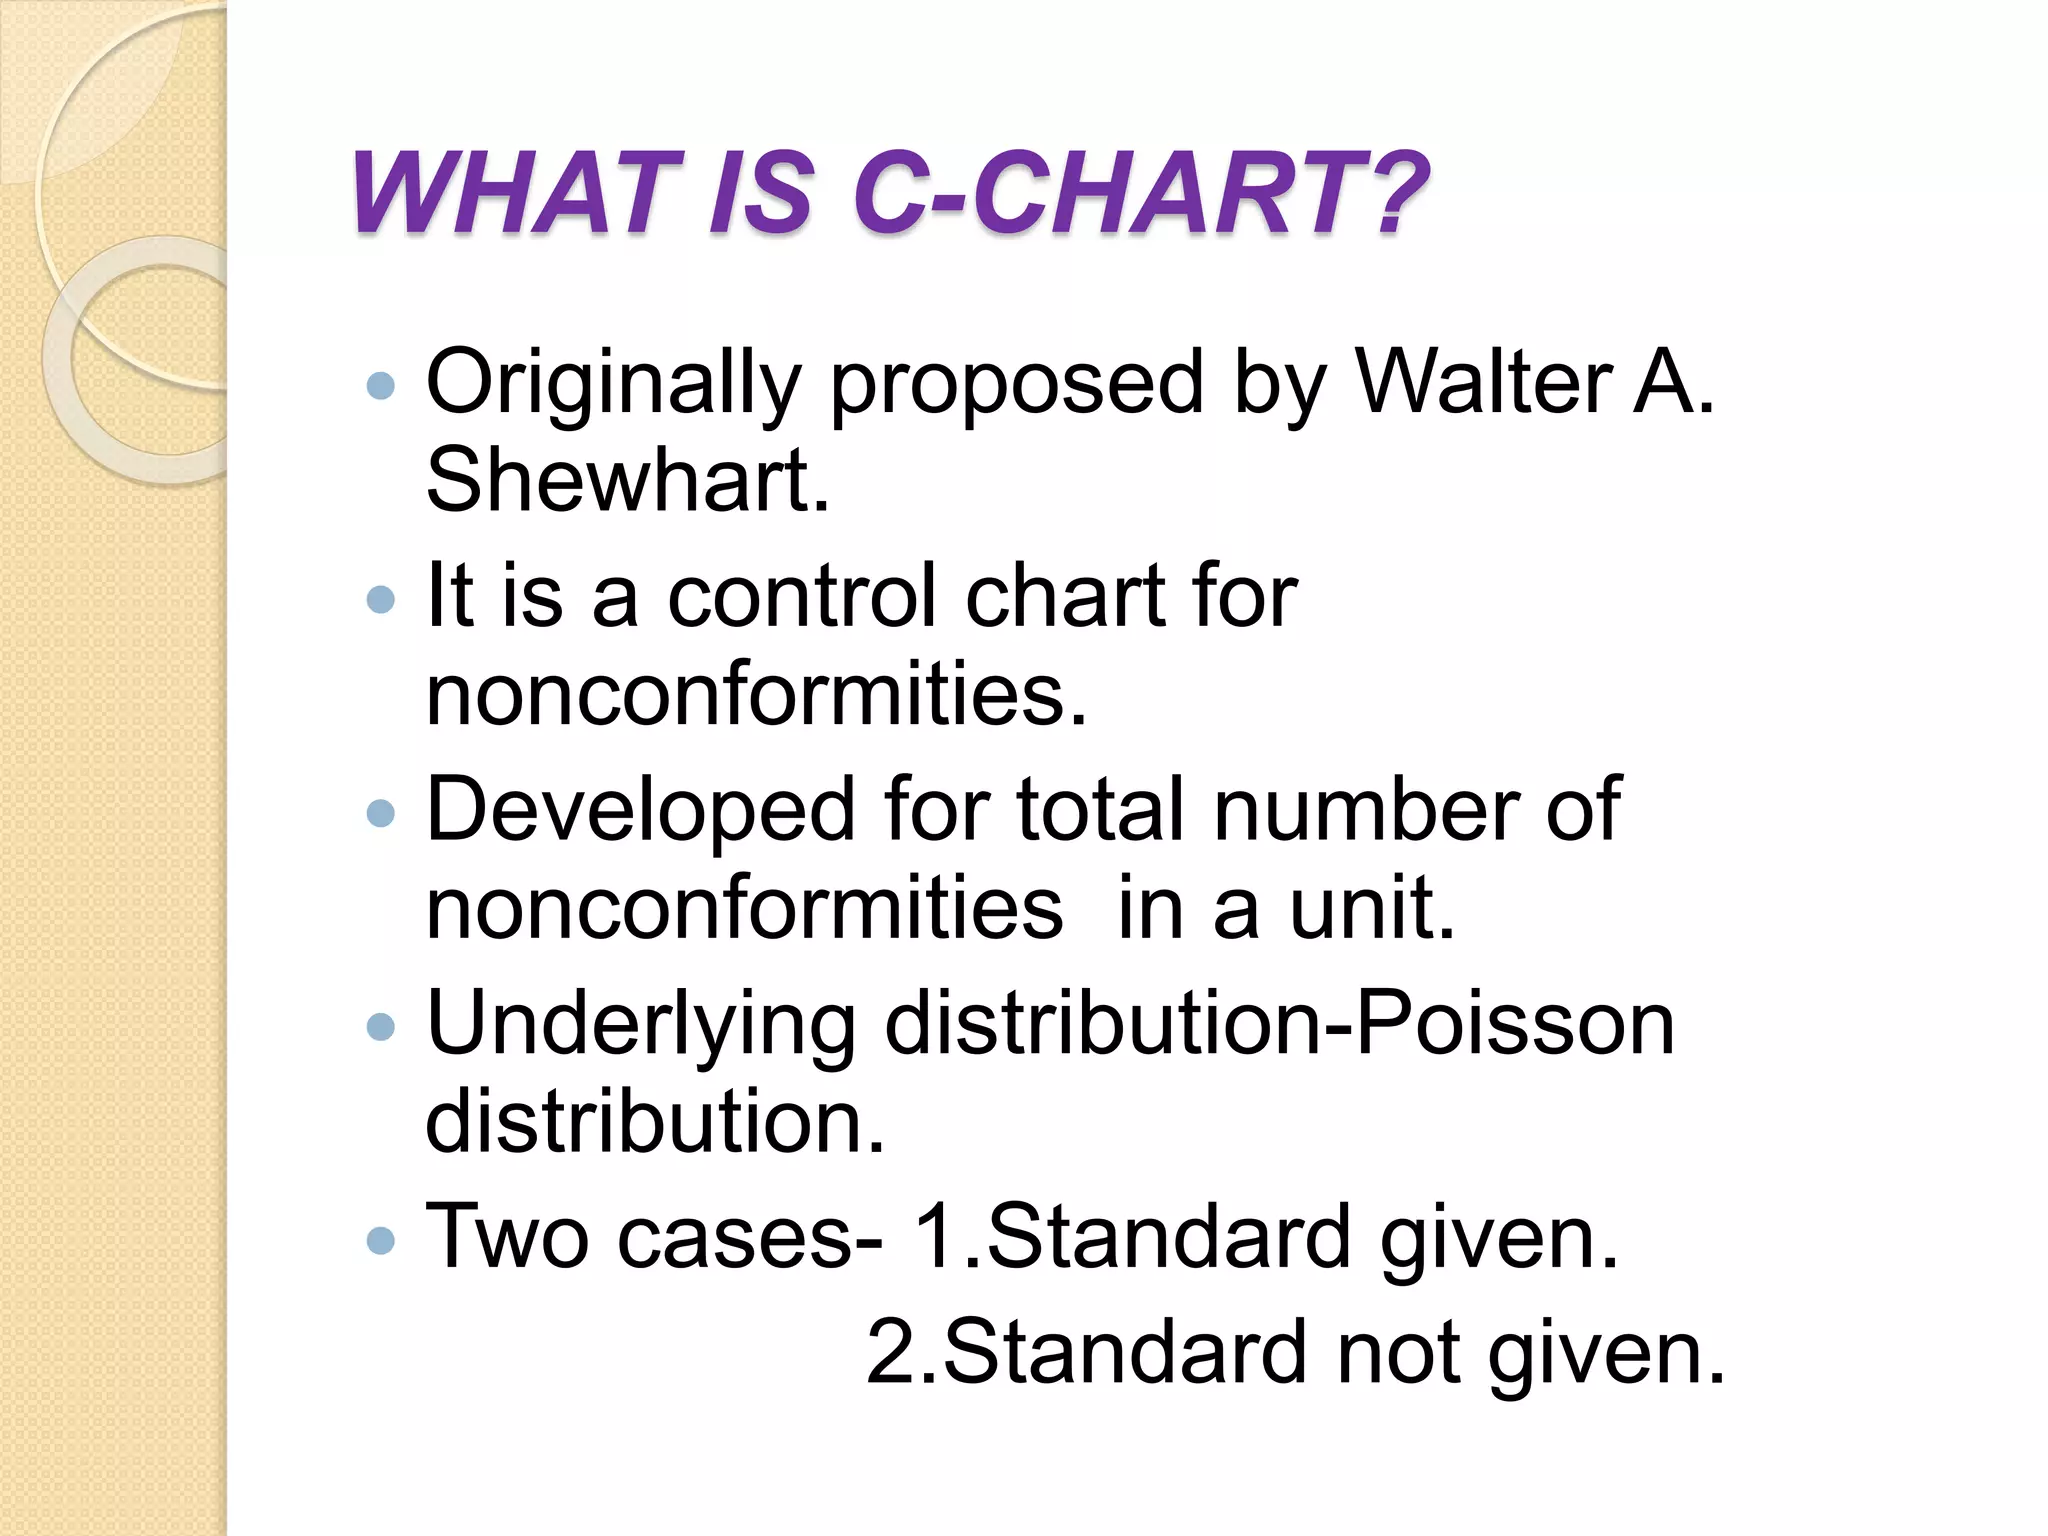
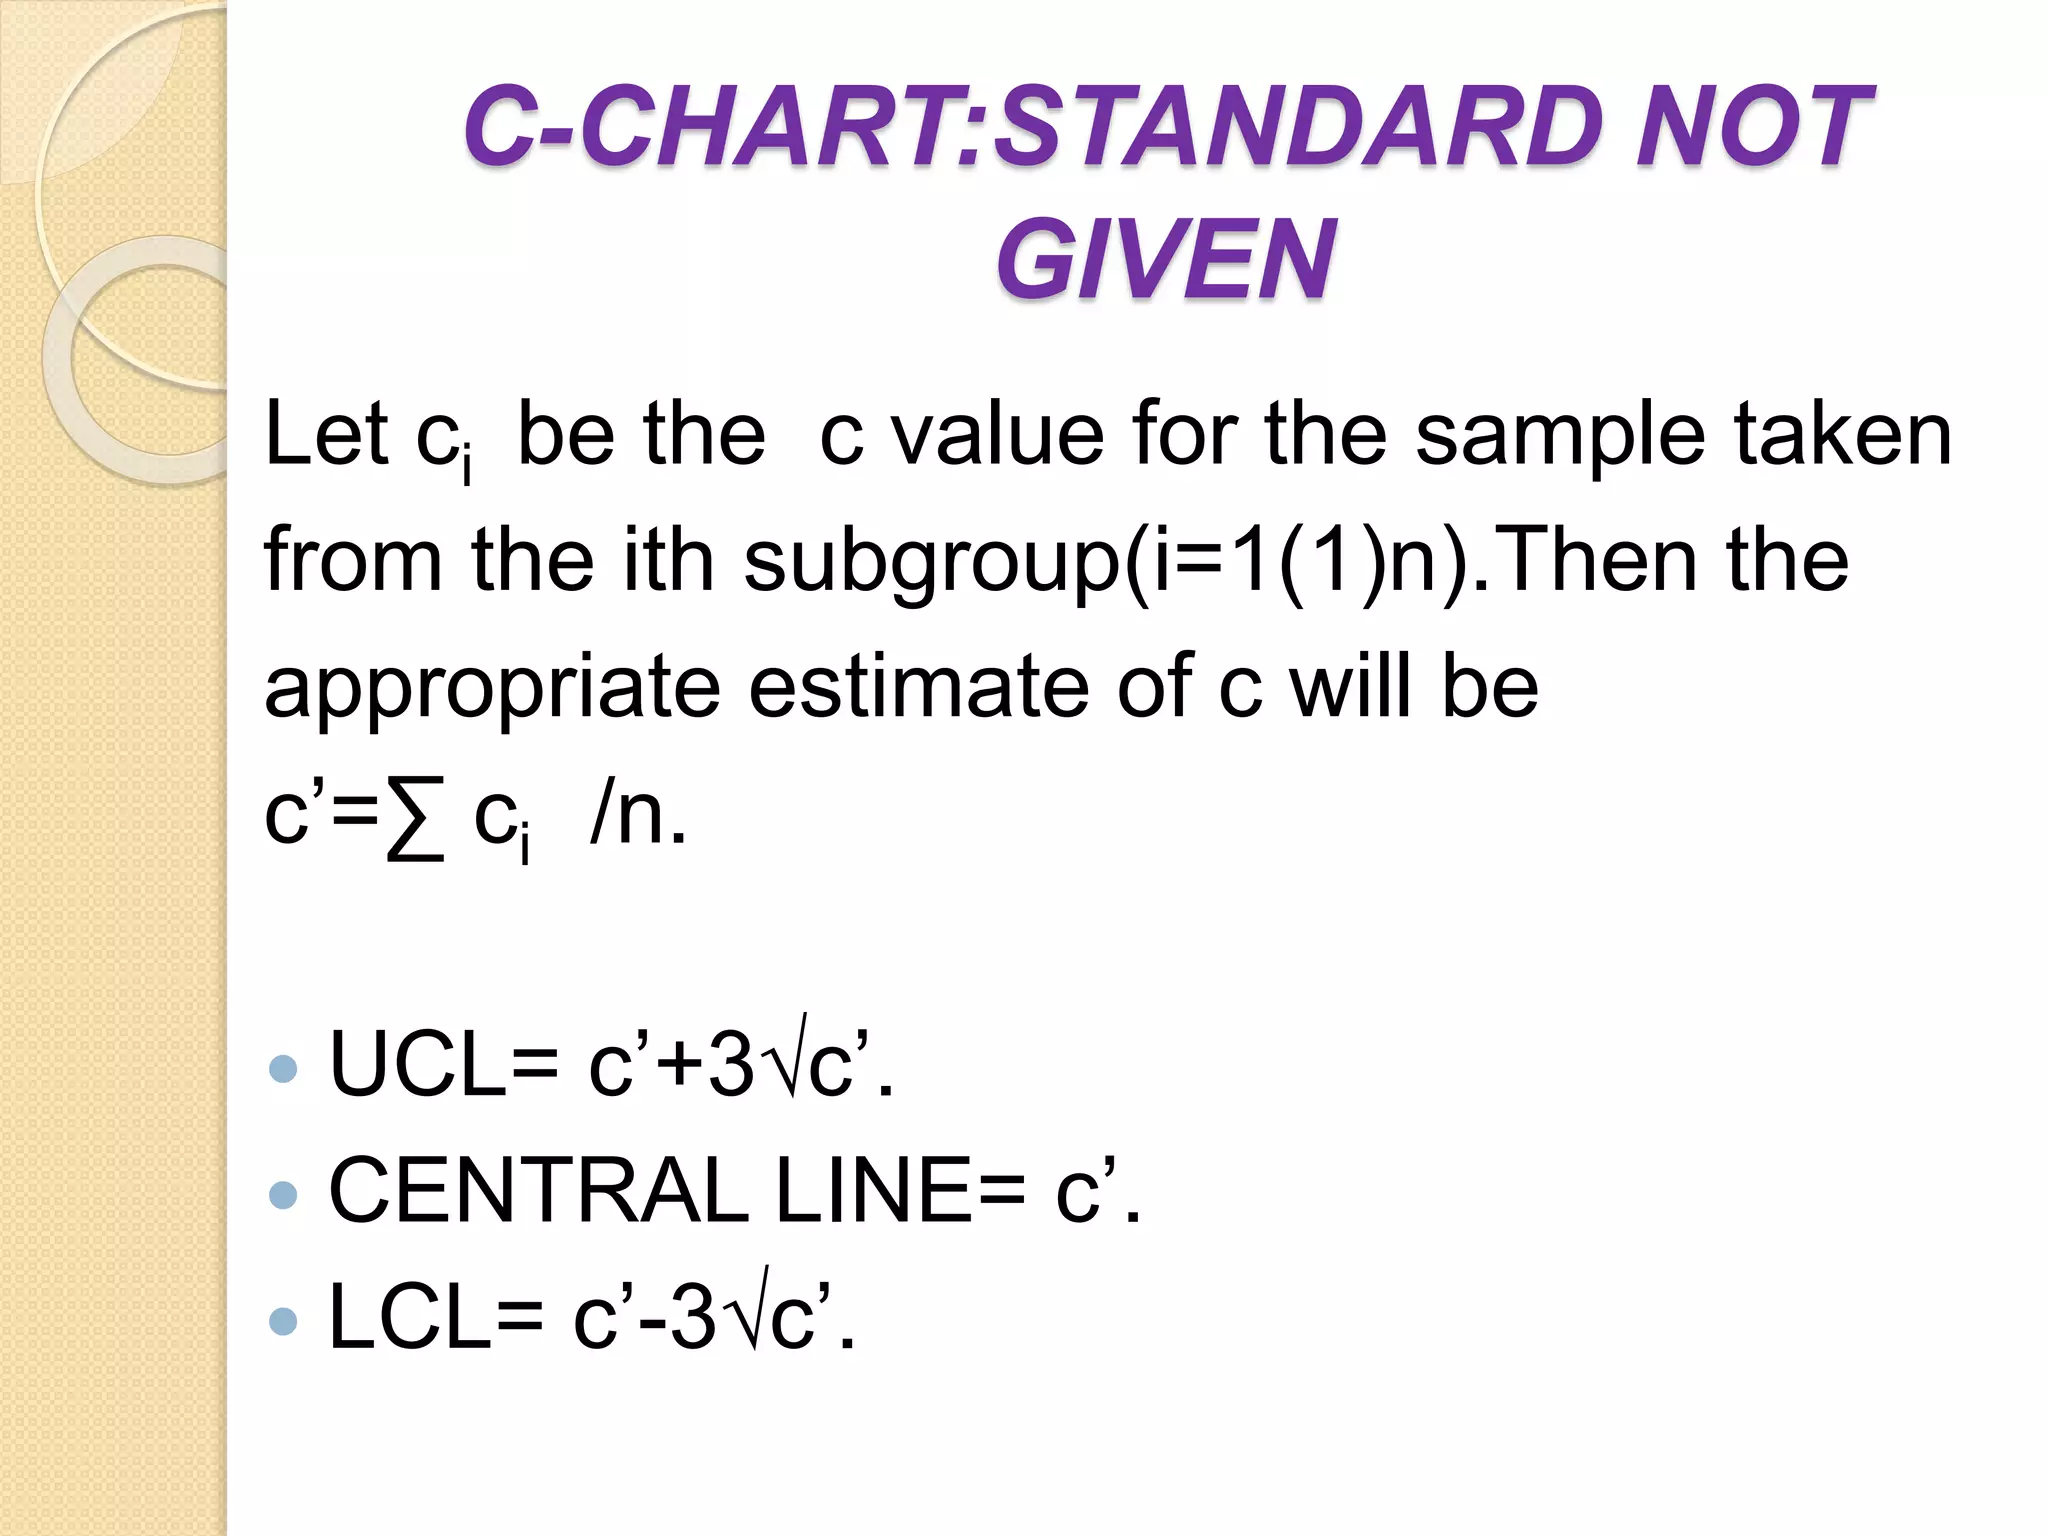
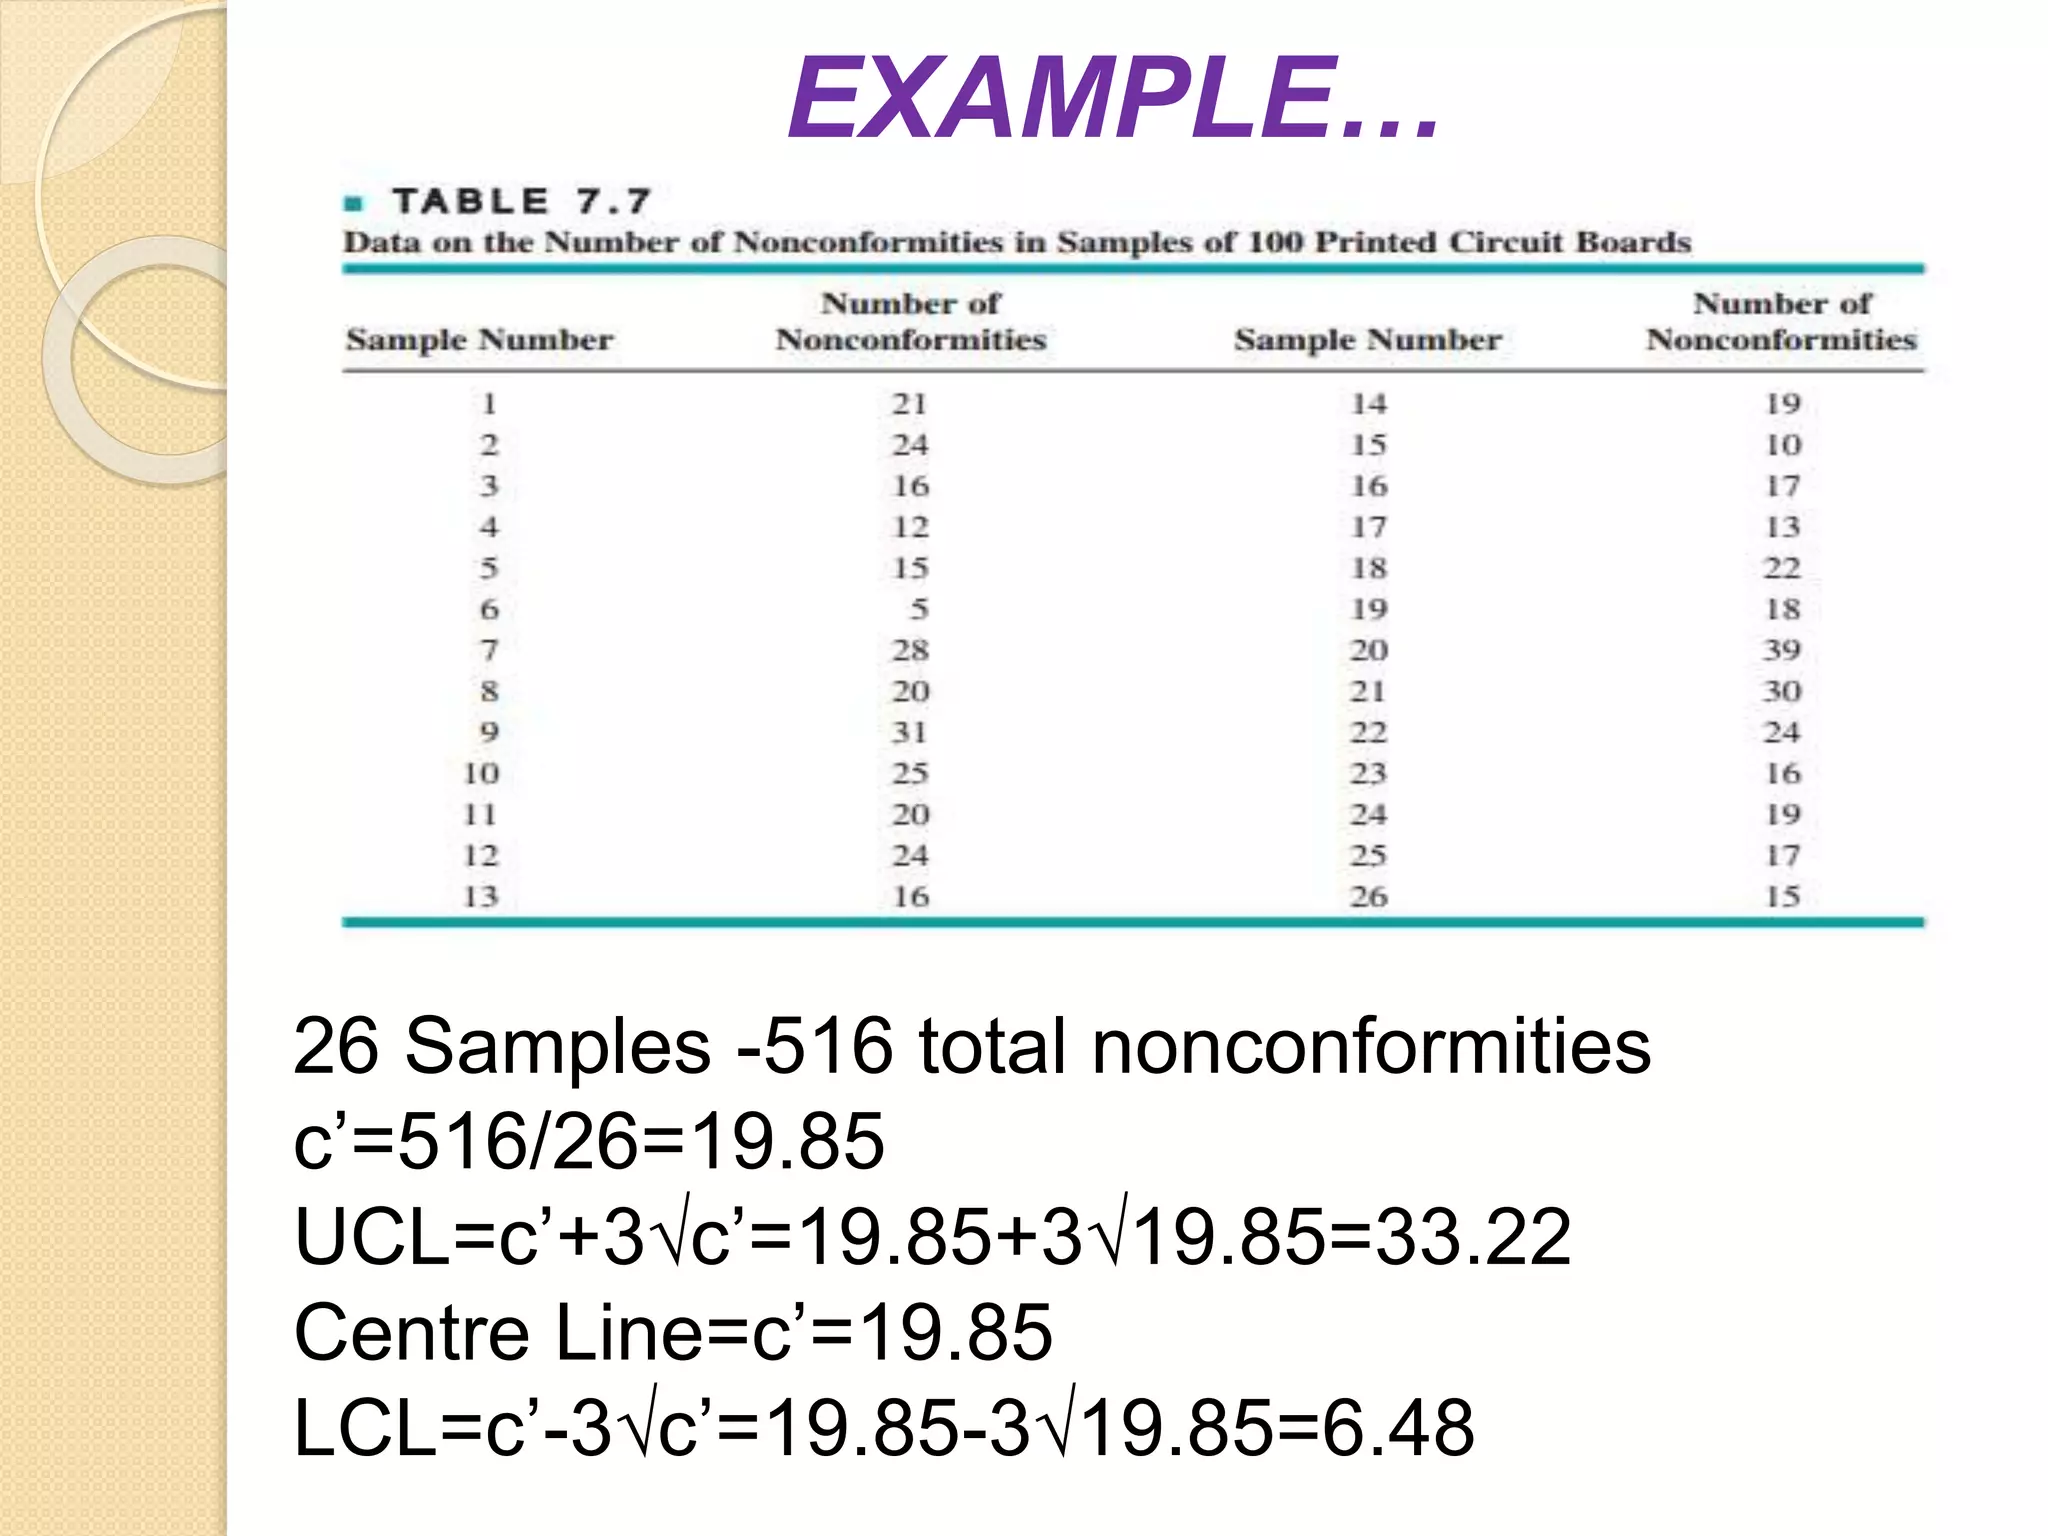
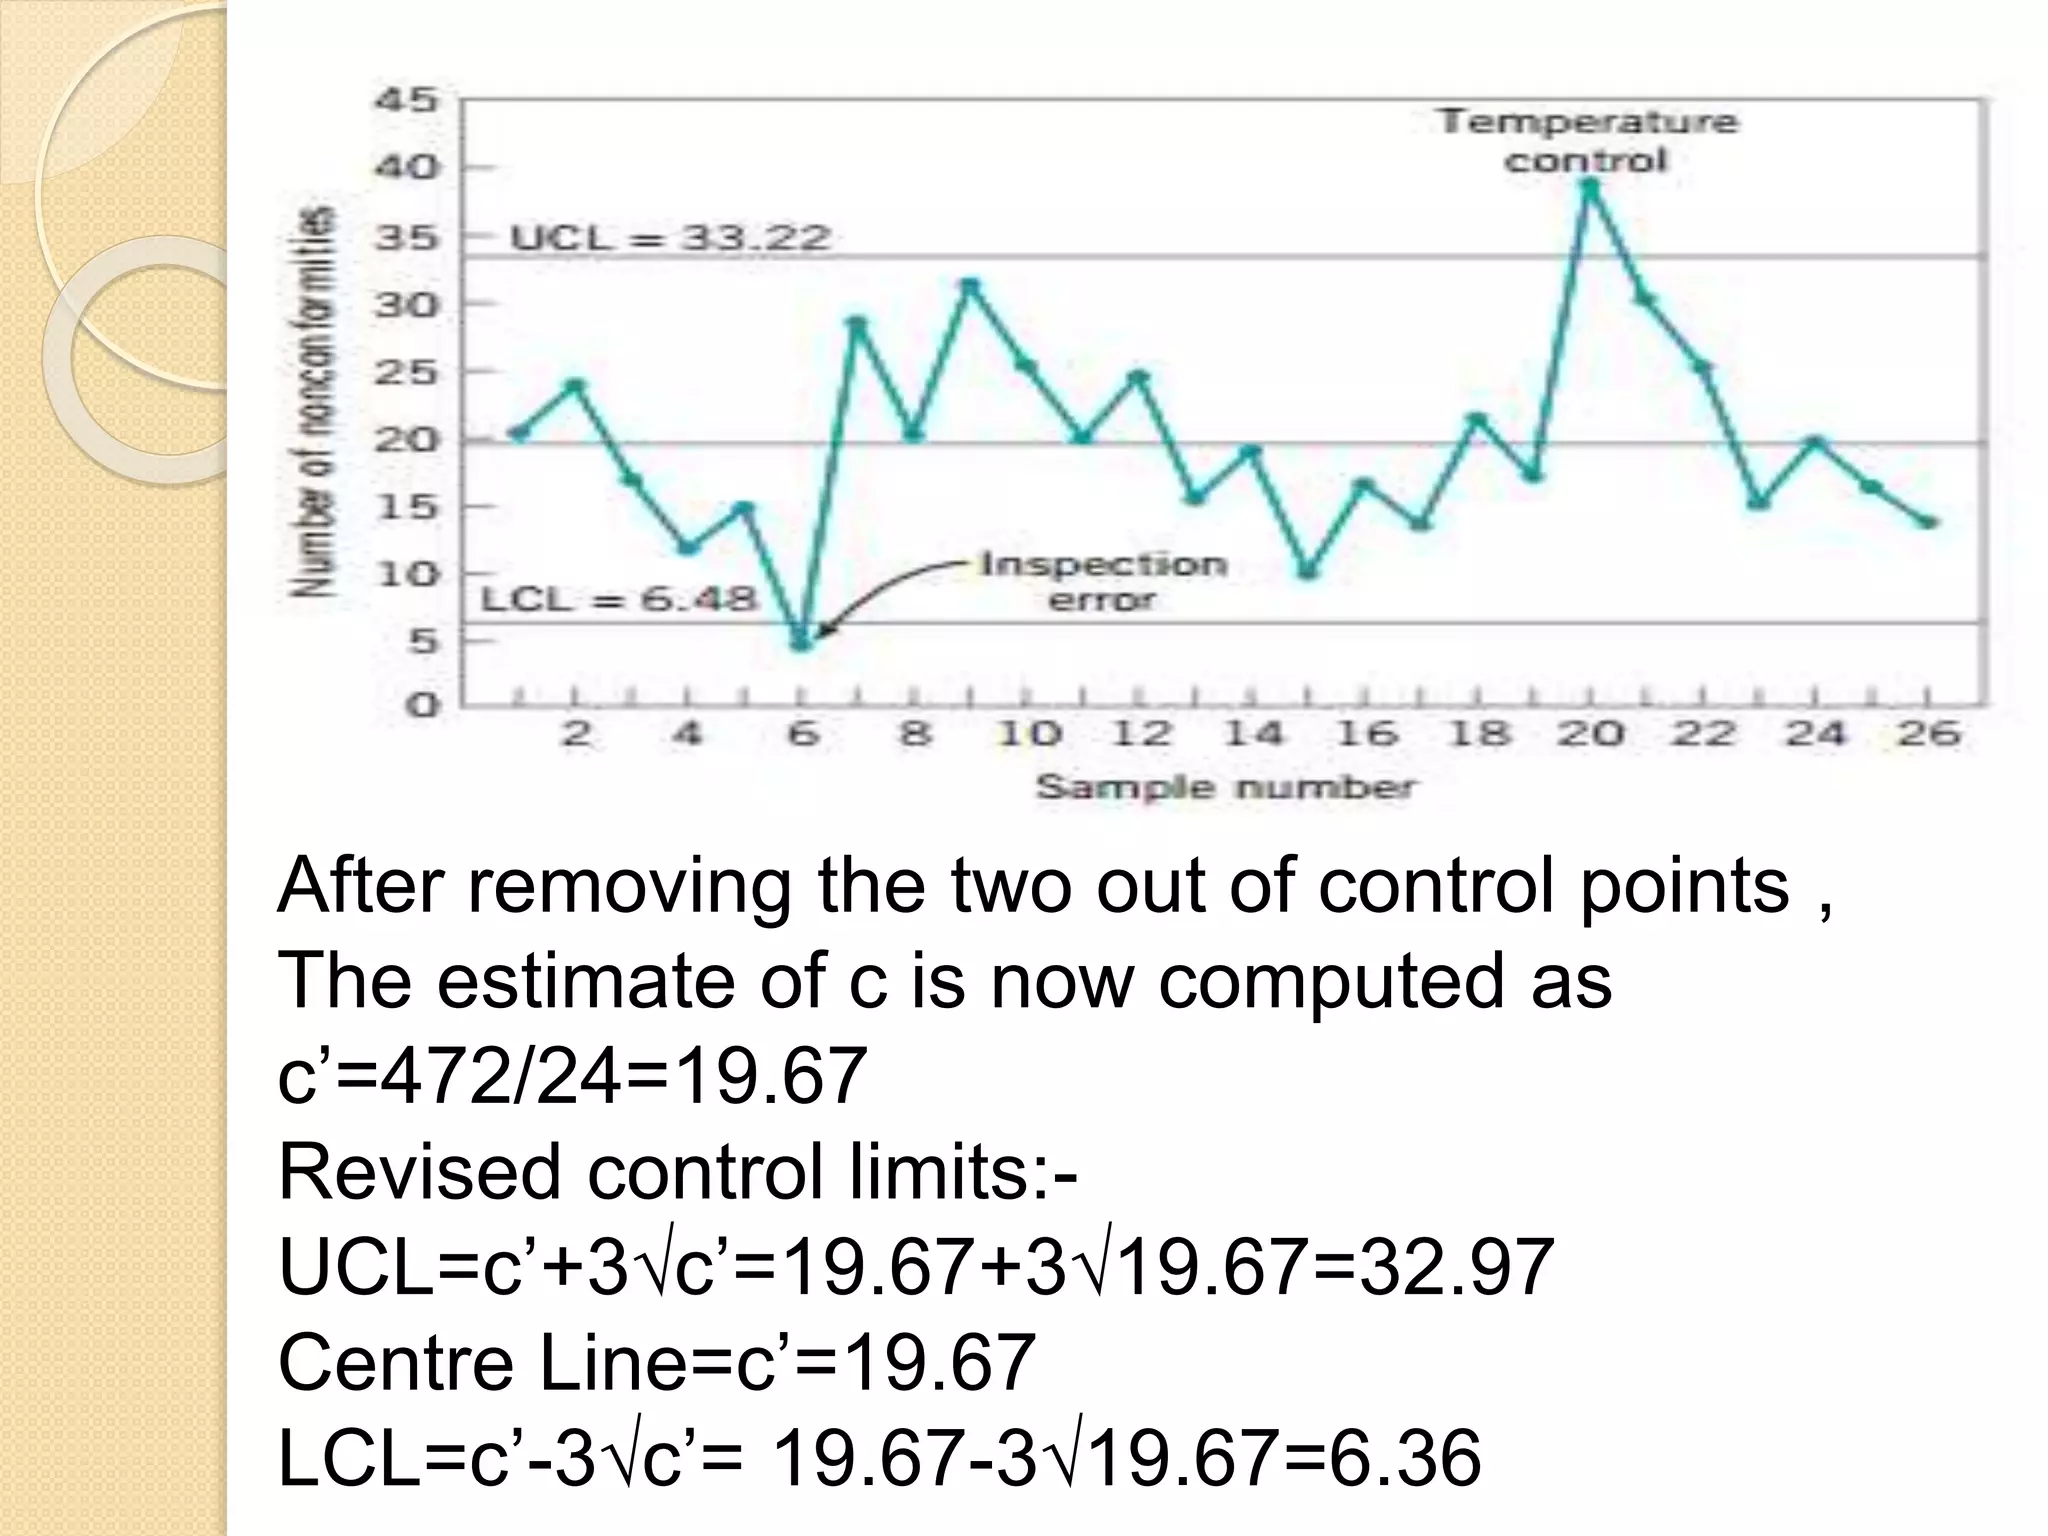
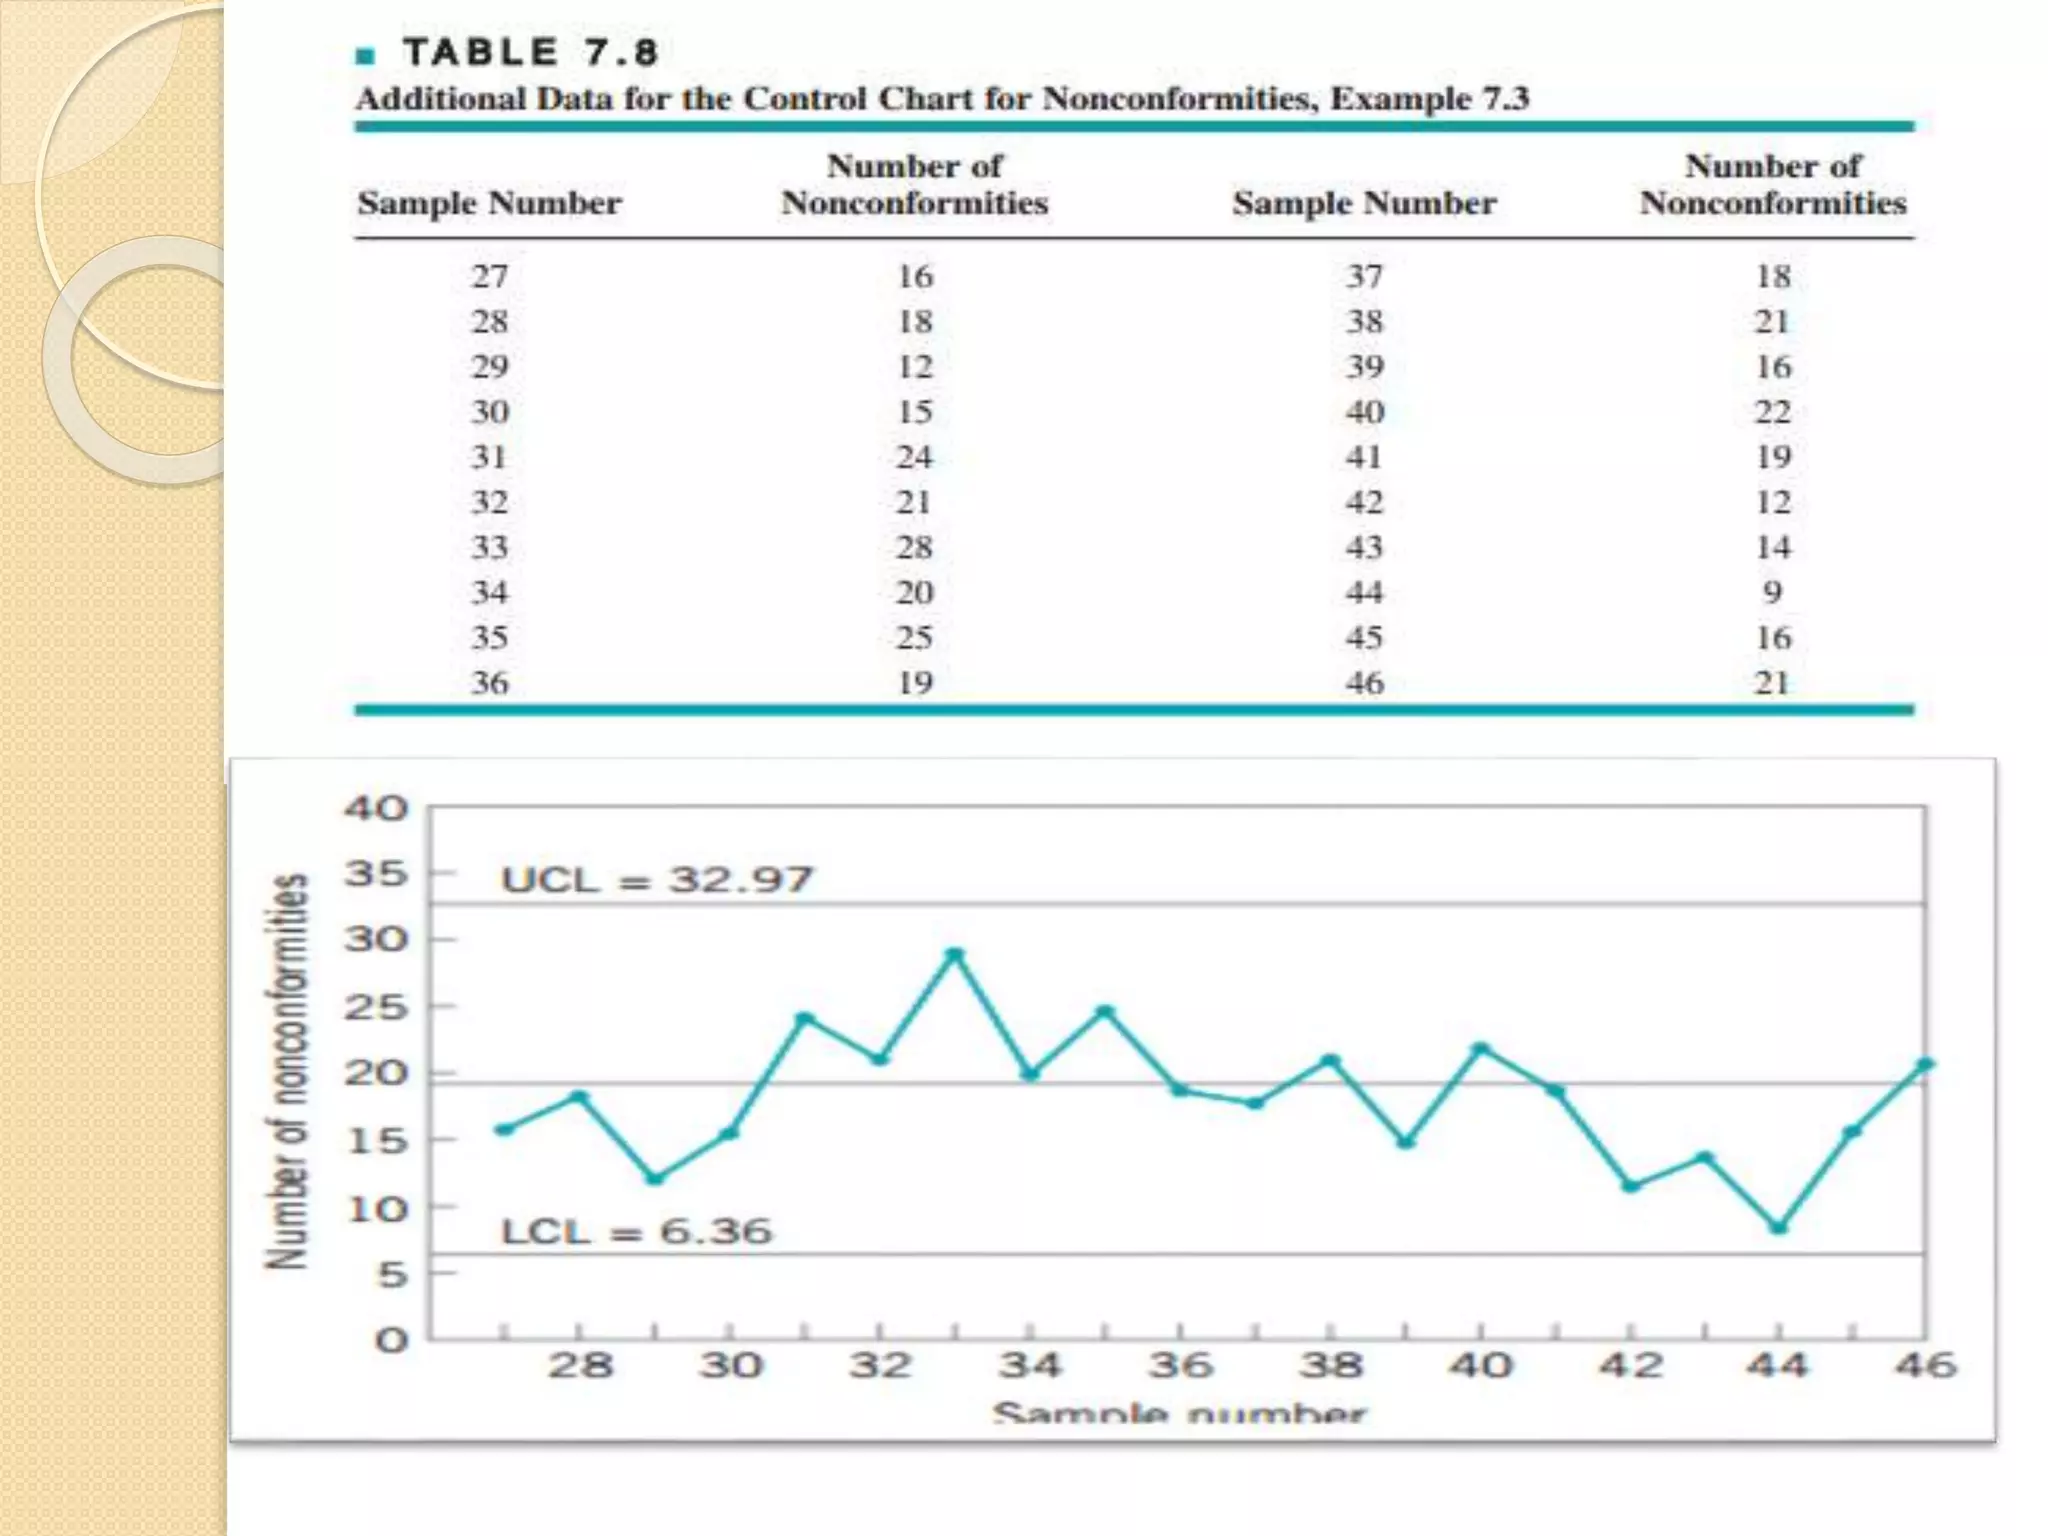
This document discusses control charts, specifically the C-chart. It defines a C-chart as a control chart used for nonconformities, or defects, in a product. A C-chart graphs the total number of nonconformities found in samples versus the sample number. It contains a central line at the expected value of defects (c) and upper and lower control limits at c ± 3√c. The document provides an example of constructing a C-chart using sample data and outlines how C-charts can be used in healthcare processes to monitor quality.


![Control Charts[1]](https://cdn.slidesharecdn.com/ss_thumbnails/controlcharts1-1226081330857138-9-thumbnail.jpg?width=640&height=640&fit=bounds)


