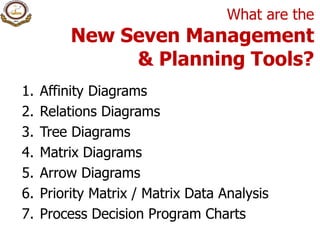
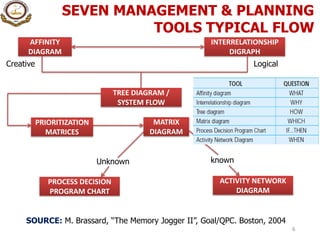
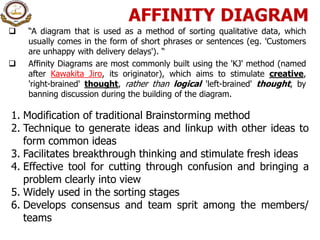
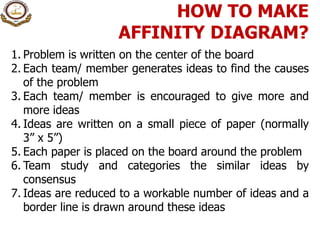
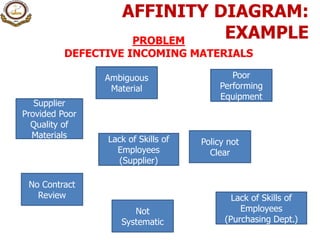
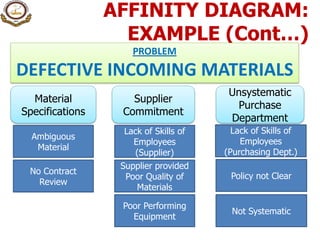
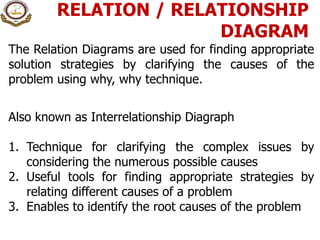
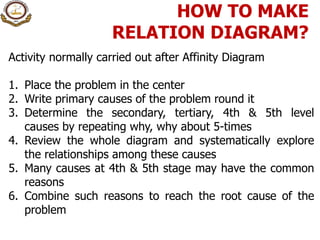
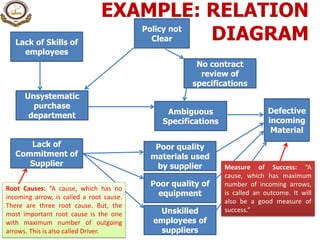
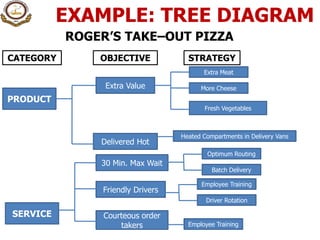
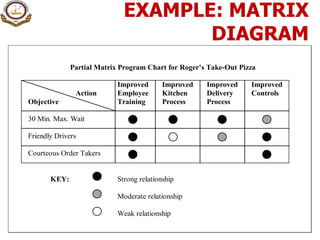
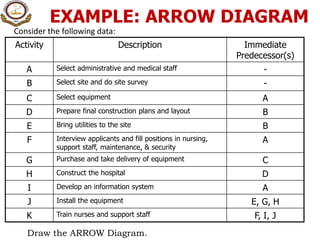
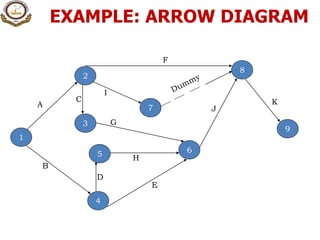
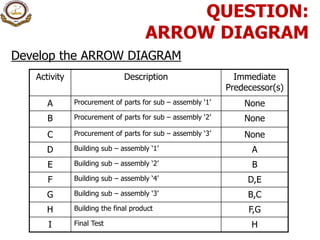
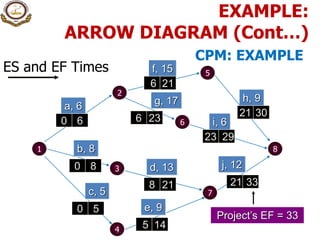
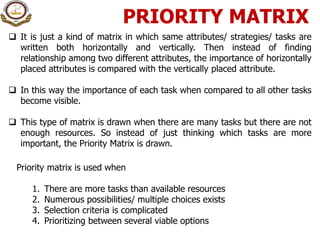
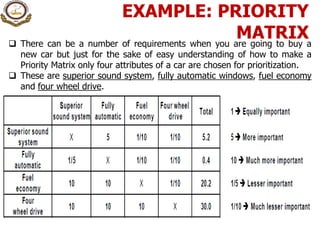
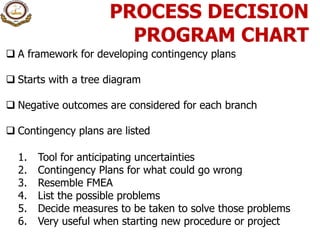
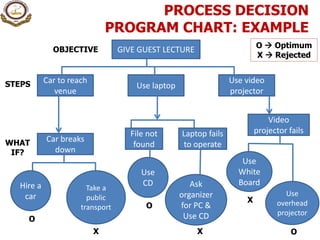
The document discusses various quality tools and techniques, including the New Seven Management Tools and the Basic Seven QC Tools. It provides details on each of the New Seven Tools: Affinity Diagrams, Relationship Diagrams, Tree Diagrams, Matrix Diagrams, Arrow Diagrams, Priority Matrix, and Process Decision Program Charts. Examples and steps to create each tool are outlined. The relationship between the New Seven Tools, which organize verbal data, and the Basic Seven QC Tools, which analyze numerical data, is explained.
PDCA Cycle
PDCA is an iterative four-step management method used in business for the control and continual improvement of processes and products. It is also known as the Deming circle/cycle/wheel, Shewhart cycle, control circle/cycle, or plan–do–study–act (PDSA). Another version of this PDCA cycle is OPDCA.
In this presentation, we will discuss the concept of quality management with specific importance on quality assurance, quality control and different views of quality, types of quality, levels of quality and quality determinants. We will also talk about the industrial revolution and beginning of quality control methods.
To know more about Welingkar School’s Distance Learning Program and courses offered, visit: http://www.welingkaronline.org/distance-learning/online-mba.html
Quality management ensures that an organization, product or service is consistent. Quality management is focused not only on product and service quality, but also on the means to achieve it. Quality management, therefore, uses quality assurance and control of processes as well as products to achieve more consistent quality.
Project Quality Management includes the processes and activities of the performing organization that determines quality policies, objectives, and responsibilities so that the project will satisfy the needs for which it was undertaken
Quality in Manufacturing for Production & ManufacturingTimothy Wooi
This 1 day training program on the “Soft” TQM Concepts focus on Manufacturing Staff and Operators to equip Participants with a better understanding TQM and its practices and to understand why being responsible for Quality is so important as a mechanism to safe guard to Customer for receiving a Defect as well as to comply to Quality procedures..
More https://quality.eqms.co.uk/blog/introduction-to-apqp
New to the advanced product quality planning framework?
Don't despair. In this article, Mike Bendall, Business Mentor at Qualsys, explains APQP, provides a checklist for each APQP phase, and there is a link to download his APQP training course for beginners.
The Seven Basic Tools stand in contrast to more advanced statistical methods such as survey sampling, acceptance sampling, statistical hypothesis testing, design of experiments, multivariate analysis, and various methods developed in the field of operations research.
Seven Quality management & control toolsPMC Mentor
Some insights into 7 quality management tools as stated in PMBOK quality management knowledge area.
Learn to practice the 7 Quality management & control tools with real examples.
TQM - BPR - Ref from Tqm Session-08 Business-Process-ReengineeringBeta-Research.org
TQM and BPR - Total Quality Management and Business Process Reengineering are 2 approaches in better restructuring, modernization and transformation. It covers an overarching schema from corporate company strategy to the tiny process for the purpose of achieving a better financial and value performance.
LEAN: Understanding the Process Decision Program Chart (Quality Tools Series ...College/University
LEAN: Understanding the Process Decision Program Chart (PDPC) offers information for users to learn, understand better , and to comprehend the key elements of the PDPC. After this lesson, learners should be able to:
- Articulate the usage of a PDPC
- Explain how to develop a PDPC
- Demonstrate the development of a PDPC
Explanation of the seven basic tools used to solve a variety of quality-related issues. They are suitable for people with little formal training in statistics.
Assists in the solving of common business problems by using a step-by-step methodology for problem identification, analysis, planning of corrective actions to solve a problem and preventive actions to address risks. More http://www.conceptdraw.com/solution-park/seven-management-and-planning-tools
QSO 510 Final Project Guidelines and Rubric Overview .docxmakdul
QSO 510 Final Project Guidelines and Rubric
Overview
The final project for this course is the creation of a statistical analysis report.
Each day, operations management professionals are faced with multiple decisions affecting various aspects of the operation. The ability to use data to drive
decisions is an essential skill that is useful in any facet of an operation. The dynamic environment offers daily challenges that require the talents of the operations
manager; working in this field is exciting and rewarding.
Throughout the course, you will be engaged in activities that charge you with making decisions regarding inventory management, production capacity, product
profitability, equipment effectiveness, and supply chain management. These are just a few of the challenges encountered in the field of operations management.
The final activity in this course will provide you with the opportunity to demonstrate your ability to apply statistical tools and methods to solve a problem in a
given scenario that is often encountered by an operations manager. Once you have outlined your analysis strategy and analyzed your data, you will then report
your data, strategy, and overall decision that addresses the given problem.
The project is divided into two milestones, which will be submitted at various points throughout the course to scaffold learning and ensure quality final
submissions. These milestones will be submitted in Modules Three and Seven. The final project is due in Module Nine.
In this assignment, you will demonstrate your mastery of the following course outcomes:
Apply data-based strategies in guiding a focused approach for improving operational processes
Determine the appropriate statistical methods for informing valid data-driven decision making in professional settings
Select statistical tools for guiding data-driven decision making resulting in sustainable operational processes
Utilize a structured approach for data-driven decision making for fostering continuous improvement activities
Propose operational improvement recommendations to internal and external stakeholders based on relevant data
Prompt
Operations management professionals are often relied upon to make decisions regarding operational processes. Those who utilize a data-driven, structured
approach have a clear advantage over those offering decisions based solely on intuition. You will be provided with a scenario often encountered by an operations
manager. Your task is to review the “A-Cat Corp.: Forecasting” scenario, the addendum, and the accompanying data in the case scenario and addendum; outline
the appropriate analysis strategy; select a suitable statistical tool; and use data analysis to ultimately drive the decision. Once this has been completed, you will
be challenged to present your data, data analysis strategy, and overall decision in a concise report, justifying your analysis.
Specifically, the ...
• Cooperated with fellow colleagues in a lab environment and experimented on the science of fluid flow through various types of piping and fittings.
• Researched the head loss that is caused in different piping including Venturi pipe, orifice plate, and elbow pipe fittings.
DAT 520 Final Project Guidelines and Rubric Overview .docxsimonithomas47935
DAT 520 Final Project Guidelines and Rubric
Overview
You must complete a decision analysis research project as your final project for this course. Your research project will focus on a real-world topic of your choice,
as approved by your instructor. You will pick a topic from the list provided or with approval from your instructor, and create a data analysis plan and decision
tree model based on a real-world scenario. This assessment will provide you with the opportunity to employ highly valued decision support skills and concepts
for data within a real-world context. You can use the Final Project Notes document, found in the Assignment Guidelines and Rubrics section of the course.
The project is divided into three milestones, which will be submitted at various points throughout the course to scaffold learning and ensure quality final
submissions. These milestones will be submitted in Modules Two, Five, and Seven. The final submission will occur in Module Nine.
This project will address the following course outcomes:
Appraise data in context according to industry-standard methods and techniques for its utility in supporting decision making
Determine suitable data manipulation and modeling methods for decision support
Articulate data frameworks for organizational decision support by applying data manipulation, modeling, and management concepts
Evaluate the ethical issues surrounding organizational use of decision-oriented data based on industry standards and one’s personal ethical criteria
Create and assess the agility of solutions through application of data-mining procedures for decision support in various industries
Prompt
Your decision analysis model and report should answer the following prompt: How does your model and evaluation resolve uncertainty in making a decision? In
order to produce your analytic report, you will need to choose and investigate a data set using the decision analysis techniques you learned in class. Then you
will formulate a research question, write an analytic plan, and implement it. Your report should not solely consist of descriptions of what you did. It should also
contain detailed explorations into the meaning behind your model and the implications of its results. You will also be testing your model’s fitness and evaluating
its strengths and weaknesses.
The project in a nutshell:
1. Choose a data set (get ideas from the source list in the spreadsheet Final Project Topics and Sources.xls)
2. Formulate your decision analysis research question
3. Write an analytic plan
4. Perform the top-down or bottom-up modeling
5. Perform model diagnostics
6. Evaluate
These activities are broken up into milestones so that the work is spread throughout the term and you can get early assistance with any obstacles.
A decision analysis report is similar to any other analytic report. These reports introduce a problem, state a line of inquiry, explain a model th.
Falcon stands out as a top-tier P2P Invoice Discounting platform in India, bridging esteemed blue-chip companies and eager investors. Our goal is to transform the investment landscape in India by establishing a comprehensive destination for borrowers and investors with diverse profiles and needs, all while minimizing risk. What sets Falcon apart is the elimination of intermediaries such as commercial banks and depository institutions, allowing investors to enjoy higher yields.
LA HUG - Video Testimonials with Chynna Morgan - June 2024Lital Barkan
Have you ever heard that user-generated content or video testimonials can take your brand to the next level? We will explore how you can effectively use video testimonials to leverage and boost your sales, content strategy, and increase your CRM data.🤯
We will dig deeper into:
1. How to capture video testimonials that convert from your audience 🎥
2. How to leverage your testimonials to boost your sales 💲
3. How you can capture more CRM data to understand your audience better through video testimonials. 📊
What is the TDS Return Filing Due Date for FY 2024-25.pdfseoforlegalpillers
It is crucial for the taxpayers to understand about the TDS Return Filing Due Date, so that they can fulfill your TDS obligations efficiently. Taxpayers can avoid penalties by sticking to the deadlines and by accurate filing of TDS. Timely filing of TDS will make sure about the availability of tax credits. You can also seek the professional guidance of experts like Legal Pillers for timely filing of the TDS Return.
Discover the innovative and creative projects that highlight my journey throu...dylandmeas
Discover the innovative and creative projects that highlight my journey through Full Sail University. Below, you’ll find a collection of my work showcasing my skills and expertise in digital marketing, event planning, and media production.
Premium MEAN Stack Development Solutions for Modern BusinessesSynapseIndia
Stay ahead of the curve with our premium MEAN Stack Development Solutions. Our expert developers utilize MongoDB, Express.js, AngularJS, and Node.js to create modern and responsive web applications. Trust us for cutting-edge solutions that drive your business growth and success.
Know more: https://www.synapseindia.com/technology/mean-stack-development-company.html
Skye Residences | Extended Stay Residences Near Toronto Airportmarketingjdass
Experience unparalleled EXTENDED STAY and comfort at Skye Residences located just minutes from Toronto Airport. Discover sophisticated accommodations tailored for discerning travelers.
Website Link :
https://skyeresidences.com/
https://skyeresidences.com/about-us/
https://skyeresidences.com/gallery/
https://skyeresidences.com/rooms/
https://skyeresidences.com/near-by-attractions/
https://skyeresidences.com/commute/
https://skyeresidences.com/contact/
https://skyeresidences.com/queen-suite-with-sofa-bed/
https://skyeresidences.com/queen-suite-with-sofa-bed-and-balcony/
https://skyeresidences.com/queen-suite-with-sofa-bed-accessible/
https://skyeresidences.com/2-bedroom-deluxe-queen-suite-with-sofa-bed/
https://skyeresidences.com/2-bedroom-deluxe-king-queen-suite-with-sofa-bed/
https://skyeresidences.com/2-bedroom-deluxe-queen-suite-with-sofa-bed-accessible/
#Skye Residences Etobicoke, #Skye Residences Near Toronto Airport, #Skye Residences Toronto, #Skye Hotel Toronto, #Skye Hotel Near Toronto Airport, #Hotel Near Toronto Airport, #Near Toronto Airport Accommodation, #Suites Near Toronto Airport, #Etobicoke Suites Near Airport, #Hotel Near Toronto Pearson International Airport, #Toronto Airport Suite Rentals, #Pearson Airport Hotel Suites
Cracking the Workplace Discipline Code Main.pptxWorkforce Group
Cultivating and maintaining discipline within teams is a critical differentiator for successful organisations.
Forward-thinking leaders and business managers understand the impact that discipline has on organisational success. A disciplined workforce operates with clarity, focus, and a shared understanding of expectations, ultimately driving better results, optimising productivity, and facilitating seamless collaboration.
Although discipline is not a one-size-fits-all approach, it can help create a work environment that encourages personal growth and accountability rather than solely relying on punitive measures.
In this deck, you will learn the significance of workplace discipline for organisational success. You’ll also learn
• Four (4) workplace discipline methods you should consider
• The best and most practical approach to implementing workplace discipline.
• Three (3) key tips to maintain a disciplined workplace.
Business Valuation Principles for EntrepreneursBen Wann
This insightful presentation is designed to equip entrepreneurs with the essential knowledge and tools needed to accurately value their businesses. Understanding business valuation is crucial for making informed decisions, whether you're seeking investment, planning to sell, or simply want to gauge your company's worth.
RMD24 | Debunking the non-endemic revenue myth Marvin Vacquier Droop | First ...BBPMedia1
Marvin neemt je in deze presentatie mee in de voordelen van non-endemic advertising op retail media netwerken. Hij brengt ook de uitdagingen in beeld die de markt op dit moment heeft op het gebied van retail media voor niet-leveranciers.
Retail media wordt gezien als het nieuwe advertising-medium en ook mediabureaus richten massaal retail media-afdelingen op. Merken die niet in de betreffende winkel liggen staan ook nog niet in de rij om op de retail media netwerken te adverteren. Marvin belicht de uitdagingen die er zijn om echt aansluiting te vinden op die markt van non-endemic advertising.
Unveiling the Secrets How Does Generative AI Work.pdfSam H
At its core, generative artificial intelligence relies on the concept of generative models, which serve as engines that churn out entirely new data resembling their training data. It is like a sculptor who has studied so many forms found in nature and then uses this knowledge to create sculptures from his imagination that have never been seen before anywhere else. If taken to cyberspace, gans work almost the same way.
What are the main advantages of using HR recruiter services.pdfHumanResourceDimensi1
HR recruiter services offer top talents to companies according to their specific needs. They handle all recruitment tasks from job posting to onboarding and help companies concentrate on their business growth. With their expertise and years of experience, they streamline the hiring process and save time and resources for the company.
Putting the SPARK into Virtual Training.pptxCynthia Clay
This 60-minute webinar, sponsored by Adobe, was delivered for the Training Mag Network. It explored the five elements of SPARK: Storytelling, Purpose, Action, Relationships, and Kudos. Knowing how to tell a well-structured story is key to building long-term memory. Stating a clear purpose that doesn't take away from the discovery learning process is critical. Ensuring that people move from theory to practical application is imperative. Creating strong social learning is the key to commitment and engagement. Validating and affirming participants' comments is the way to create a positive learning environment.
1. QUALITY TOOLS &
TECHNIQUES
By: -
Hakeem–Ur–Rehman
Certified Six Sigma Black Belt (SQII – Singapore)
IRCA (UK) Lead Auditor ISO 9001
MS–Total Quality Management (P.U.)
MSc (Information & Operations Management) (P.U.)
IQTM–PU
1
TQ T
SEVEN MANAGEMENT & PLANNING
TOOLS
2. What are the
New Seven Management
& Planning Tools?
1. Affinity Diagrams
2. Relations Diagrams
3. Tree Diagrams
4. Matrix Diagrams
5. Arrow Diagrams
6. Priority Matrix / Matrix Data Analysis
7. Process Decision Program Charts
3. History of the
New 7 Management Tools
Committee of J.U.S.E. (Union of Japanese Scientists
and Engineers) - 1972
Aim was to develop more QC techniques with design
approach
Work in conjunction with original Basic Seven Tools
New set of methods (N7) - 1977
Developed to organize verbal data diagrammatically.
Basic 7 tools effective for data analysis, process
control, and quality improvement (numerical data)
Used together increases TQM effectiveness
4. What are the
Basic 7 Q.C. Tools?
1. Flow Charts
2. Run Charts
3. Histograms
4. Pareto Diagrams
5. Cause and Effect Diagrams
6. Scatter Diagrams
7. Control Charts
5. Relation Between New Seven Management
Tools and Basic Seven Q.C. Tools
FACTS
Data
Numerical Data Verbal Data
Organize
The Seven New Tools
Information
The Basic Seven Tools
Generate Ideas
Formulate plans
Analytical approach
Define problem after
collecting numerical data
Define problem before
collecting numerical data
Source: Nayatani, Y., The Seven New QC Tools (Tokyo, Japan, 3A Corporation, 1984)
6. SEVEN MANAGEMENT & PLANNING
TOOLS TYPICAL FLOW
6
AFFINITY
DIAGRAM
INTERRELATIONSHIP
DIGRAPH
Creative Logical
TREE DIAGRAM /
SYSTEM FLOW
PRIORITIZATION
MATRICES
MATRIX
DIAGRAM
Unknown known
PROCESS DECISION
PROGRAM CHART
ACTIVITY NETWORK
DIAGRAM
SOURCE: M. Brassard, “The Memory Jogger II”, Goal/QPC. Boston, 2004
7. AFFINITY DIAGRAM
“A diagram that is used as a method of sorting qualitative data, which
usually comes in the form of short phrases or sentences (eg. 'Customers
are unhappy with delivery delays'). “
Affinity Diagrams are most commonly built using the 'KJ' method (named
after Kawakita Jiro, its originator), which aims to stimulate creative,
'right-brained' thought, rather than logical 'left-brained' thought, by
banning discussion during the building of the diagram.
1. Modification of traditional Brainstorming method
2. Technique to generate ideas and linkup with other ideas to
form common ideas
3. Facilitates breakthrough thinking and stimulate fresh ideas
4. Effective tool for cutting through confusion and bringing a
problem clearly into view
5. Widely used in the sorting stages
6. Develops consensus and team sprit among the members/
teams
8. HOW TO MAKE
AFFINITY DIAGRAM?
1. Problem is written on the center of the board
2. Each team/ member generates ideas to find the causes
of the problem
3. Each team/ member is encouraged to give more and
more ideas
4. Ideas are written on a small piece of paper (normally
3” x 5”)
5. Each paper is placed on the board around the problem
6. Team study and categories the similar ideas by
consensus
7. Ideas are reduced to a workable number of ideas and a
border line is drawn around these ideas
9. AFFINITY DIAGRAM:
EXAMPLE
Ambiguous
Material
PROBLEM
DEFECTIVE INCOMING MATERIALS
No Contract
Review
Lack of Skills of
Employees
(Supplier)
Supplier
Provided Poor
Quality of
Materials
Poor
Performing
Equipment
Lack of Skills of
Employees
(Purchasing Dept.)
Policy not
Clear
Not
Systematic
10. AFFINITY DIAGRAM:
EXAMPLE (Cont…)
Ambiguous
Material
PROBLEM
DEFECTIVE INCOMING MATERIALS
No Contract
Review
Supplier provided
Poor Quality of
Materials
Poor Performing
Equipment
Policy not Clear
Not Systematic
Lack of Skills of
Employees
(Supplier)
Lack of Skills of
Employees
(Purchasing Dept.)
Material
Specifications
Supplier
Commitment
Unsystematic
Purchase
Department
11. RELATION / RELATIONSHIP
DIAGRAM
The Relation Diagrams are used for finding appropriate
solution strategies by clarifying the causes of the
problem using why, why technique.
Also known as Interrelationship Diagraph
1. Technique for clarifying the complex issues by
considering the numerous possible causes
2. Useful tools for finding appropriate strategies by
relating different causes of a problem
3. Enables to identify the root causes of the problem
12. HOW TO MAKE
RELATION DIAGRAM?
Activity normally carried out after Affinity Diagram
1. Place the problem in the center
2. Write primary causes of the problem round it
3. Determine the secondary, tertiary, 4th & 5th level
causes by repeating why, why about 5-times
4. Review the whole diagram and systematically explore
the relationships among these causes
5. Many causes at 4th & 5th stage may have the common
reasons
6. Combine such reasons to reach the root cause of the
problem
13. COMPLETING A
RELATION DIAGRAM?
Why doesn’t
X happen?
Primary Cause
Primary Cause
Primary Cause
Primary Cause
Tertiary
Cause
Secondary
Cause
Secondary
Cause
Secondary
Cause
Secondary
Cause
Tertiary
Cause
4th level
Cause
Tertiary
Cause
Tertiary
Cause
4th level
Cause
5th level
Cause
6th level
Cause
Tertiary
Cause
Secondary
Cause
14. EXAMPLE: RELATION
DIAGRAM
Defective
incoming
Material
Ambiguous
Specifications
Poor quality
materials used
by supplier
Poor quality of
equipment
Unskilled
employees of
suppliers
Lack of
Commitment of
Supplier
No contract
review of
specifications
Policy not
Clear
Unsystematic
purchase
department
Lack of Skills of
employees
Root Causes: “A cause, which has no
incoming arrow, is called a root cause.
There are three root cause. But, the
most important root cause is the one
with maximum number of outgoing
arrows. This is also called Driver.
Measure of Success: “A
cause, which has maximum
number of incoming arrows,
is called an outcome. It will
also be a good measure of
success.”
15. TREE DIAGRAM
Also known as Systematic Diagram
Tree Diagrams are drawn to develop a succession of
strategies/ means for achieving an objective (target, goal or
result) systematically and logically.
Constructing this diagram yields specific guidelines for
solving a problem.
Tree Diagrams are also classified as strategy-development or
component development diagrams.
16. HOW TO MAKE TREE
DIAGRAM?
Write the objective on the left side
Think different strategies to achieve these
objectives in the form of primary branches
Again think different means to accomplish these
strategies in the form of secondary branches
In this way keep on stratifying till you find easy
solutions of a bigger problem
17. EXAMPLE: TREE DIAGRAM
ROGER’S TAKE–OUT PIZZA
CATEGORY OBJECTIVE STRATEGY
PRODUCT
SERVICE
Extra Value
Delivered Hot
Extra Meat
More Cheese
Fresh Vegetables
30 Min. Max Wait
Courteous order
takers
Friendly Drivers
Heated Compartments in Delivery Vans
Optimum Routing
Batch Delivery
Employee Training
Driver Rotation
Employee Training
18. MATRIX DIAGRAM
Matrix Diagrams enable the data based on ideas to be
employed effectively for examining the relationships.
They clarify the relationship among the different elements
based on verbal data (attribute data) like the scatter diagrams
show the correlation between different parameters based on
numerical data (variable data)
1. Two dimensional array of columns and rows whose
intersections are examined to determine the relationship
2. Used to systematically analyze the correlation between two
sets of attribute data
3. Sets of data are compared in rows and columns
4. Where rows and columns meet relationship code like strong
weak or no relation can be inserted
5. Explores relationship among the attributes of rows and
columns
19. EXAMPLE: MATRIX
DIAGRAM
Partial Matrix Program Chart for Roger’s Take-Out Pizza
Improved Improved Improved Improved
Action Employee Kitchen Delivery Controls
Objective Training Process Process
30 Min. Max. Wait
Friendly Drivers
Courteous Order Takers
KEY: Strong relationship
Moderate relationship
Weak relationship
20. ARROW DIAGRAM
Imagine that you have used a Tree Diagram or a Matrix Diagram to
decide on the best possible strategies for solving a problem.
The next question that arises is when and in what order to perform the
numerous operations required to implement these strategies.
Arrow diagrams are useful for planning this kind of action. They show the
sequence and relationships among different activities effectively. They
also indicate how altering one operation will effect the other and which
activities are critical to the time schedule and which have some slack or
spare time.
Also known as Activity Network diagram
1. Used in PERT (Program Evaluation and Review Technique) and CPM
(Critical Path Method)
2. Who is going to do what and when?
3. What can be done in parallel & what can be done only in series?
4. Planning Aid for construction projects & large manufacturing units
21. EXAMPLE: ARROW DIAGRAM
Consider the following data:
Activity Description Immediate
Predecessor(s)
A Select administrative and medical staff -
B Select site and do site survey -
C Select equipment A
D Prepare final construction plans and layout B
E Bring utilities to the site B
F Interview applicants and fill positions in nursing,
support staff, maintenance, & security
A
G Purchase and take delivery of equipment C
H Construct the hospital D
I Develop an information system A
J Install the equipment E, G, H
K Train nurses and support staff F, I, J
Draw the ARROW Diagram.
23. Activity Description Immediate
Predecessor(s)
A Procurement of parts for sub – assembly ‘1’ None
B Procurement of parts for sub – assembly ‘2’ None
C Procurement of parts for sub – assembly ‘3’ None
D Building sub – assembly ‘1’ A
E Building sub – assembly ‘2’ B
F Building sub – assembly ‘4’ D,E
G Building sub – assembly ‘3’ B,C
H Building the final product F,G
I Final Test H
Develop the ARROW DIAGRAM
QUESTION:
ARROW DIAGRAM
24. CRITICAL PATH METHOD: EXAMPLE
1 8
2
6
4
3
7
a, 6
f, 15
b, 8
c, 5
e, 9
d, 13
g, 17 h, 9
i, 6
j, 12
5
EXAMPLE:
ARROW DIAGRAM (Cont…)
25. ES and EF Times
1 8
2
6
4
3
7
a, 6
f, 15
b, 8
c, 5
e, 9
d, 13
g, 17 h, 9
i, 6
j, 12
5
0 6
0 8
0 5
5 14
8 21 21 33
6 23 21 30
23 29
6 21
Project’s EF = 33
EXAMPLE:
ARROW DIAGRAM (Cont…)
CPM: EXAMPLE
28. CRITICAL PATH
1 8
2
6
4
3
7
a, 6
f, 15
b, 8
c, 5
e, 9
d, 13
g, 17 h, 9
i, 6
j, 12
5
EXAMPLE:
ARROW DIAGRAM (Cont…)
CPM: EXAMPLE
29. Critical Path:
1 3 7 8
Activities on the Critical Path:
b d j
Total Project Time:
8+13+12 = 33
EXAMPLE:
ARROW DIAGRAM (Cont…)
CPM: EXAMPLE
30. Network Information
Country Engineers Design Department
ACTIVITY DESCRIPTION PROCEDING
ACTIVITY
ACTIVITY TIME
(Duration)
A Application
Approval
None 5
B Construction Plans A 15
C Traffic Study A 10
D Service Availability
Check
A 5
E Staff Report B,C 15
F Commission
Approval
B,C,D 10
G Wait for
Construction
F 170
H Occupancy E,G 35
QUESTION:
ARROW DIAGRAMCPM: QUESTION
31. PRIORITY MATRIX
It is just a kind of matrix in which same attributes/ strategies/ tasks are
written both horizontally and vertically. Then instead of finding
relationship among two different attributes, the importance of horizontally
placed attributes is compared with the vertically placed attribute.
In this way the importance of each task when compared to all other tasks
become visible.
This type of matrix is drawn when there are many tasks but there are not
enough resources. So instead of just thinking which tasks are more
important, the Priority Matrix is drawn.
Priority matrix is used when
1. There are more tasks than available resources
2. Numerous possibilities/ multiple choices exists
3. Selection criteria is complicated
4. Prioritizing between several viable options
32. EXAMPLE: PRIORITY
MATRIX There can be a number of requirements when you are going to buy a
new car but just for the sake of easy understanding of how to make a
Priority Matrix only four attributes of a car are chosen for prioritization.
These are superior sound system, fully automatic windows, fuel economy
and four wheel drive.
33. PROCESS DECISION
PROGRAM CHART
A framework for developing contingency plans
Starts with a tree diagram
Negative outcomes are considered for each branch
Contingency plans are listed
1. Tool for anticipating uncertainties
2. Contingency Plans for what could go wrong
3. Resemble FMEA
4. List the possible problems
5. Decide measures to be taken to solve those problems
6. Very useful when starting new procedure or project
34. PROCESS DECISION
PROGRAM CHART: EXAMPLE
GIVE GUEST LECTUREOBJECTIVE
Car to reach
venue
STEPS Use laptop
Use video
projector
Car breaks
down
WHAT
IF?
Hire a
car
Take a
public
transport
O
X
File not
found
Laptop fails
to operate
Use
CD
O
Ask
organizer
for PC &
Use CD
X
Video
projector fails
Use
White
Board
Use
overhead
projector
X
O
O Optimum
X Rejected