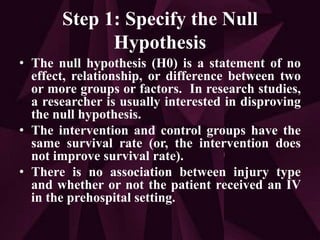
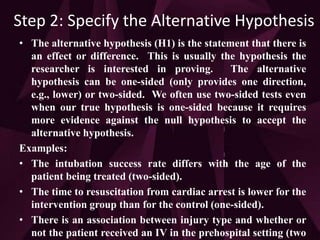
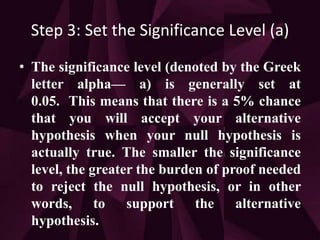
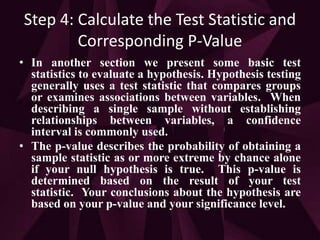
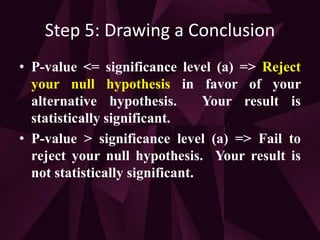
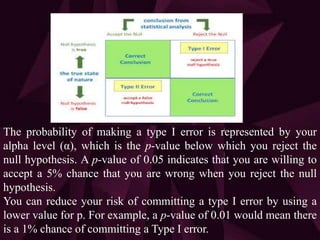
A hypothesis test examines two opposing hypotheses: the null hypothesis and alternative hypothesis. The null hypothesis is the statement being tested, usually stating "no effect". The alternative hypothesis is what the researcher hopes to prove true. A hypothesis test uses a sample to determine whether to reject the null hypothesis based on a p-value and significance level. There are 5 steps: specify null and alternative hypotheses, set significance level, calculate test statistic and p-value, and draw a conclusion. Type I and II errors are possible - type I rejects a true null hypothesis, type II fails to reject a false null hypothesis.