P-Value and Its Interpretation: Significance in Statistical Analysis.
The p-value (probability value) is a statistical measure that helps determine whether the results of an experiment are statistically significant or not.
P-Value and Its Interpretation: Significance in Statistical Analysis.
1.
P VALUE ANDITS INTERPRETATION
Name: Aditya Santosh Ambi
Department: M pharmacy[Pharmaceutics]
Roll no. MPPH003001 1
DR. BABASAHEB AMBEDKAR MARATHWADA
UNIVERSITY
CHH. SAMBHIJINAGAR
UNIVERSITY DEPARTMENT OF CHEMICAL
TECHNOLOGY
2.
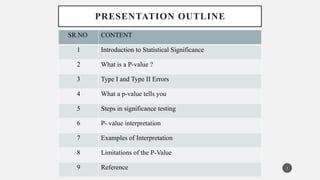
PRESENTATION OUTLINE
SR.NO CONTENT
1Introduction to Statistical Significance
2 What is a P-value ?
3 Type I and Type II Errors
4 What a p-value tells you
5 Steps in significance testing
6 P- value interpretation
7 Examples of Interpretation
8 Limitations of the P-Value
9 Reference 2
3.
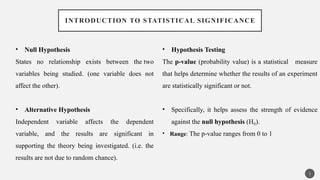
INTRODUCTION TO STATISTICALSIGNIFICANCE
3
• Hypothesis Testing
The p-value (probability value) is a statistical measure
that helps determine whether the results of an experiment
are statistically significant or not.
• Specifically, it helps assess the strength of evidence
against the null hypothesis (H ).
₀
• Range: The p-value ranges from 0 to 1
• Null Hypothesis
States no relationship exists between the two
variables being studied. (one variable does not
affect the other).
• Alternative Hypothesis
Independent variable affects the dependent
variable, and the results are significant in
supporting the theory being investigated. (i.e. the
results are not due to random chance).
4.
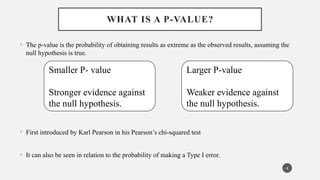
WHAT IS AP-VALUE?
4
• The p-value is the probability of obtaining results as extreme as the observed results, assuming the
null hypothesis is true.
• First introduced by Karl Pearson in his Pearson’s chi-squared test
• It can also be seen in relation to the probability of making a Type I error.
Smaller P- value
Stronger evidence against
the null hypothesis.
Larger P-value
Weaker evidence against
the null hypothesis.
5.
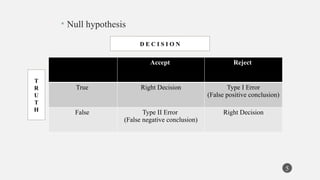
• Null hypothesis
5
AcceptReject
True Right Decision Type I Error
(False positive conclusion)
False Type II Error
(False negative conclusion)
Right Decision
T
R
U
T
H
D E C I S I O N
6.
WHAT P-VALUE TELLSYOU?
6
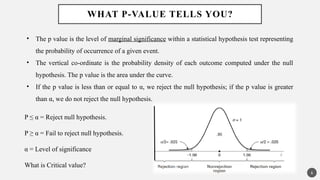
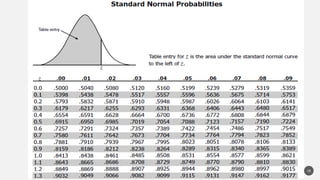
• The p value is the level of marginal significance within a statistical hypothesis test representing
the probability of occurrence of a given event.
• The vertical co-ordinate is the probability density of each outcome computed under the null
hypothesis. The p value is the area under the curve.
• If the p value is less than or equal to α, we reject the null hypothesis; if the p value is greater
than α, we do not reject the null hypothesis.
P ≤ α = Reject null hypothesis.
P ≥ α = Fail to reject null hypothesis.
α = Level of significance
What is Critical value?
7.
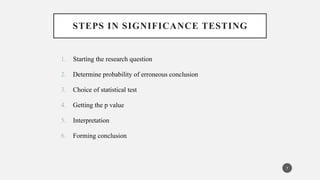
STEPS IN SIGNIFICANCETESTING
1. Starting the research question
2. Determine probability of erroneous conclusion
3. Choice of statistical test
4. Getting the p value
5. Interpretation
6. Forming conclusion
7
8.
P- VALUE INTERPRETATION
8
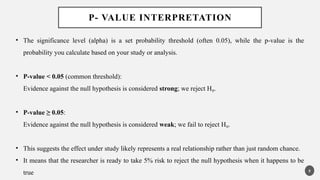
•The significance level (alpha) is a set probability threshold (often 0.05), while the p-value is the
probability you calculate based on your study or analysis.
• P-value < 0.05 (common threshold):
Evidence against the null hypothesis is considered strong; we reject H .
₀
• P-value ≥ 0.05:
Evidence against the null hypothesis is considered weak; we fail to reject H .
₀
• This suggests the effect under study likely represents a real relationship rather than just random chance.
• It means that the researcher is ready to take 5% risk to reject the null hypothesis when it happens to be
true
9.
EXAMPLES OF INTERPRETATION
9
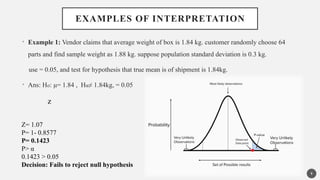
•Example 1: Vendor claims that average weight of box is 1.84 kg. customer randomly choose 64
parts and find sample weight as 1.88 kg. suppose population standard deviation is 0.3 kg.
use = 0.05, and test for hypothesis that true mean is of shipment is 1.84kg.
• Ans: Ho: μ= 1.84 , Hα≠ 1.84kg, = 0.05
z
Z= 1.07
P= 1- 0.8577
P= 0.1423
P> α
0.1423 > 0.05
Decision: Fails to reject null hypothesis
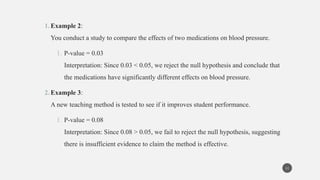
1.Example 2:
You conducta study to compare the effects of two medications on blood pressure.
1. P-value = 0.03
Interpretation: Since 0.03 < 0.05, we reject the null hypothesis and conclude that
the medications have significantly different effects on blood pressure.
2.Example 3:
A new teaching method is tested to see if it improves student performance.
1. P-value = 0.08
Interpretation: Since 0.08 > 0.05, we fail to reject the null hypothesis, suggesting
there is insufficient evidence to claim the method is effective.
11
12.
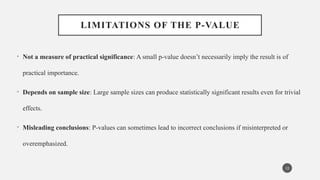
LIMITATIONS OF THEP-VALUE
• Not a measure of practical significance: A small p-value doesn’t necessarily imply the result is of
practical importance.
• Depends on sample size: Large sample sizes can produce statistically significant results even for trivial
effects.
• Misleading conclusions: P-values can sometimes lead to incorrect conclusions if misinterpreted or
overemphasized.
12
13.
REFERENCES
13
• Wayne w.Daniel
BIOSTATISTICS A Foundation for Analysis in the Health Sciences
Emeritus Georgia State University, Ninth edition.
• Fisher, R. A. (1925).
Statistical Methods for Research Workers
Fisher introduced many foundational concepts in statistical inference, including the p-
value.
• Wasserstein, R. L., & Lazar, N. A. (2016).
"The ASA's Statement on P-Values: Context, Process, and Purpose." The American
Statistician, 70(2), 129-133.
![P VALUE AND ITS INTERPRETATION
Name: Aditya Santosh Ambi
Department: M pharmacy[Pharmaceutics]
Roll no. MPPH003001 1
DR. BABASAHEB AMBEDKAR MARATHWADA
UNIVERSITY
CHH. SAMBHIJINAGAR
UNIVERSITY DEPARTMENT OF CHEMICAL
TECHNOLOGY](https://image.slidesharecdn.com/pvalueaditya2-250402101701-f81ef274/85/P-Value-and-Its-Interpretation-Significance-in-Statistical-Analysis-1-320.jpg)
![P VALUE AND ITS INTERPRETATION
Name: Aditya Santosh Ambi
Department: M pharmacy[Pharmaceutics]
Roll no. MPPH003001 1
DR. BABASAHEB AMBEDKAR MARATHWADA
UNIVERSITY
CHH. SAMBHIJINAGAR
UNIVERSITY DEPARTMENT OF CHEMICAL
TECHNOLOGY](https://image.slidesharecdn.com/pvalueaditya2-250402101701-f81ef274/75/P-Value-and-Its-Interpretation-Significance-in-Statistical-Analysis-1-2048.jpg)


![CASE_PRESENTATION_ON_subdural_hematoma(SDH)[1 FINAL PPT]-1.pptx](https://cdn.slidesharecdn.com/ss_thumbnails/casepresentationonsubduralhematomasdh1finalppt-1-260129172522-d405d375-thumbnail.jpg?width=640&height=640&fit=bounds)


