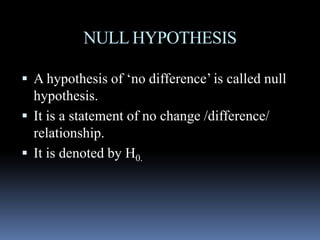
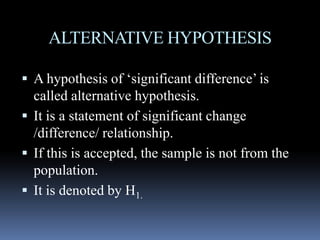
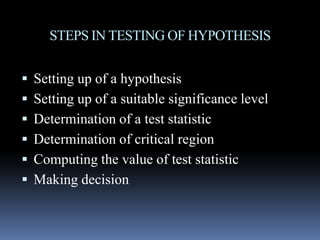
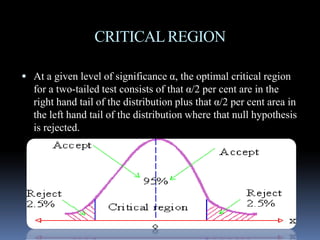
CONTENTS
 Definition
 Types of hypothesis
 Testing of hypothesis
INTRODUCTION
 A statement which is accepted temporarily as
true and on this basis the research work
confines.confines.
TYPES OF HYPOTHESIS
 NULL HYPOTHESIS
 ALTERNATIVE HYPOTHESIS
NULL HYPOTHESIS
 A hypothesis of ‘no difference’ is called null
hypothesis.
 It is a statement of no change /difference/ It is a statement of no change /difference/
relationship.
 It is denoted by H0.
ALTERNATIVE HYPOTHESIS
 A hypothesis of ‘significant difference’ is
called alternative hypothesis.
 It is a statement of significant change It is a statement of significant change
/difference/ relationship.
 If this is accepted, the sample is not from the
population.
 It is denoted by H1.
STEPS IN TESTING OF HYPOTHESIS
 Setting up of a hypothesis
 Setting up of a suitable significance level
 Determination of a test statistic Determination of a test statistic
 Determination of critical region
 Computing the value of test statistic
 Making decision
SETTING UP OFAHYPOTHESIS
 NULL HYPOTHESIS
 ALTERNATIVE HYPOTHESIS ALTERNATIVE HYPOTHESIS
LEVEL OF SIGNIFICANCE
 The probability to which null hypothesis is
rejected when it is true. It is generally of 2
types:types:
1% level of significance
5% level of significance
TEST STATISTIC
 Chi-square test – non-parametric test
(qualitative characters)
 F-test or ANOVA - multiple factors
 Z-test- large samples
 t-test- small samples
CRITICALREGION
 At a given level of significance α, the optimal critical region
for a two-tailed test consists of that α/2 per cent are in the
right hand tail of the distribution plus that α/2 per cent area in
the left hand tail of the distribution where that null hypothesisthe left hand tail of the distribution where that null hypothesis
is rejected.
VALUE OF TEST STATISTIC
 If calculated value is less than the tabulated value
with n-1 degree of freedom at chosen level of
significance, null hypothesis is accepted. This means
that there is no significant difference between sample
mean and population mean.
 If calculated value is more than the tabulated value
with n-1 degree of freedom at chosen level of
significance, null hypothesis is rejected. This means
that there is significant difference between sample
mean and population mean.
TAKING THE DECISION
 The hypothesis may be accepted or rejected depending upon
whether the value of the test statistic falls in the rejection or
acceptance region.
 If the hypothesis is being tested at 5 per cent level of
significance, it would be rejected if the observed results have
a probability less than 5%.a probability less than 5%.
 In such a case, the difference between the sample statistic and
the hypothesized population parameter is considered to be
significant.
 On the other hand, if the hypothesis is accepted, the difference
between the sample statistic and the hypothesized population
parameter is not regarded as significant and can be attributed
to chance.
REFERENCES
 Research Methodology- Dr. Kirti Gupta
 Research Methodology Methods and Techniques- C R
Kothari and Gaurav Garg
 Research Methodology- Dr. Prasant Sarangi
 Research Methodology Concepts and Cases- Deepak Chawla
and Neena Sondhi
 Statistics in Psychology and Education- S.K. Mangal

Hypothesis

  • 2.
    CONTENTS  Definition  Typesof hypothesis  Testing of hypothesis
  • 3.
    INTRODUCTION  A statementwhich is accepted temporarily as true and on this basis the research work confines.confines.
  • 4.
    TYPES OF HYPOTHESIS NULL HYPOTHESIS  ALTERNATIVE HYPOTHESIS
  • 5.
    NULL HYPOTHESIS  Ahypothesis of ‘no difference’ is called null hypothesis.  It is a statement of no change /difference/ It is a statement of no change /difference/ relationship.  It is denoted by H0.
  • 6.
    ALTERNATIVE HYPOTHESIS  Ahypothesis of ‘significant difference’ is called alternative hypothesis.  It is a statement of significant change It is a statement of significant change /difference/ relationship.  If this is accepted, the sample is not from the population.  It is denoted by H1.
  • 7.
    STEPS IN TESTINGOF HYPOTHESIS  Setting up of a hypothesis  Setting up of a suitable significance level  Determination of a test statistic Determination of a test statistic  Determination of critical region  Computing the value of test statistic  Making decision
  • 8.
    SETTING UP OFAHYPOTHESIS NULL HYPOTHESIS  ALTERNATIVE HYPOTHESIS ALTERNATIVE HYPOTHESIS
  • 9.
    LEVEL OF SIGNIFICANCE The probability to which null hypothesis is rejected when it is true. It is generally of 2 types:types: 1% level of significance 5% level of significance
  • 10.
    TEST STATISTIC  Chi-squaretest – non-parametric test (qualitative characters)  F-test or ANOVA - multiple factors  Z-test- large samples  t-test- small samples
  • 11.
    CRITICALREGION  At agiven level of significance α, the optimal critical region for a two-tailed test consists of that α/2 per cent are in the right hand tail of the distribution plus that α/2 per cent area in the left hand tail of the distribution where that null hypothesisthe left hand tail of the distribution where that null hypothesis is rejected.
  • 12.
    VALUE OF TESTSTATISTIC  If calculated value is less than the tabulated value with n-1 degree of freedom at chosen level of significance, null hypothesis is accepted. This means that there is no significant difference between sample mean and population mean.  If calculated value is more than the tabulated value with n-1 degree of freedom at chosen level of significance, null hypothesis is rejected. This means that there is significant difference between sample mean and population mean.
  • 14.
    TAKING THE DECISION The hypothesis may be accepted or rejected depending upon whether the value of the test statistic falls in the rejection or acceptance region.  If the hypothesis is being tested at 5 per cent level of significance, it would be rejected if the observed results have a probability less than 5%.a probability less than 5%.  In such a case, the difference between the sample statistic and the hypothesized population parameter is considered to be significant.  On the other hand, if the hypothesis is accepted, the difference between the sample statistic and the hypothesized population parameter is not regarded as significant and can be attributed to chance.
  • 16.
    REFERENCES  Research Methodology-Dr. Kirti Gupta  Research Methodology Methods and Techniques- C R Kothari and Gaurav Garg  Research Methodology- Dr. Prasant Sarangi  Research Methodology Concepts and Cases- Deepak Chawla and Neena Sondhi  Statistics in Psychology and Education- S.K. Mangal