Download to read offline


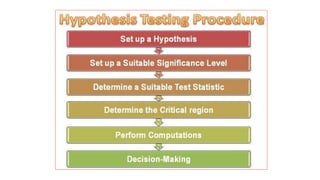
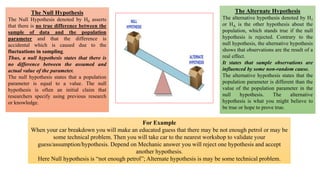
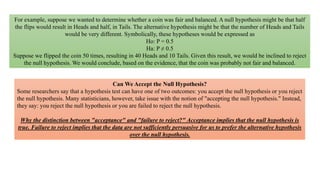
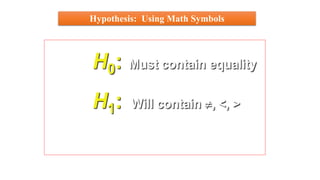
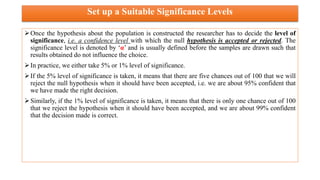
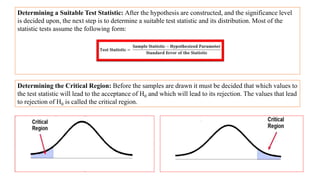
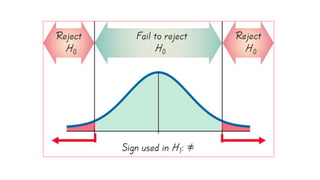
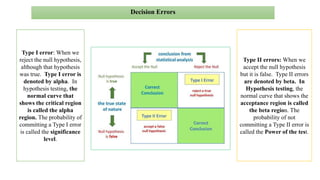
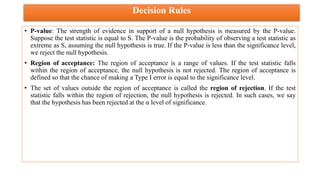
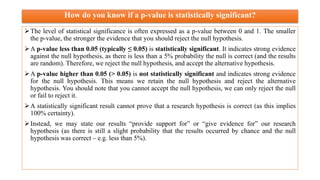
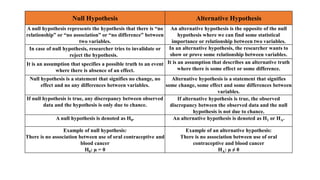

The document discusses hypothesis testing, which involves testing a hypothesis about a population using a sample of data. It explains that a hypothesis test has four main steps: 1) stating the null and alternative hypotheses, where the null hypothesis asserts there is no difference between the sample and population, 2) setting the significance level, 3) determining the test statistic and critical region for rejecting the null hypothesis, and 4) making a decision to reject or fail to reject the null hypothesis based on whether the test statistic falls in the critical region. Type I and type II errors are also defined. The document provides examples of null and alternative hypotheses using mathematical symbols and discusses how to determine if a p-value is statistically significant.