Downloaded 588 times


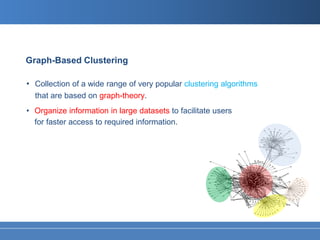


The document discusses graph-based clustering methods. It describes how graphs can be used to represent real-world networks from domains like biology, technology, social networks, and economics. It introduces the idea of using minimal spanning trees and hierarchical clustering to identify clusters in graph data. Two common algorithms for finding minimal spanning trees are described: Prim's algorithm and Kruskal's algorithm. Different strategies for iteratively deleting branches from the minimal spanning tree are also summarized to form clusters, such as deleting the branch with the maximum weight or inconsistent branches based on a reference value.