Download to read offline


![Evaluation Matrix
A C F
Ecological Footprint B D E
Fossil Agricultural Forestry TOTAL
[ha/capita] Degradation Cereals Pastures
energy growing running
www.upc.edu
1 ALIMENTATION
11 Vegetables
12 Animal
2 HOUSING
21 Construction
22 Operation
3 TRANSPORT
31 Private
32 Public
33 Of products
4 CONSUMPTIN GOODS
41 Packing
42 Clothing
43 Furniture
44 Books/Journals
45 Tobacco/Alcohol
46 Personal care
47 Recreational
equipment
48 Others
5 SERVICES
51 Government + Army
52 Education
53 Health
54 Social Services
55 Tourism
56 Culture
57 Banking/Financing
58 Others
TOTAL](https://image.slidesharecdn.com/introducatiosdforenginers-segalas-120203134639-phpapp02/85/Introducatio-SD-for-enginers-13-320.jpg)
![Example: Canada 1991
A C F
Ecological Footprint B D E
Fossil Agricultural Forestry TOTAL
[ha/capita] Degradation Cereals Pastures
energy growing running
1 ALIMENTATION 0.33 0.02 0.60 0.33 0.02 1.30
www.upc.edu
11 Vegetables 0.14 0.02 0.18 0.01
12 Animal 0.19 0.42 0.33 0.01
2 HOUSING 0.41 0.08 0.002 0.40 0.89
21 Construction 0.06 0.35
22 Operation 0.35 0.05
3 TRANSPORT 0.79 0.10 0.89
31 Private 0.60
32 Public 0.07
33 Of products 0.12
4 CONSUMPTIN GOODS 0.52 0.01 0.06 0.13 0.17 0.89
41 Packing 0.10 0.04
42 Clothing 0.11 0.02 0.13
43 Furniture 0.06 0.03
44 Books/Journals 0.06 0.10
45 Tobacco/Alcohol 0.06 0.04
46 Personal care 0.03
47 Recreational equipment 0.10
48 Others 0.00
5 SERVICES 0.29 0.01 0.30
51 Government + Army 0.06
52 Education 0.08
53 Health 0.08
54 Social Services 0.00
55 Tourism 0.01
56 Culture 0.01
57 Banking/Financing 0.00
58 Others 0.05
TOTAL 2.34 0.20 0.02 0.66 0.46 0.59 4.27](https://image.slidesharecdn.com/introducatiosdforenginers-segalas-120203134639-phpapp02/85/Introducatio-SD-for-enginers-14-320.jpg)


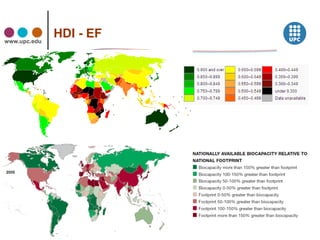


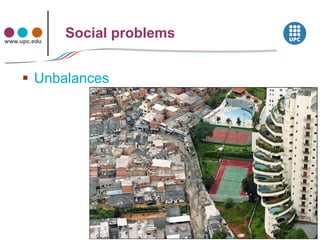
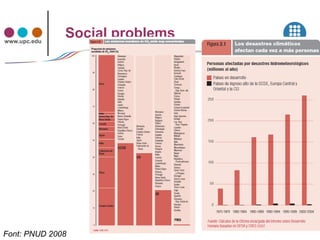


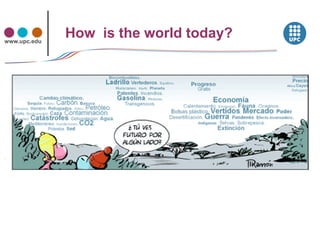
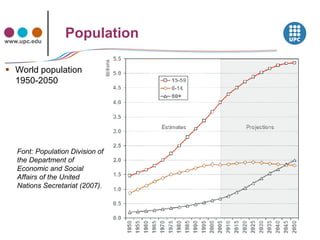
The document discusses concepts related to sustainability including carrying capacity, ecological footprint, and the IPAT equation. It provides data on historical and projected world population growth. Examples are given showing the ecological footprint of different countries and how it is calculated based on factors like energy use, agriculture, transportation, housing, goods and services. The human development index is also introduced as a broader measure than GDP for assessing well-being. Graphs illustrate the relationship between increasing HDI, ecological footprint, and the goal of transitioning to sustainable development.


