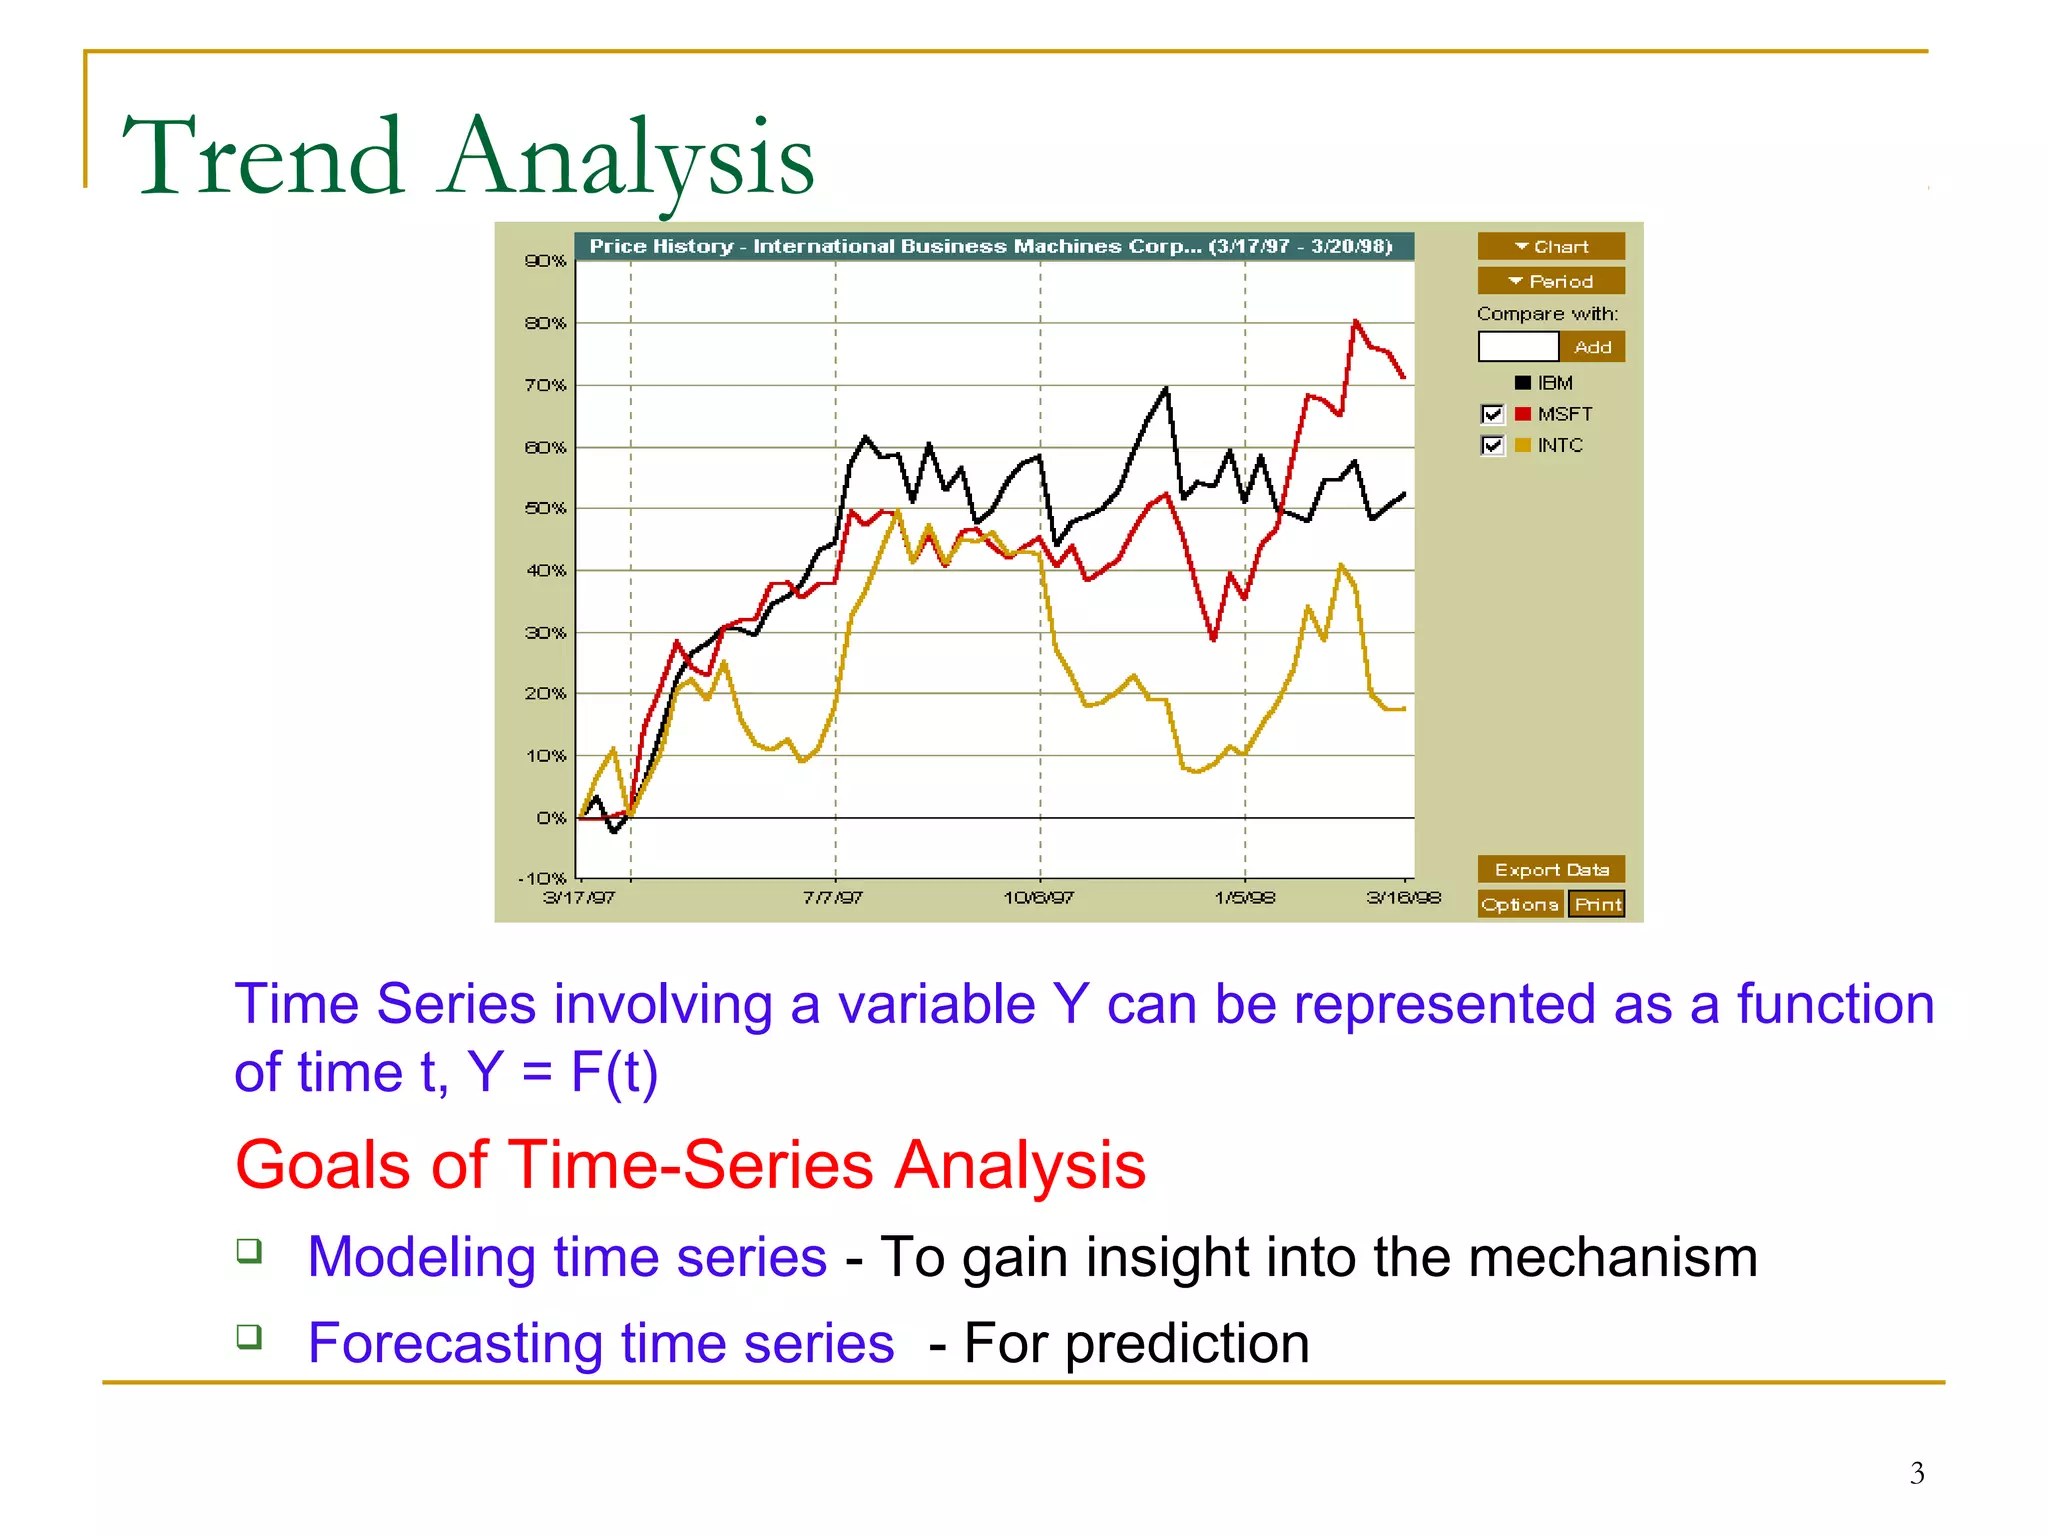
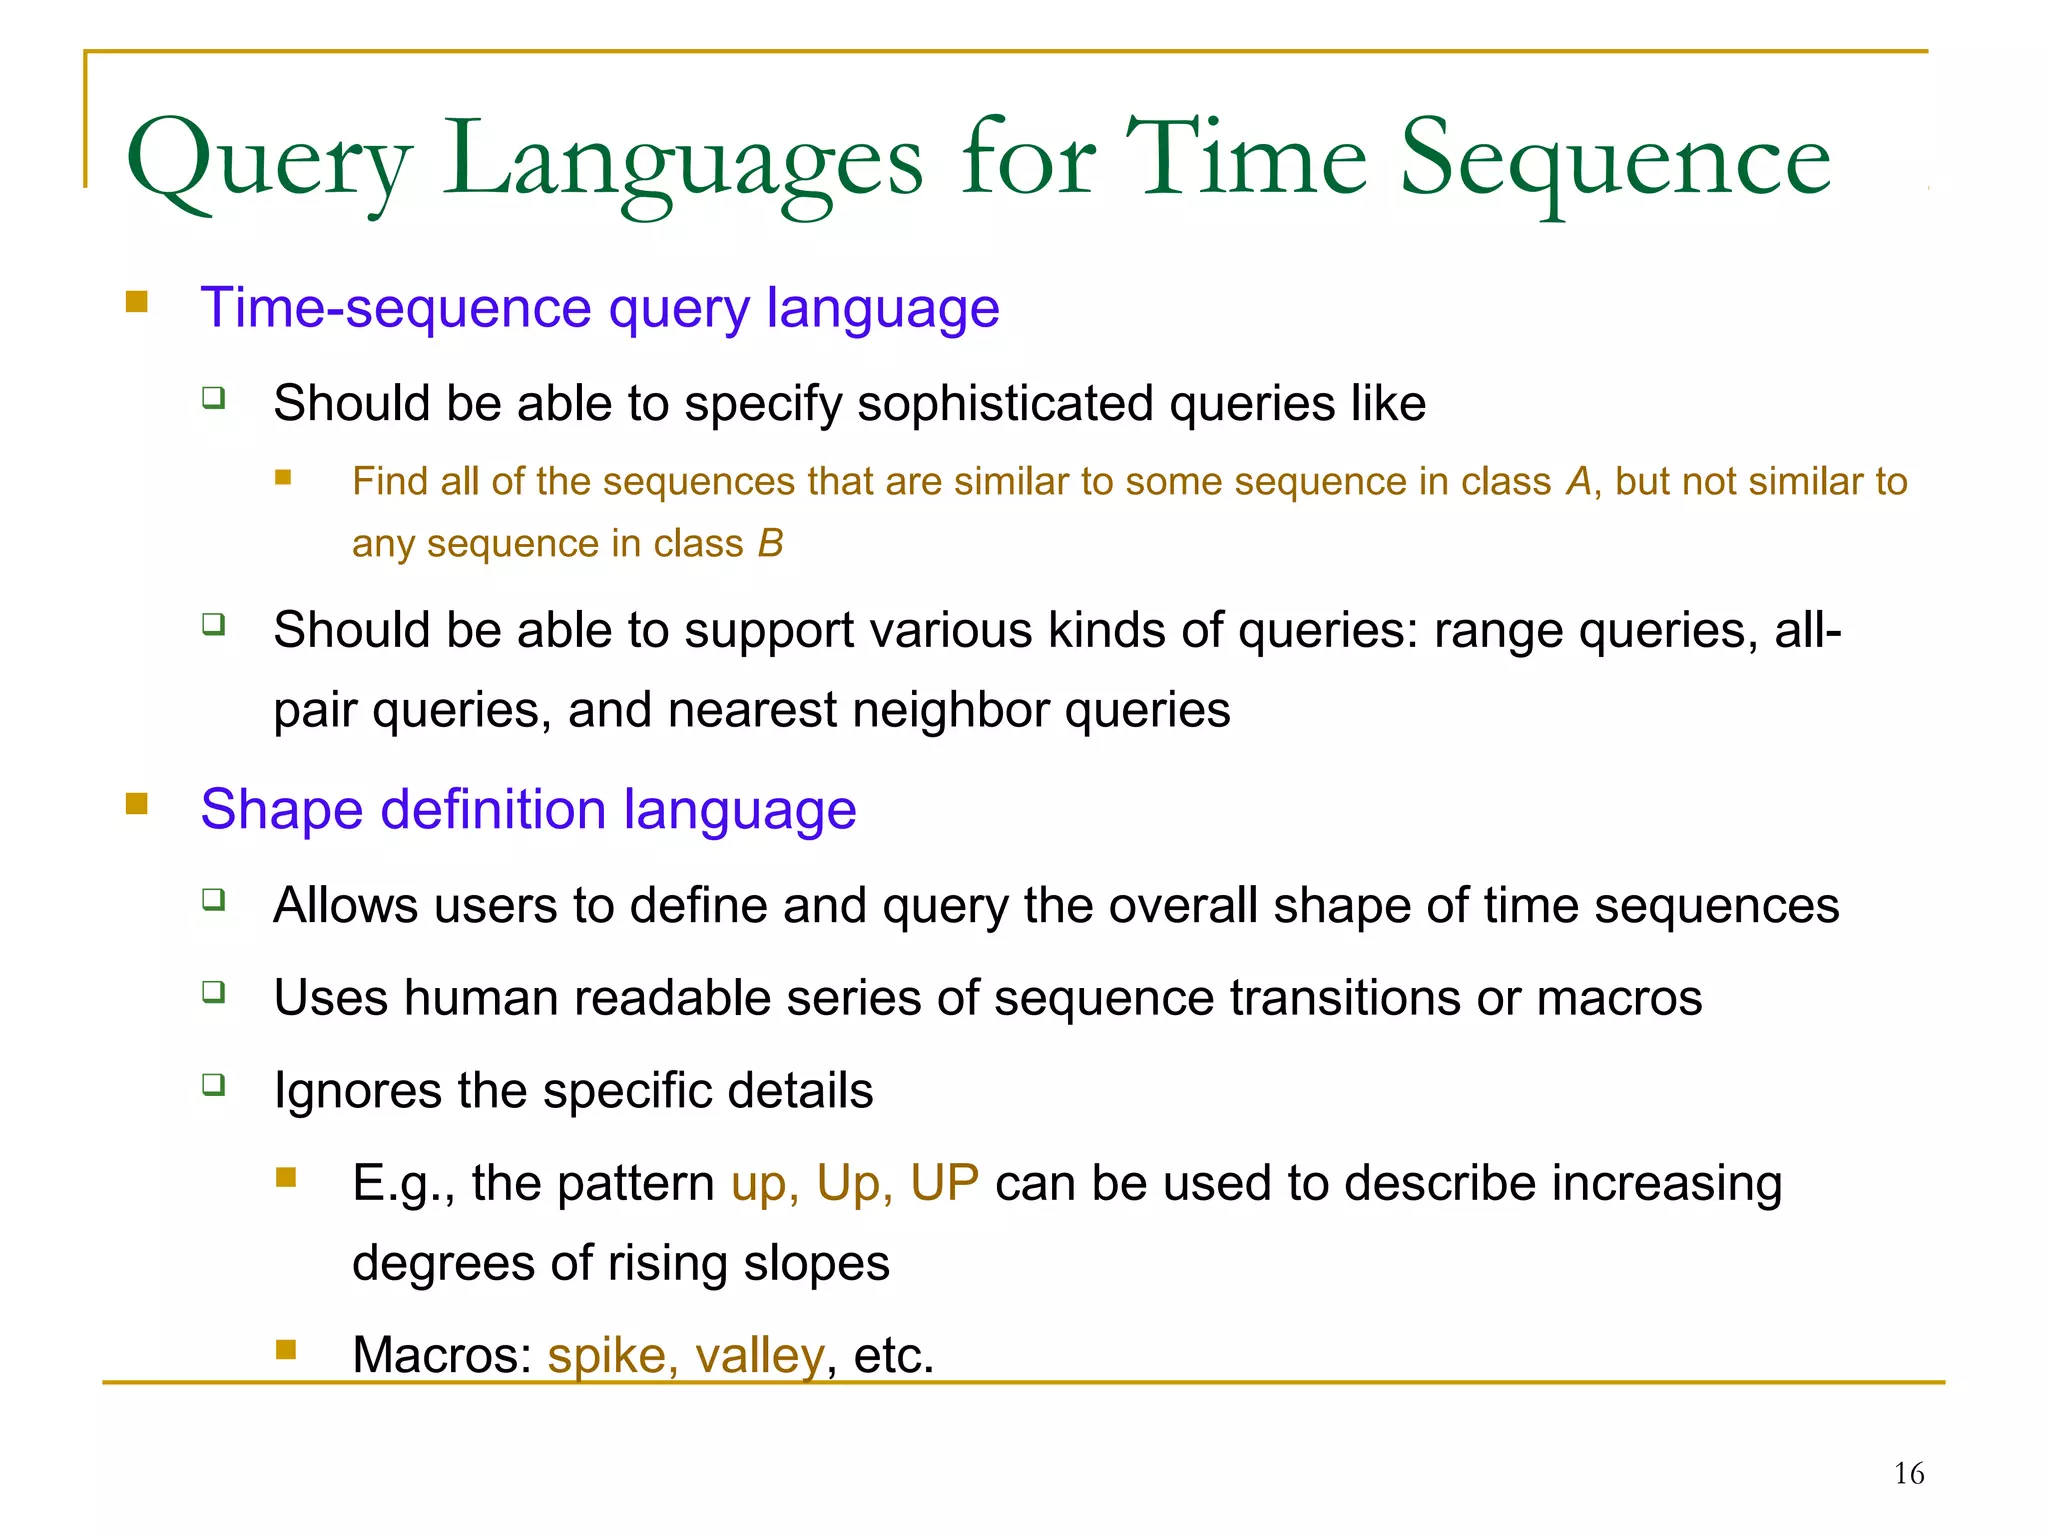
This document discusses time-series data and methods for analyzing it. Time-series data consists of sequential values measured over time that can be analyzed to identify patterns, trends, and outliers. Key methods discussed include trend analysis to identify long-term movements, seasonal variations, and irregular components; similarity search to find similar sequences; and dimensionality reduction and transformation techniques to reduce data size before analysis or indexing.
This presentation briefly discusses about the following topics:
Data Analytics Lifecycle
Importance of Data Analytics Lifecycle
Phase 1: Discovery
Phase 2: Data Preparation
Phase 3: Model Planning
Phase 4: Model Building
Phase 5: Communication Results
Phase 6: Operationalize
Data Analytics Lifecycle Example
With the expansion of big data and analytics, organizations are looking to incorporate data streaming into their business processes to make real-time decisions.
Join this webinar as we guide you through the buzz around data streams:
- Market trends in stream processing
- What is stream processing
- How does stream processing compare to traditional batch processing
- High and low volume streams
- The possibilities of working with data streaming and the benefits it provides to organizations
- The importance of spatial data in streams
Classification of common clustering algorithm and techniques, e.g., hierarchical clustering, distance measures, K-means, Squared error, SOFM, Clustering large databases.
The French Revolution, which began in 1789, was a period of radical social and political upheaval in France. It marked the decline of absolute monarchies, the rise of secular and democratic republics, and the eventual rise of Napoleon Bonaparte. This revolutionary period is crucial in understanding the transition from feudalism to modernity in Europe.
For more information, visit-www.vavaclasses.com
2024.06.01 Introducing a competency framework for languag learning materials ...Sandy Millin
http://sandymillin.wordpress.com/iateflwebinar2024
Published classroom materials form the basis of syllabuses, drive teacher professional development, and have a potentially huge influence on learners, teachers and education systems. All teachers also create their own materials, whether a few sentences on a blackboard, a highly-structured fully-realised online course, or anything in between. Despite this, the knowledge and skills needed to create effective language learning materials are rarely part of teacher training, and are mostly learnt by trial and error.
Knowledge and skills frameworks, generally called competency frameworks, for ELT teachers, trainers and managers have existed for a few years now. However, until I created one for my MA dissertation, there wasn’t one drawing together what we need to know and do to be able to effectively produce language learning materials.
This webinar will introduce you to my framework, highlighting the key competencies I identified from my research. It will also show how anybody involved in language teaching (any language, not just English!), teacher training, managing schools or developing language learning materials can benefit from using the framework.
Ethnobotany and Ethnopharmacology:
Ethnobotany in herbal drug evaluation,
Impact of Ethnobotany in traditional medicine,
New development in herbals,
Bio-prospecting tools for drug discovery,
Role of Ethnopharmacology in drug evaluation,
Reverse Pharmacology.
Instructions for Submissions thorugh G- Classroom.pptxJheel Barad
This presentation provides a briefing on how to upload submissions and documents in Google Classroom. It was prepared as part of an orientation for new Sainik School in-service teacher trainees. As a training officer, my goal is to ensure that you are comfortable and proficient with this essential tool for managing assignments and fostering student engagement.
How to Create Map Views in the Odoo 17 ERPCeline George
The map views are useful for providing a geographical representation of data. They allow users to visualize and analyze the data in a more intuitive manner.
This is a presentation by Dada Robert in a Your Skill Boost masterclass organised by the Excellence Foundation for South Sudan (EFSS) on Saturday, the 25th and Sunday, the 26th of May 2024.
He discussed the concept of quality improvement, emphasizing its applicability to various aspects of life, including personal, project, and program improvements. He defined quality as doing the right thing at the right time in the right way to achieve the best possible results and discussed the concept of the "gap" between what we know and what we do, and how this gap represents the areas we need to improve. He explained the scientific approach to quality improvement, which involves systematic performance analysis, testing and learning, and implementing change ideas. He also highlighted the importance of client focus and a team approach to quality improvement.
The Art Pastor's Guide to Sabbath | Steve ThomasonSteve Thomason
What is the purpose of the Sabbath Law in the Torah. It is interesting to compare how the context of the law shifts from Exodus to Deuteronomy. Who gets to rest, and why?
2. Time-Series Database
Consists of sequences of values or events obtained over
repeated measurements of time (weekly, hourly…)
Stock market analysis, economic and sales forecasting, scientific
and engineering experiments, medical treatments etc.
Can also be considered as a Sequence database
Consists of a sequence of ordered events (time – optional)
Web page Traversal Sequence
Time-Series data can be analyzed to:
Identify correlations
Similar / Regular patterns, trends, outliers
2
3. Trend Analysis
Time Series involving a variable Y can be represented as a function
of time t, Y = F(t)
Goals of Time-Series Analysis
Modeling time series - To gain insight into the mechanism
Forecasting time series - For prediction
3
4. Trend Analysis
Trend Analysis Components
Long-term or trend movements (trend curve): general direction in
which a time series is moving over a long interval of time
Cyclic movements or cycle variations: long term oscillations
about a trend line or curve
e.g., business cycles, may or may not be periodic
Seasonal movements or seasonal variations
i.e, almost identical patterns that a time series appears to
follow during corresponding months of successive years.
Irregular or random movements
Time series analysis: decomposition of a time series into
these four basic movements
Additive Model: TS = T + C + S + I
Multiplicative Model: TS = T × C × S × I
4
5. Trend Analysis
Adjusting Seasonal fluctuations
Given a series of measurements y1, y,2, y3… influences of the data
that are systematic / calendar related must be removed
Fluctuations conceal true underlying movement of the series and non-seasonal
characteristics
De-seasonalize the data
Seasonal Index – set of numbers showing the relative values of a
variable during the months of a year
Sales during Oct, Nov, Dec – 80%, 120% and 140% of average monthly sales –
Seasonal index – 80, 120, 140
Dividing original monthly data by seasonal index – De-seasonalizes data
Auto-Correlation Analysis
To detect correlations between ith element and (i-k)th element k- lag
Pearson’s coefficient can be used between <y1, y2,…yN-k> and <yk+1,
yk+2, ..yN>
5
6. Trend Analysis
Estimating Trend Curves
The freehand method
Fit the curve by looking at the graph
Costly and barely reliable for large-scaled data mining
The least-square method
Find the curve minimizing the sum of the squares of the
deviation di of points yi on the curve from the corresponding
data points - ∑i=1
n
di
2
The moving-average method
6
7. Trend Analysis
Moving Average Method
Smoothes the data
Eliminates cyclic, seasonal and irregular movements
Loses the data at the beginning or end of a series
Sensitive to outliers (can be reduced by Weighted Moving Average)
Assigns greater weight to center elements to eliminate smoothing effects
Ex: 3 7 2 0 4 5 9 7 2
Moving average of order 3: 4 3 2 3 6 7 6
Weighted average (1 4 1): 5.5 2.5 1 3.5 5.5 8 6.5
7
8. Trend Analysis
Once trends are detected data can be divided by
corresponding trend values
Cyclic Variations can be handled using Cyclic Indexes
Time-Series Forecasting
Long term / Short term predictions
ARIMA – Auto-Regressive Integrated Moving Average
8
9. Similarity Search
Normal database query finds exact match
Similarity search finds data sequences that differ only slightly
from the given query sequence
Two categories of similarity queries
Whole matching: find a sequence that is similar to the query
sequence
Subsequence matching: find all pairs of similar sequences
Typical Applications
Financial market
Market basket data analysis
Scientific databases
Medical diagnosis
9
10. Data Reduction and Transformation
Time Series data – high-dimensional data – each point
of time can be viewed as a dimension
Dimensionality Reduction techniques
Signal Processing techniques
Discrete Fourier Transform
Discrete Wavelet Transform
Singular Value Decomposition based on PCA
Random projection-based Sketches
Time Series data is transformed and strongest coefficients –
features
Techniques may require values in Frequency domain
Distance preserving Ortho-normal transformations
The distance between two signals in the time domain is the same as their
Euclidean distance in the frequency domain
10
11. Indexing methods for Similarity
Search
Multi-dimensional index
Use the index to retrieve the sequences that are at most a certain
small distance away from the query sequence
Perform post-processing by computing the actual distance
between sequences in the time domain and discard any false
matches
Sequence is mapped to trails, trail is divided into sub-trails
Indexing techniques
R-trees, R*-trees, Suffix trees etc
11
12. Subsequence Matching
Break each sequence into a set of pieces of window with length w
Extract the features of the subsequence inside the window
Map each sequence to a “trail” in the feature space
Divide the trail of each sequence into “subtrails” and represent each
of them with minimum bounding rectangle
Use a multi-piece assembly algorithm to search for longer sequence
matches
Uses Euclidean distance (Sensitive to outliers)
12
13. Similarity Search Methods
Practically there maybe differences in the baseline and
scale
Distance from one baseline to another – offset
Data has to be normalized
Sequence X = <x1, x2, ..xn> can be replaced by X’ = <x1’, x2’, …xn’>
where xi’ = xi - µ / σ
Two subsequences are considered similar if one lies within an
envelope of ε width around the other, ignoring outliers
Two sequences are said to be similar if they have enough non-
overlapping time-ordered pairs of similar subsequences
Parameters specified by a user or expert: sliding window size,
width of an envelope for similarity, maximum gap, and matching
fraction
13
15. Similarity Search Method
Atomic matching
Find all pairs of gap-free windows of a small length that are
similar
Window stitching
Stitch similar windows to form pairs of large similar
subsequences allowing gaps between atomic matches
Subsequence Ordering
Linearly order the subsequence matches to determine whether
enough similar pieces exist
15
16. Query Languages for Time Sequence
Time-sequence query language
Should be able to specify sophisticated queries like
Find all of the sequences that are similar to some sequence in class A, but not similar to
any sequence in class B
Should be able to support various kinds of queries: range queries, all-
pair queries, and nearest neighbor queries
Shape definition language
Allows users to define and query the overall shape of time sequences
Uses human readable series of sequence transitions or macros
Ignores the specific details
E.g., the pattern up, Up, UP can be used to describe increasing
degrees of rising slopes
Macros: spike, valley, etc.
16