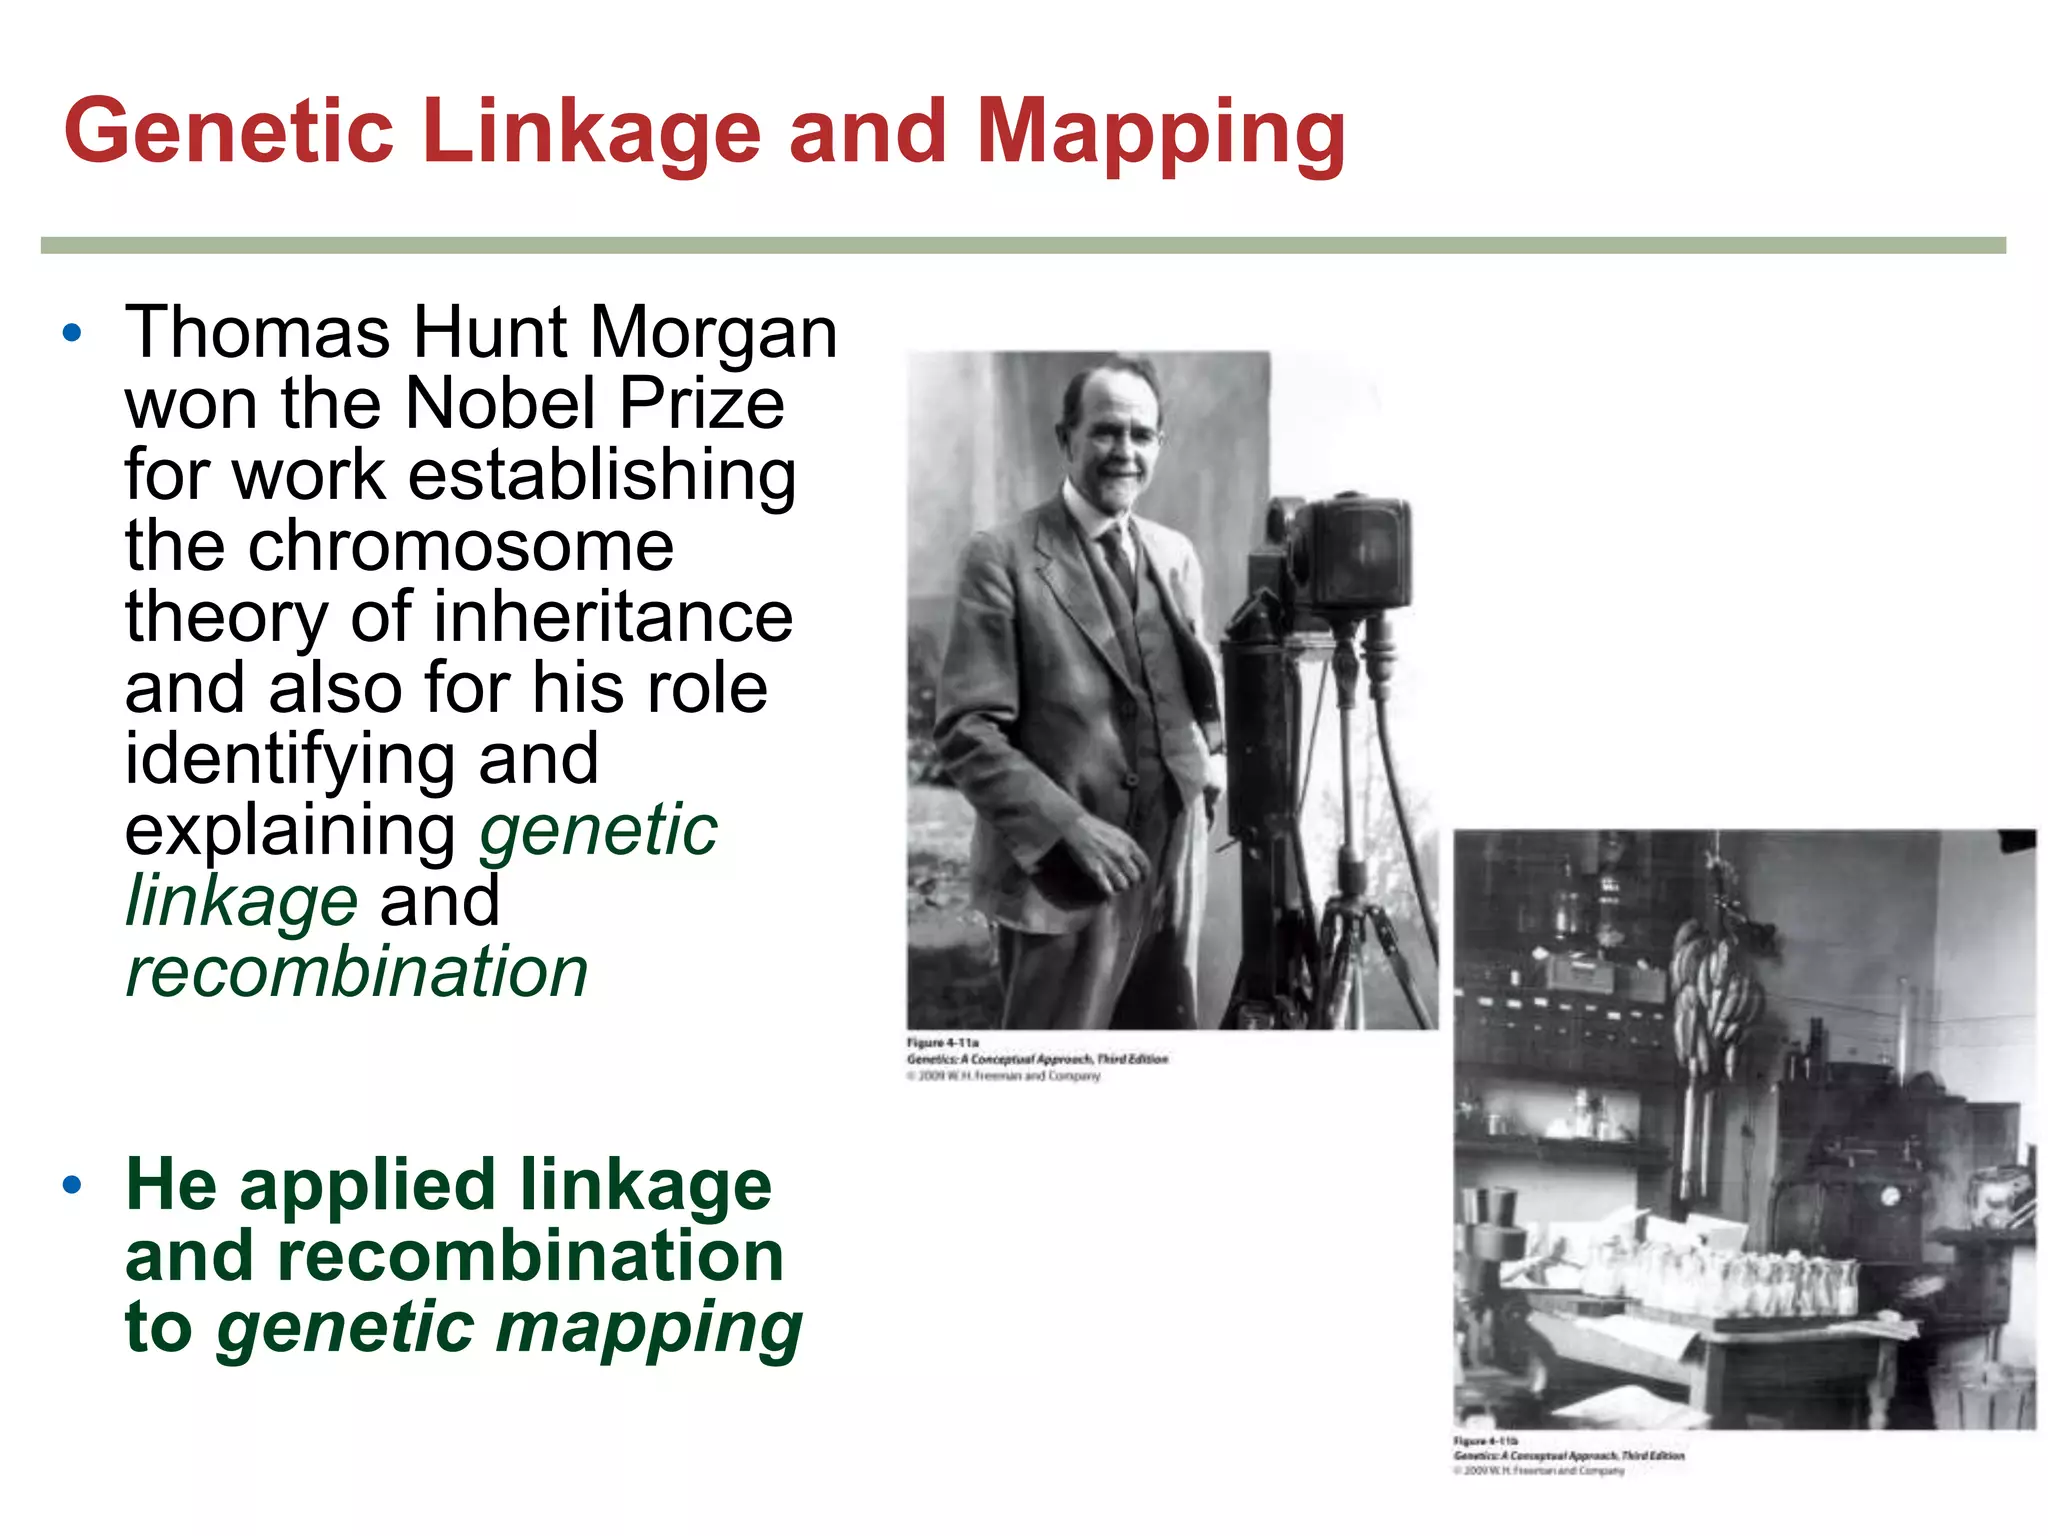
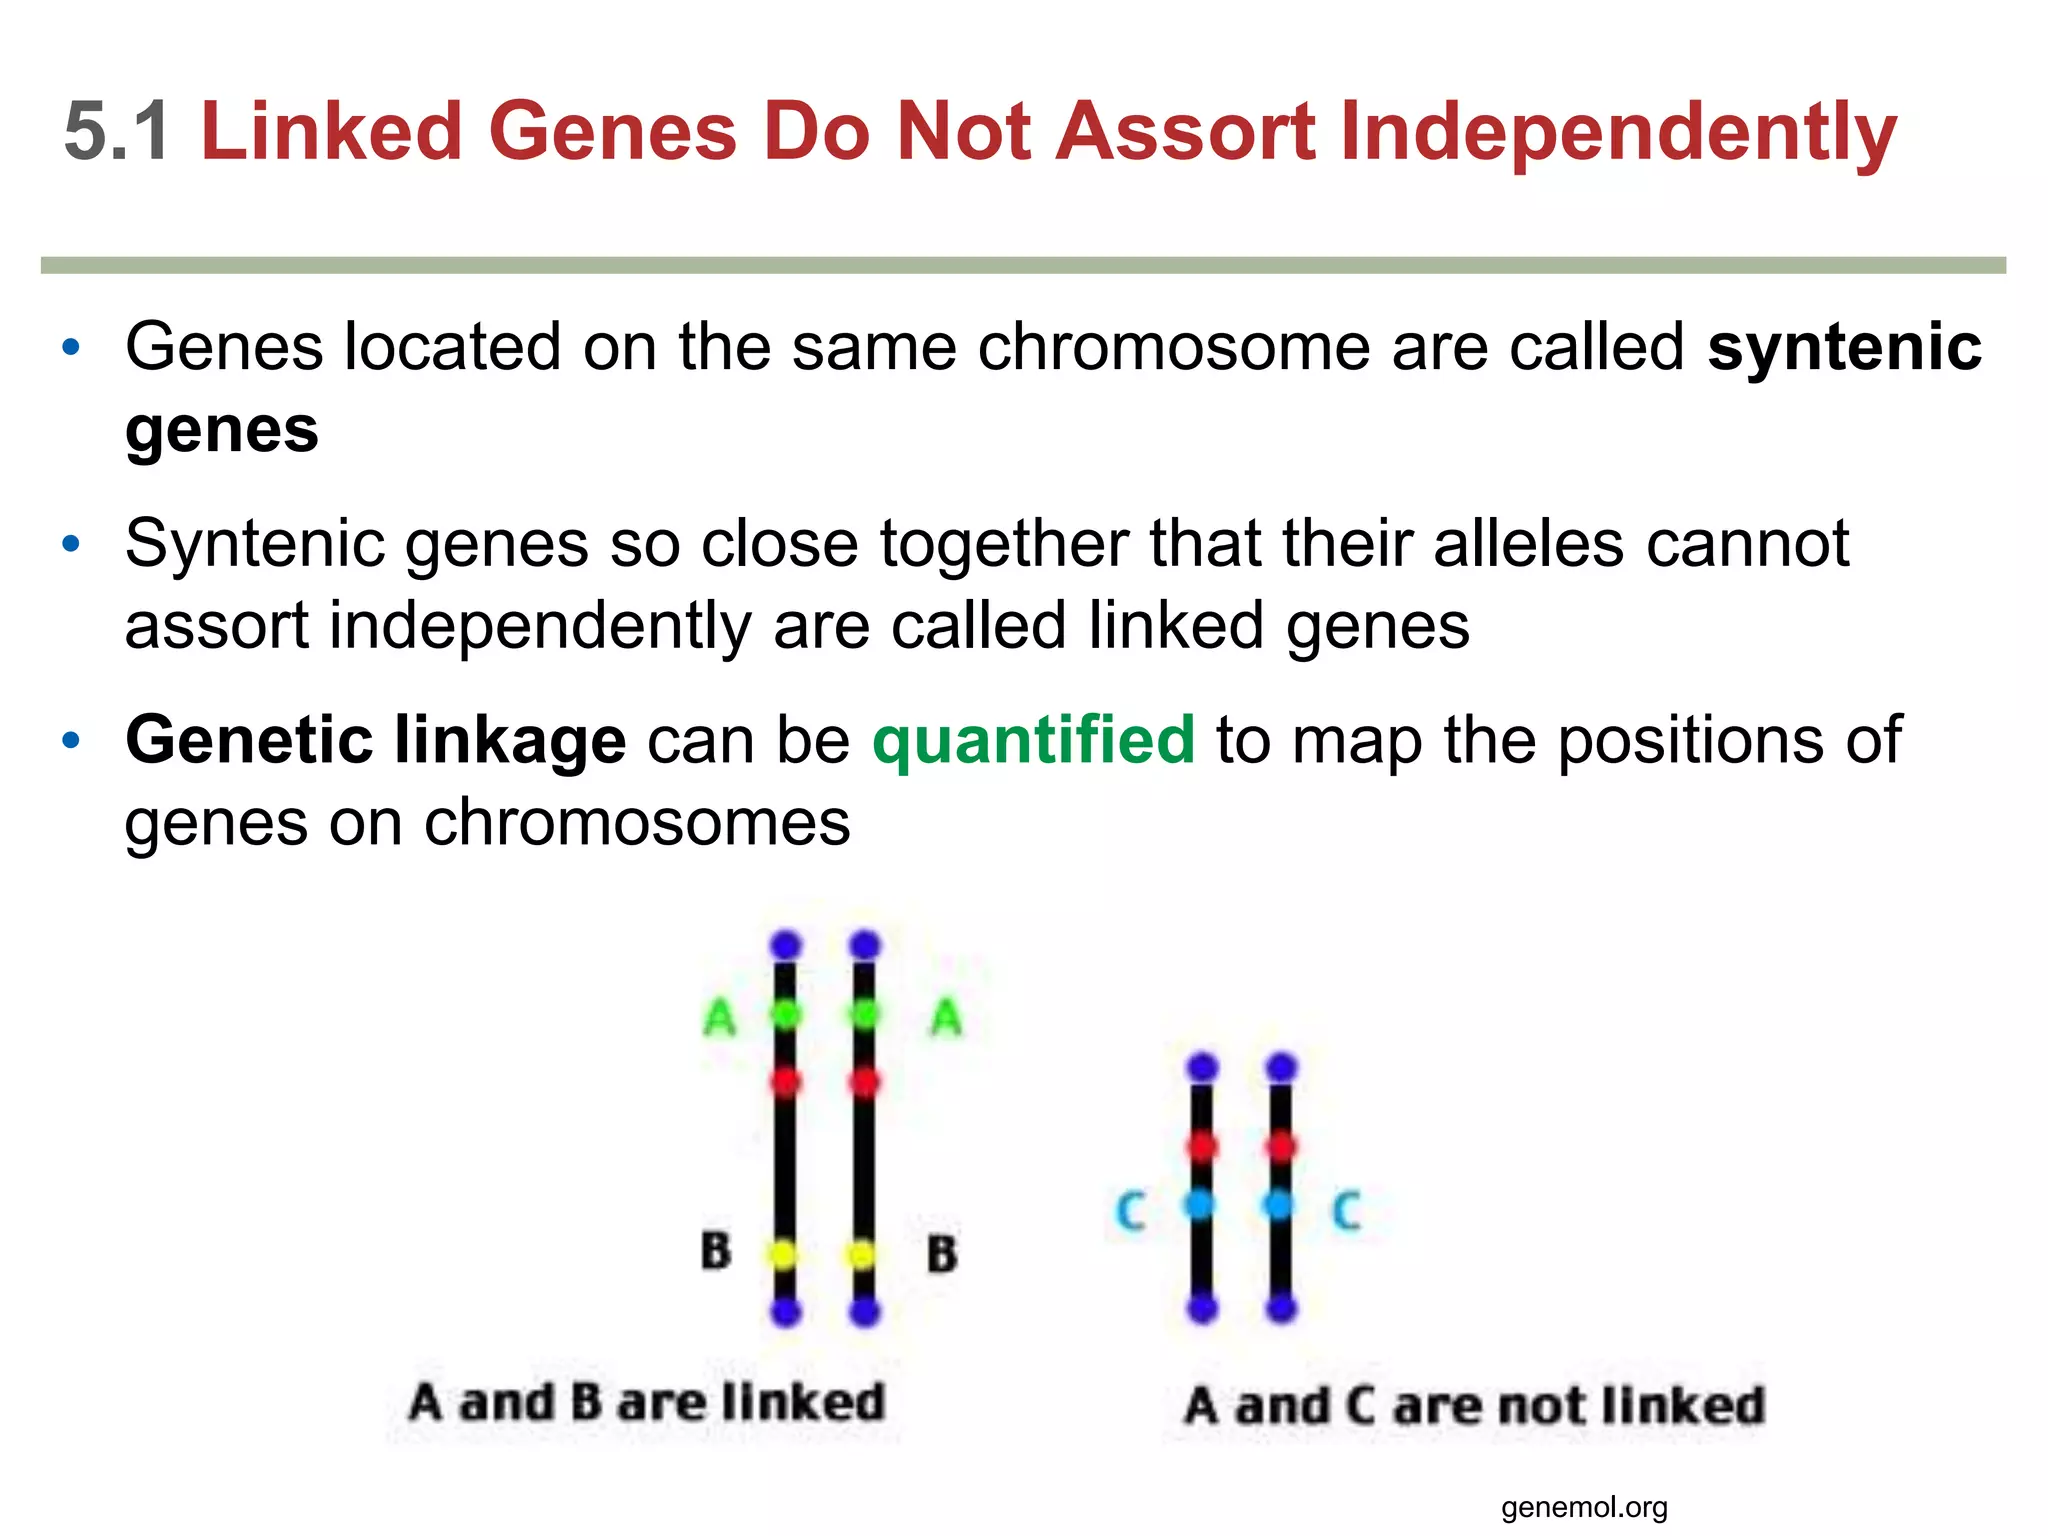
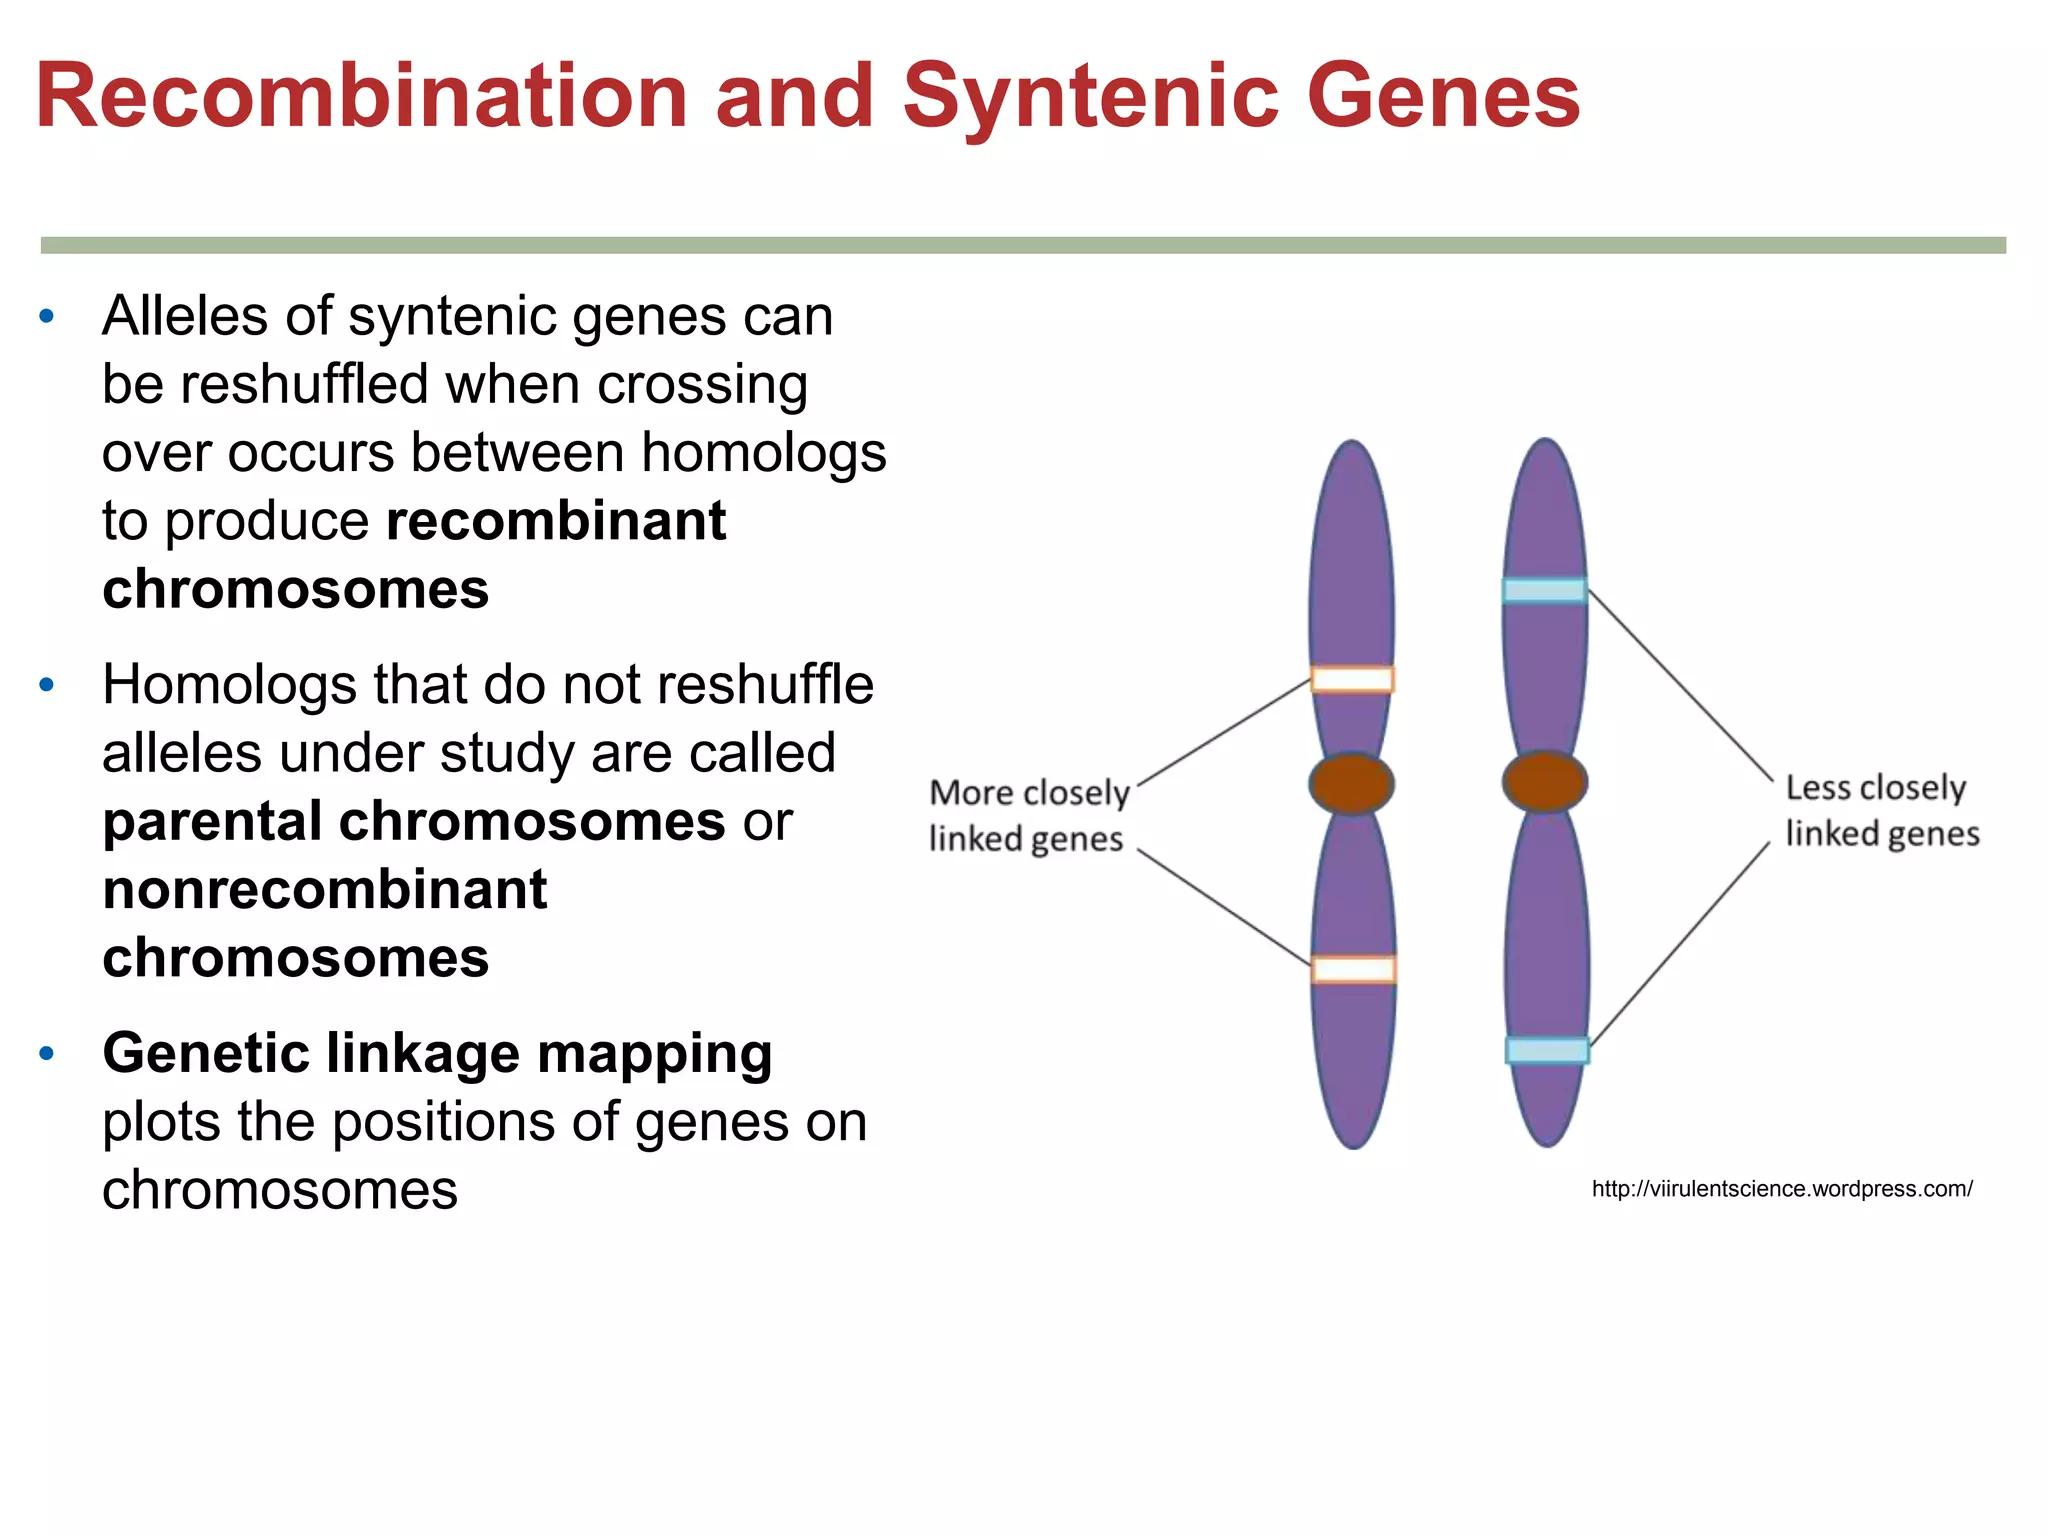
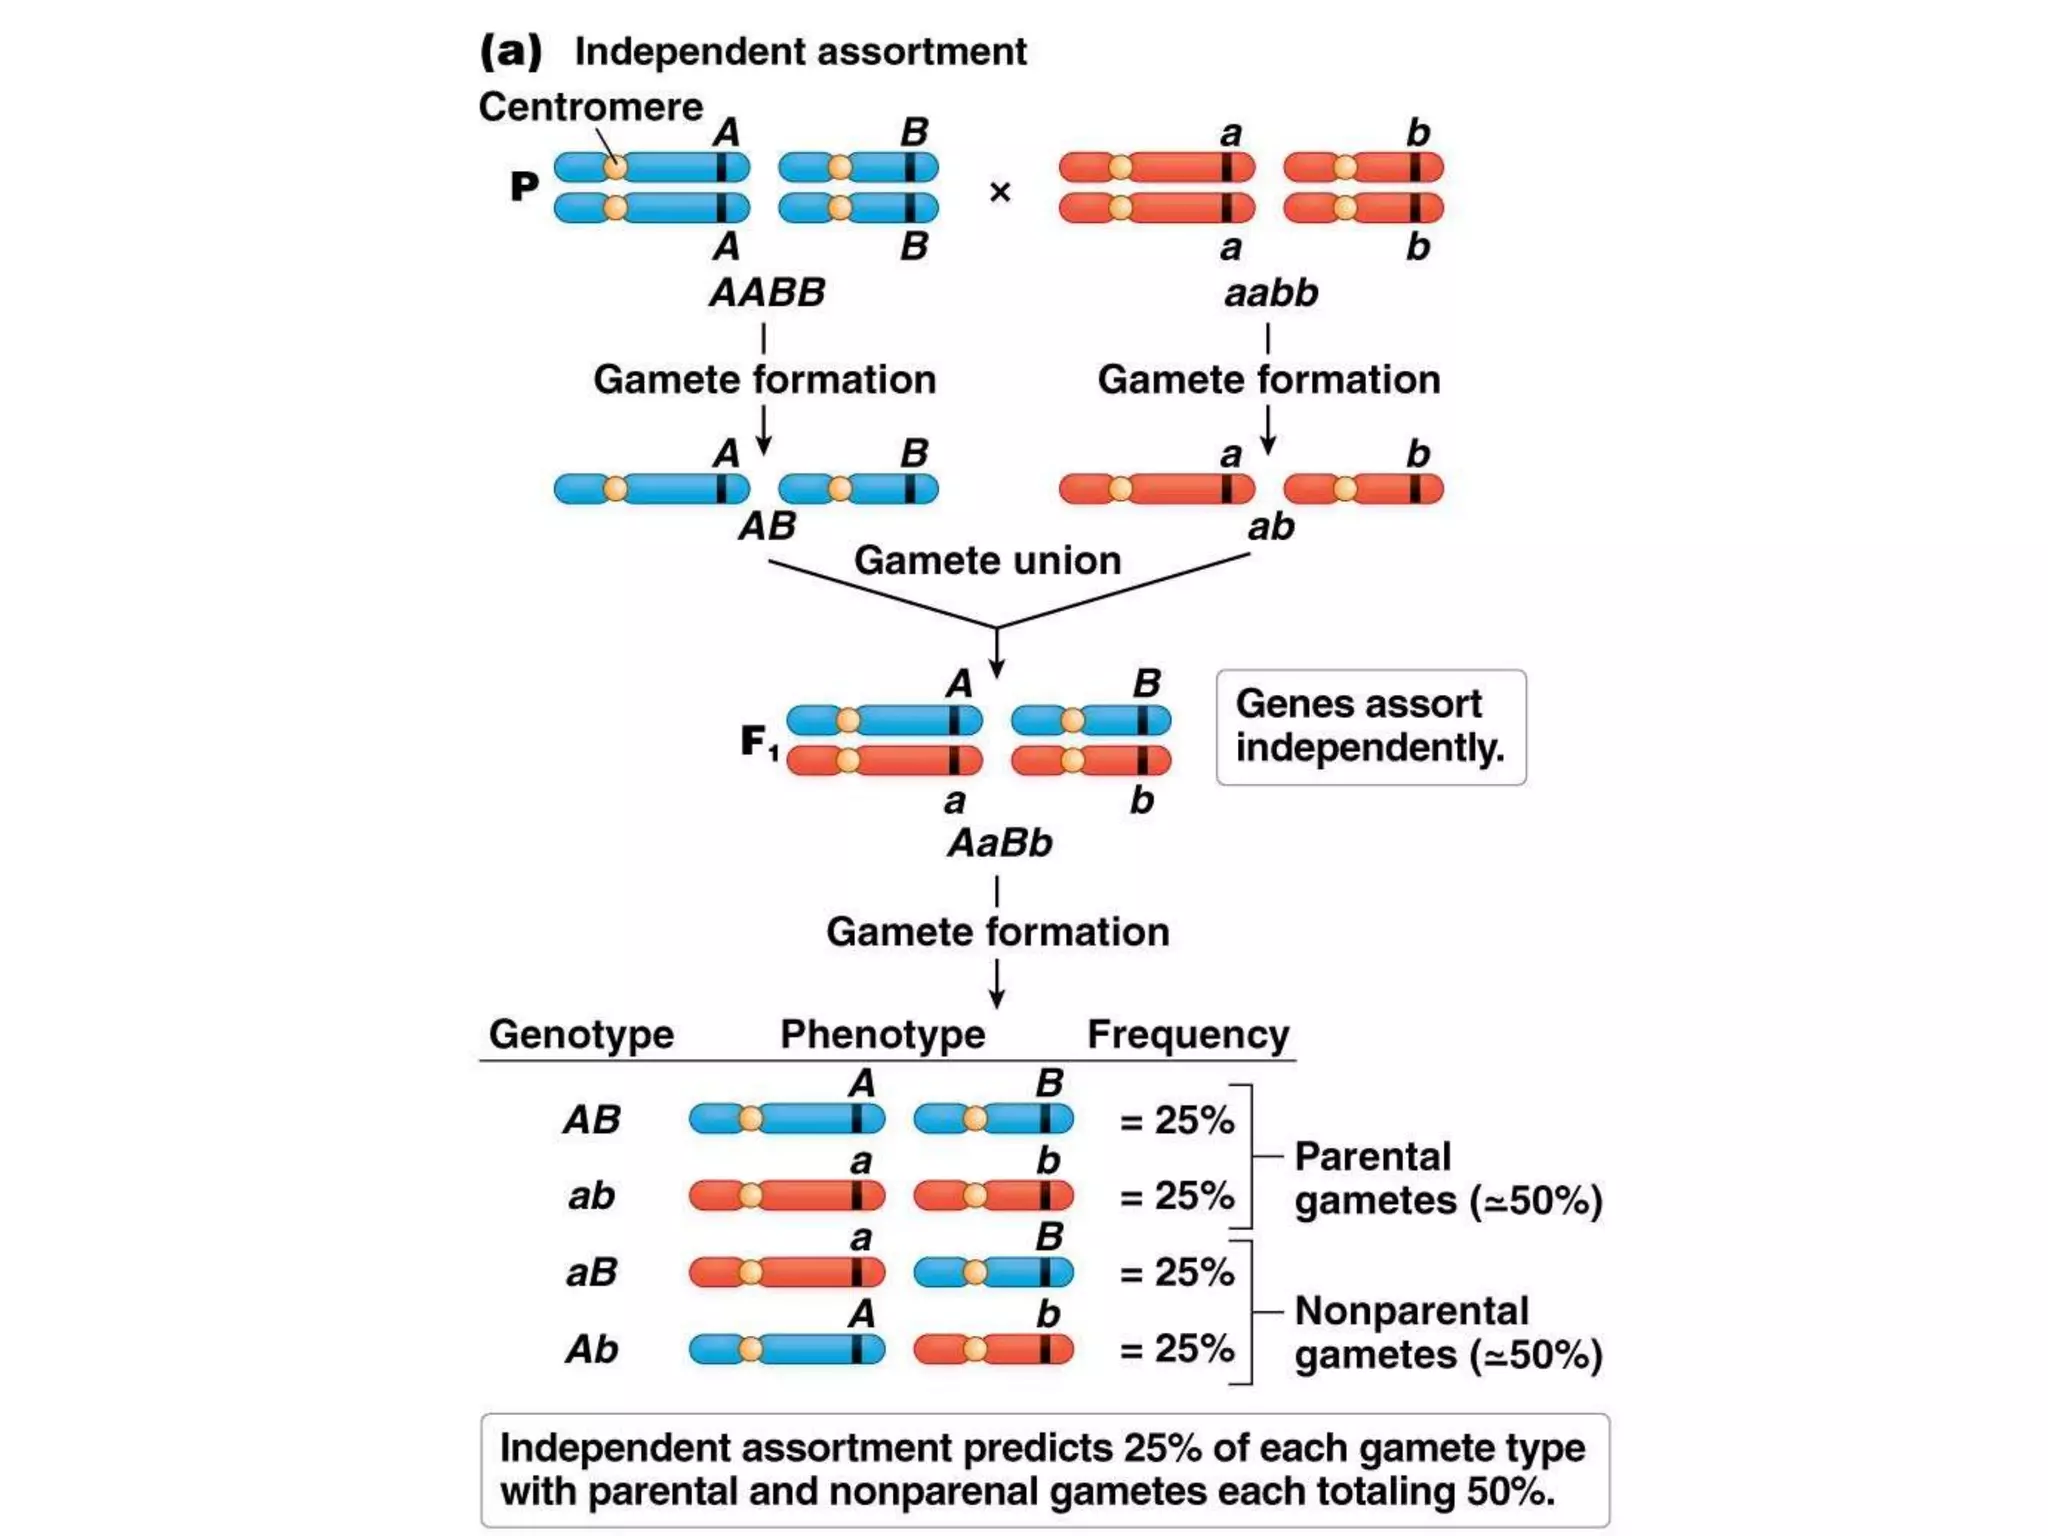
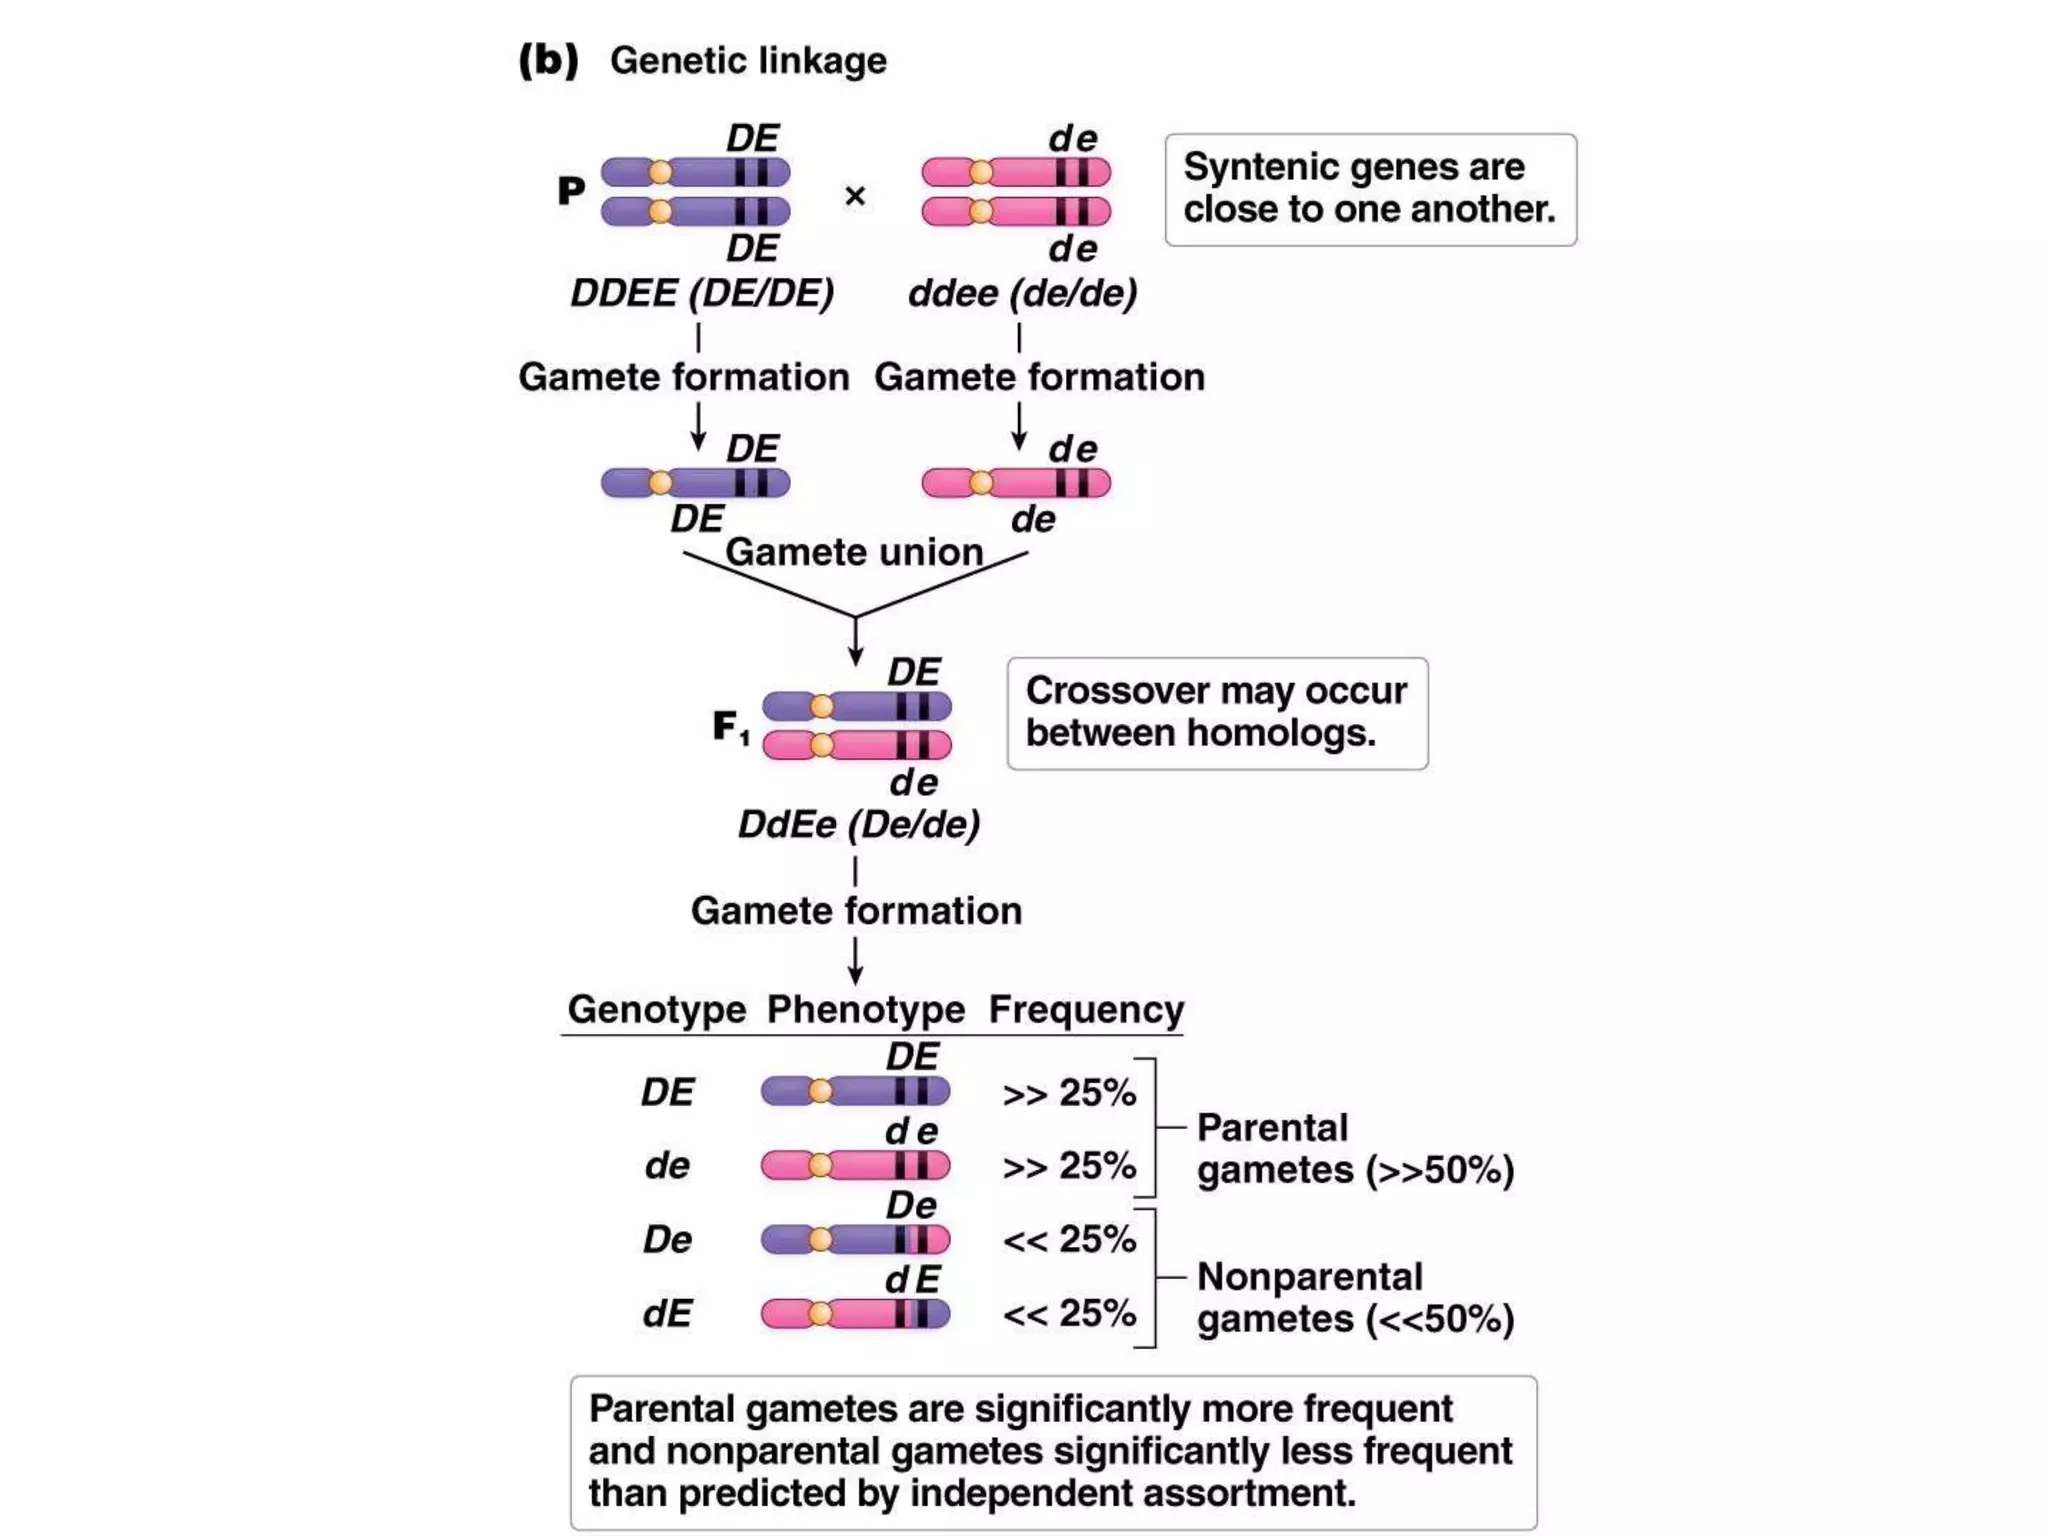
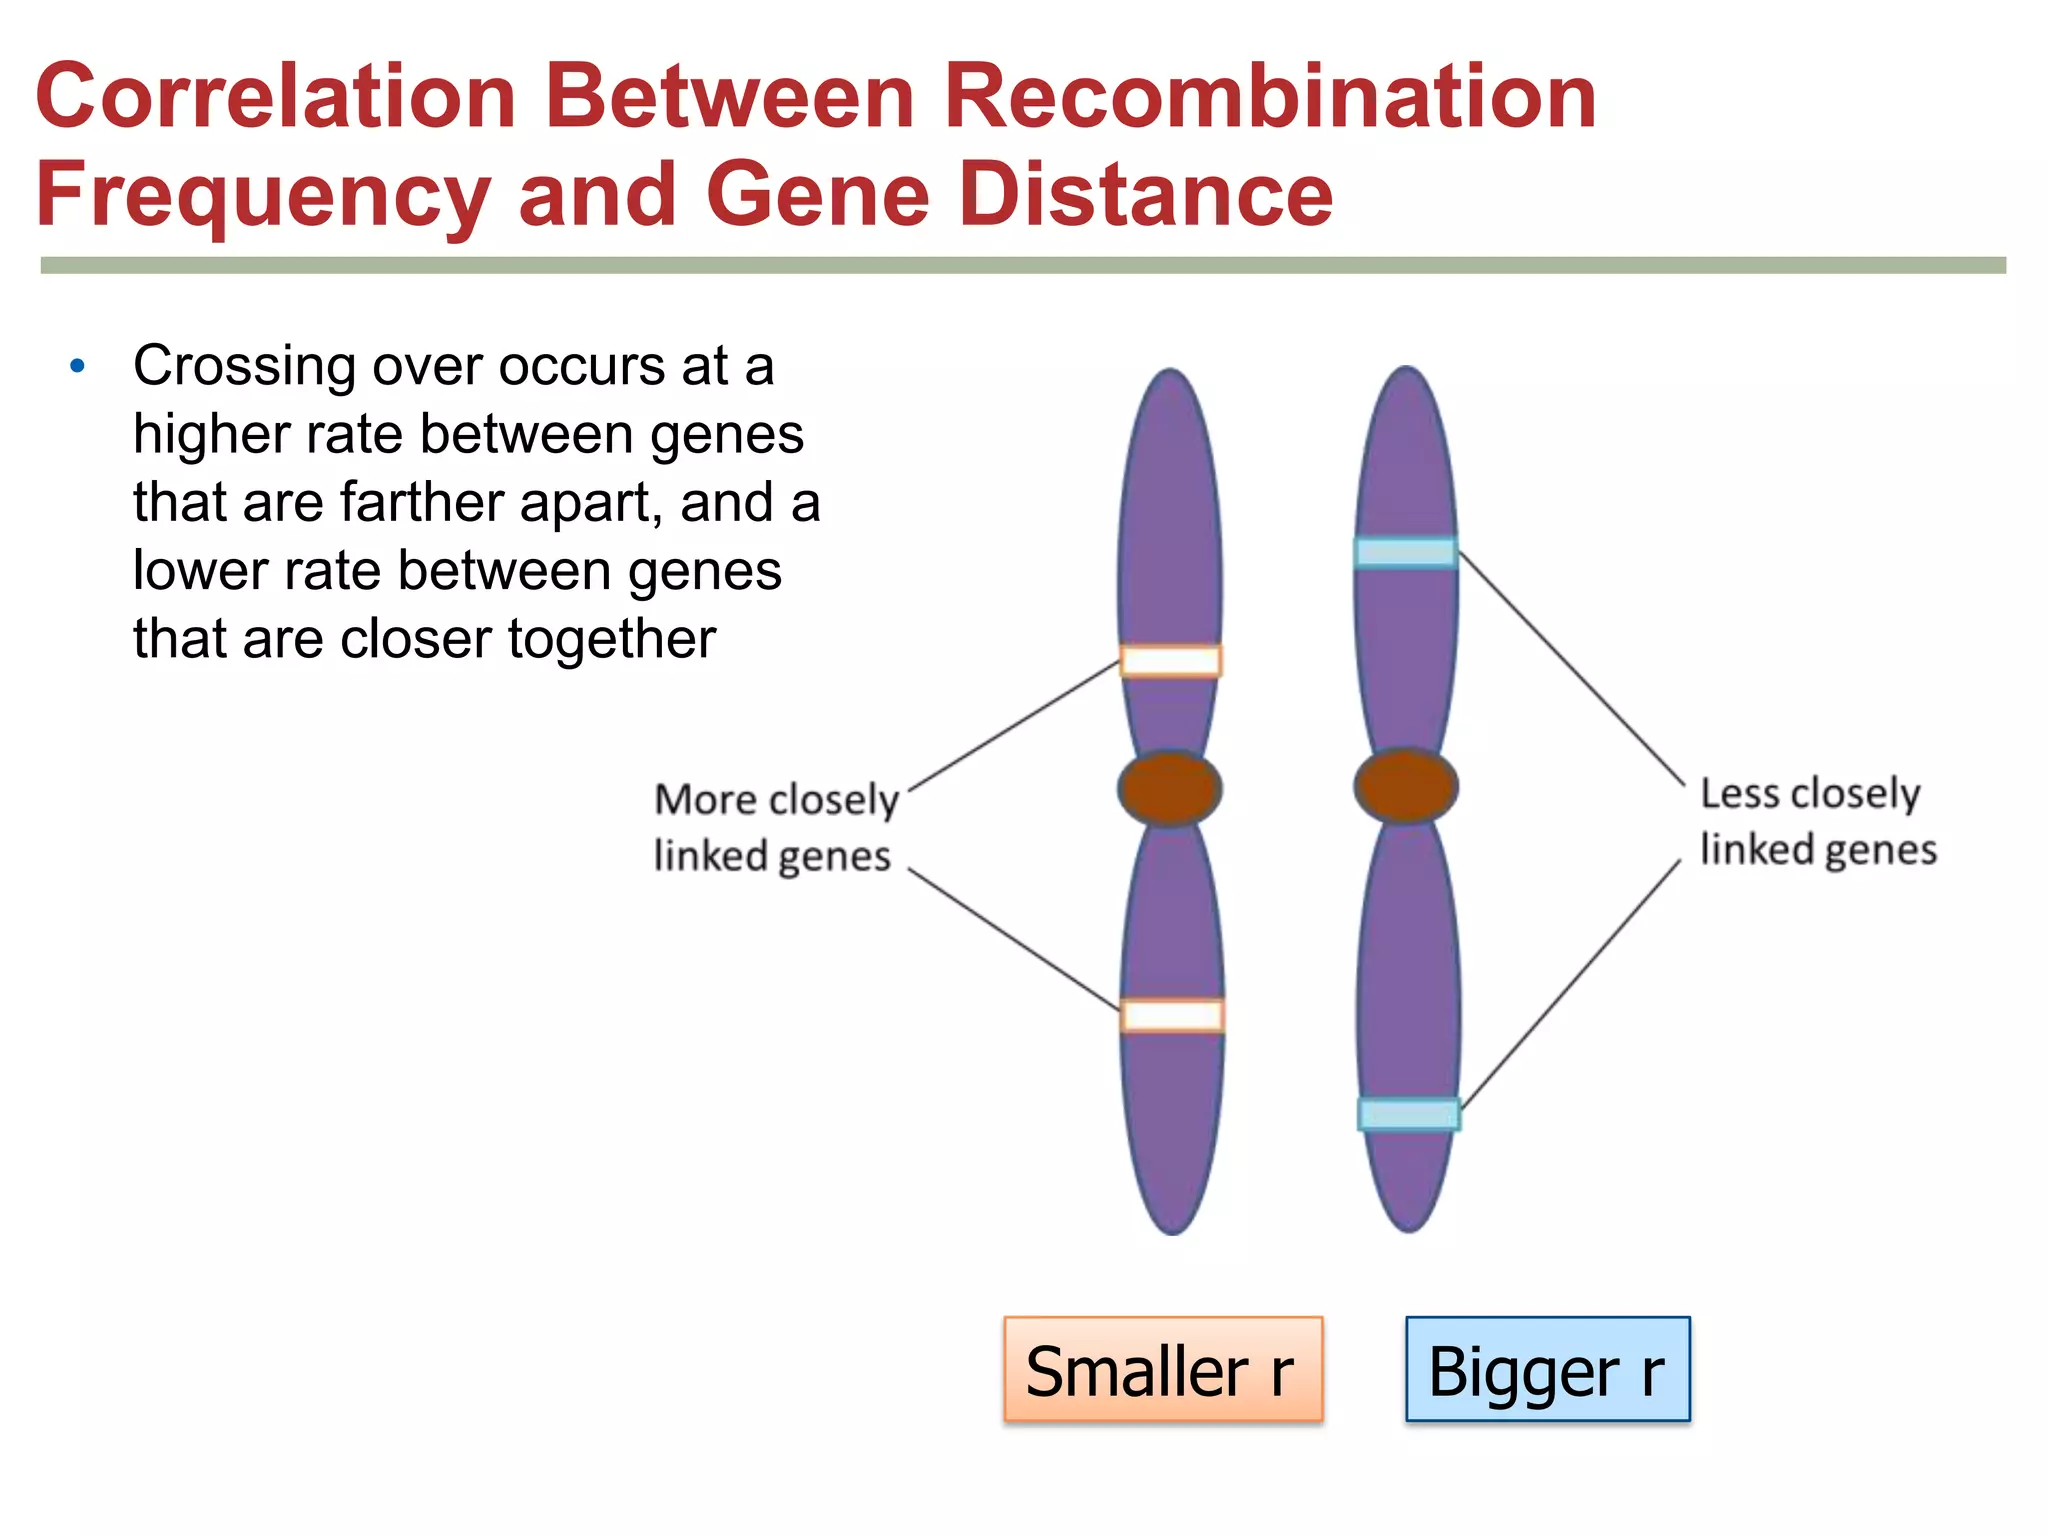
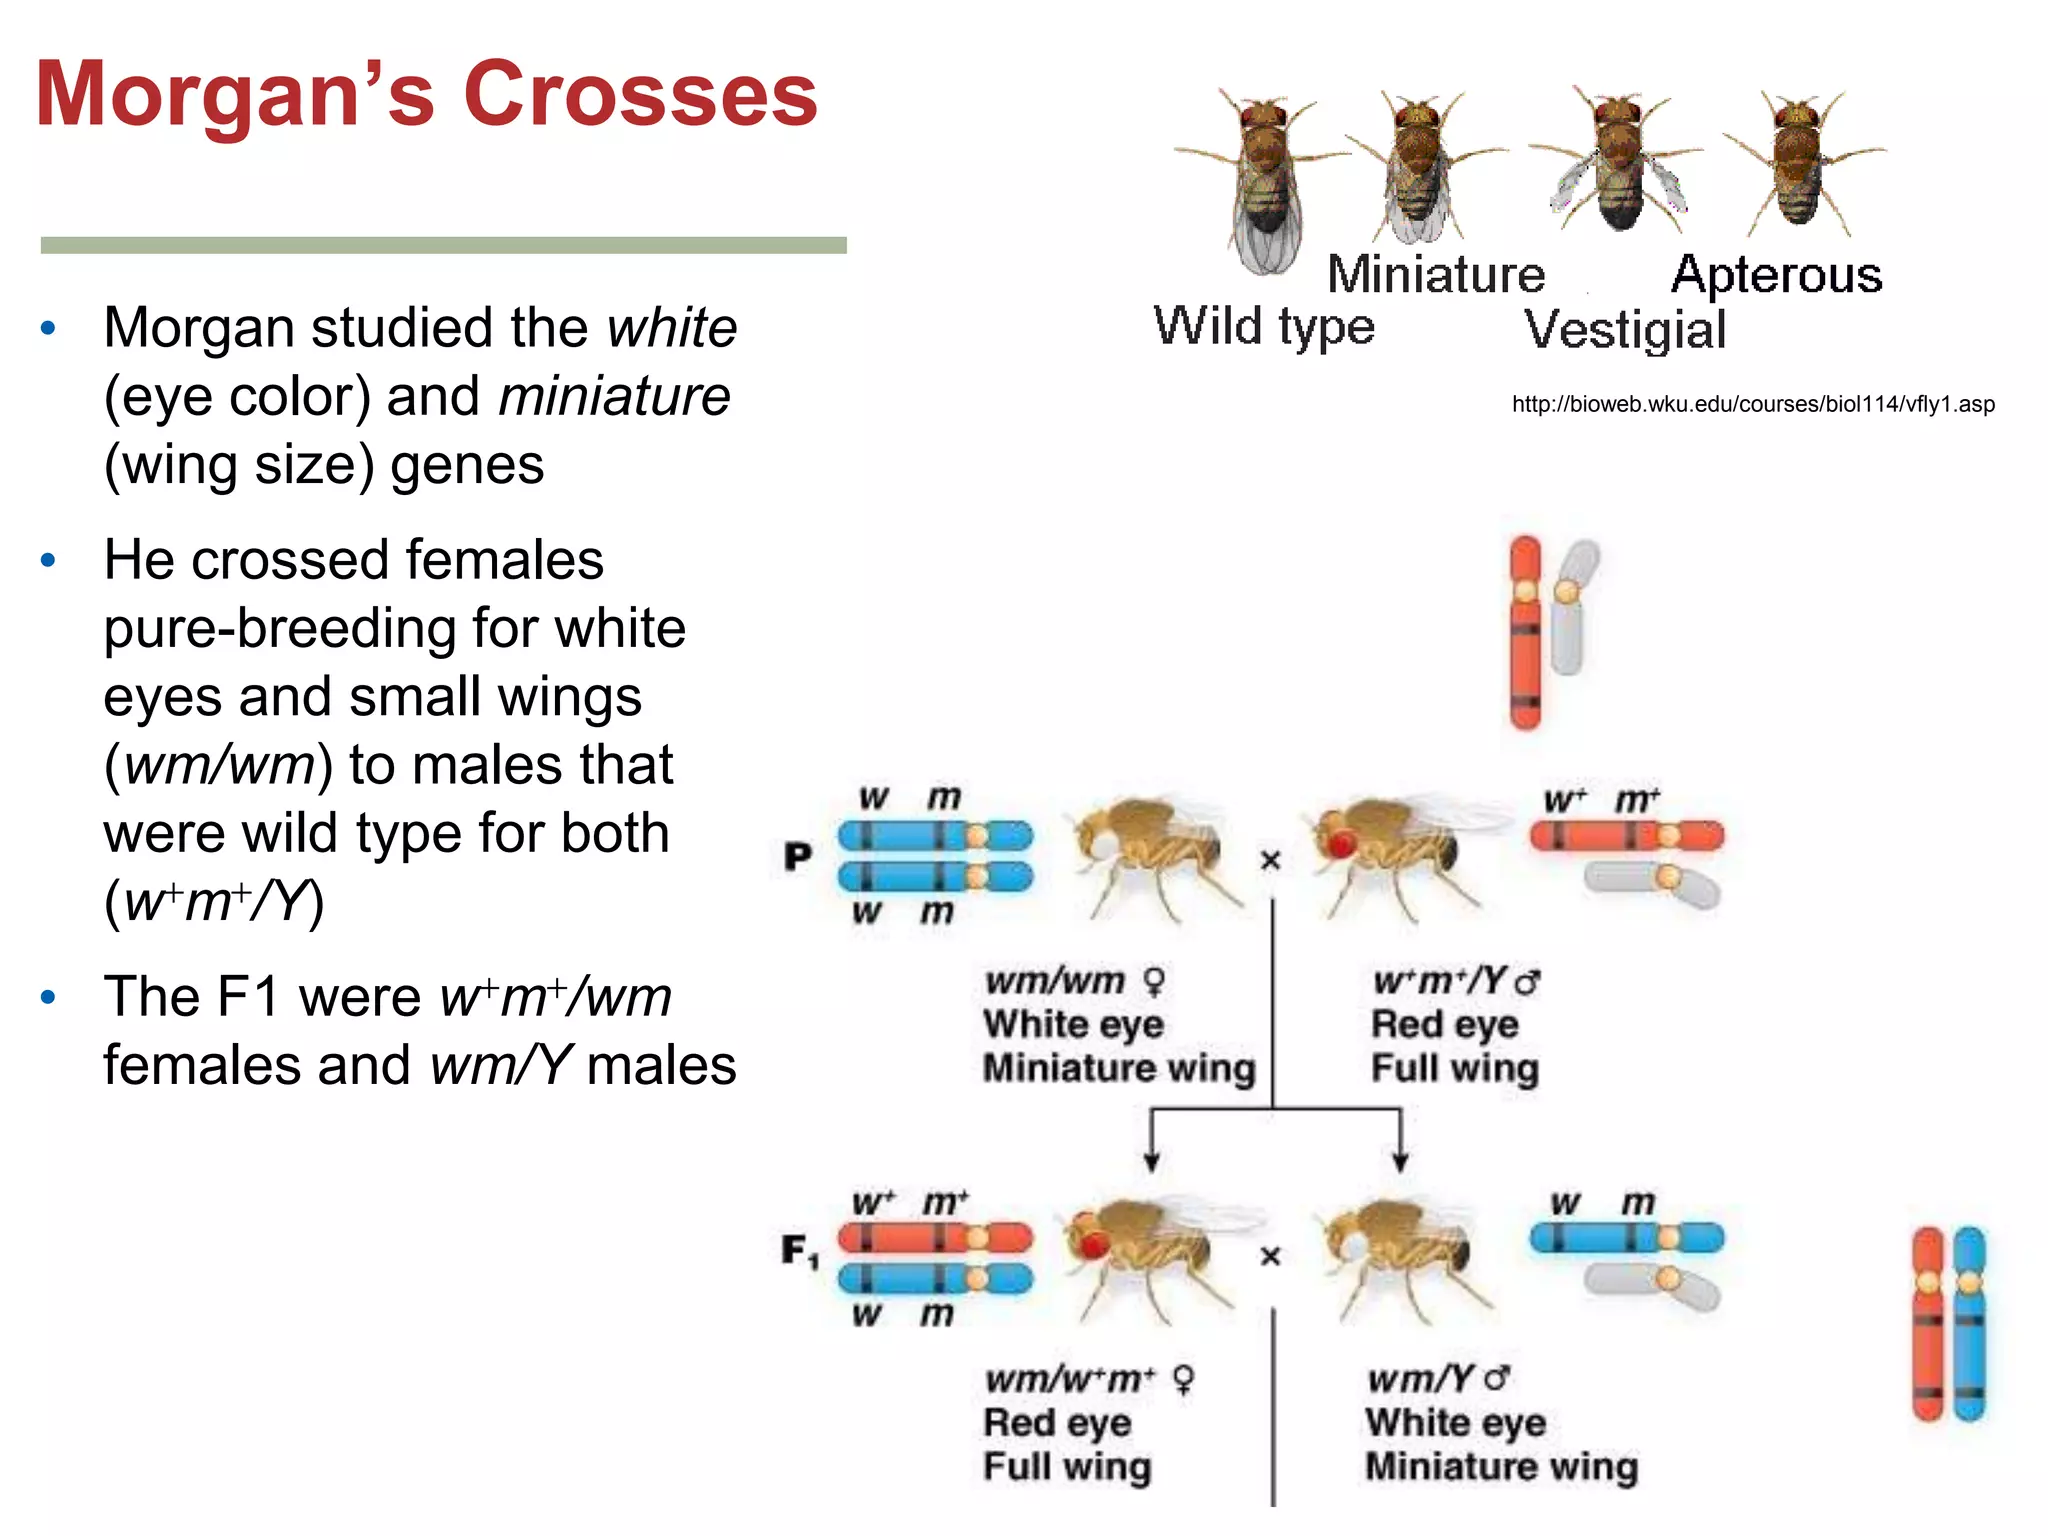
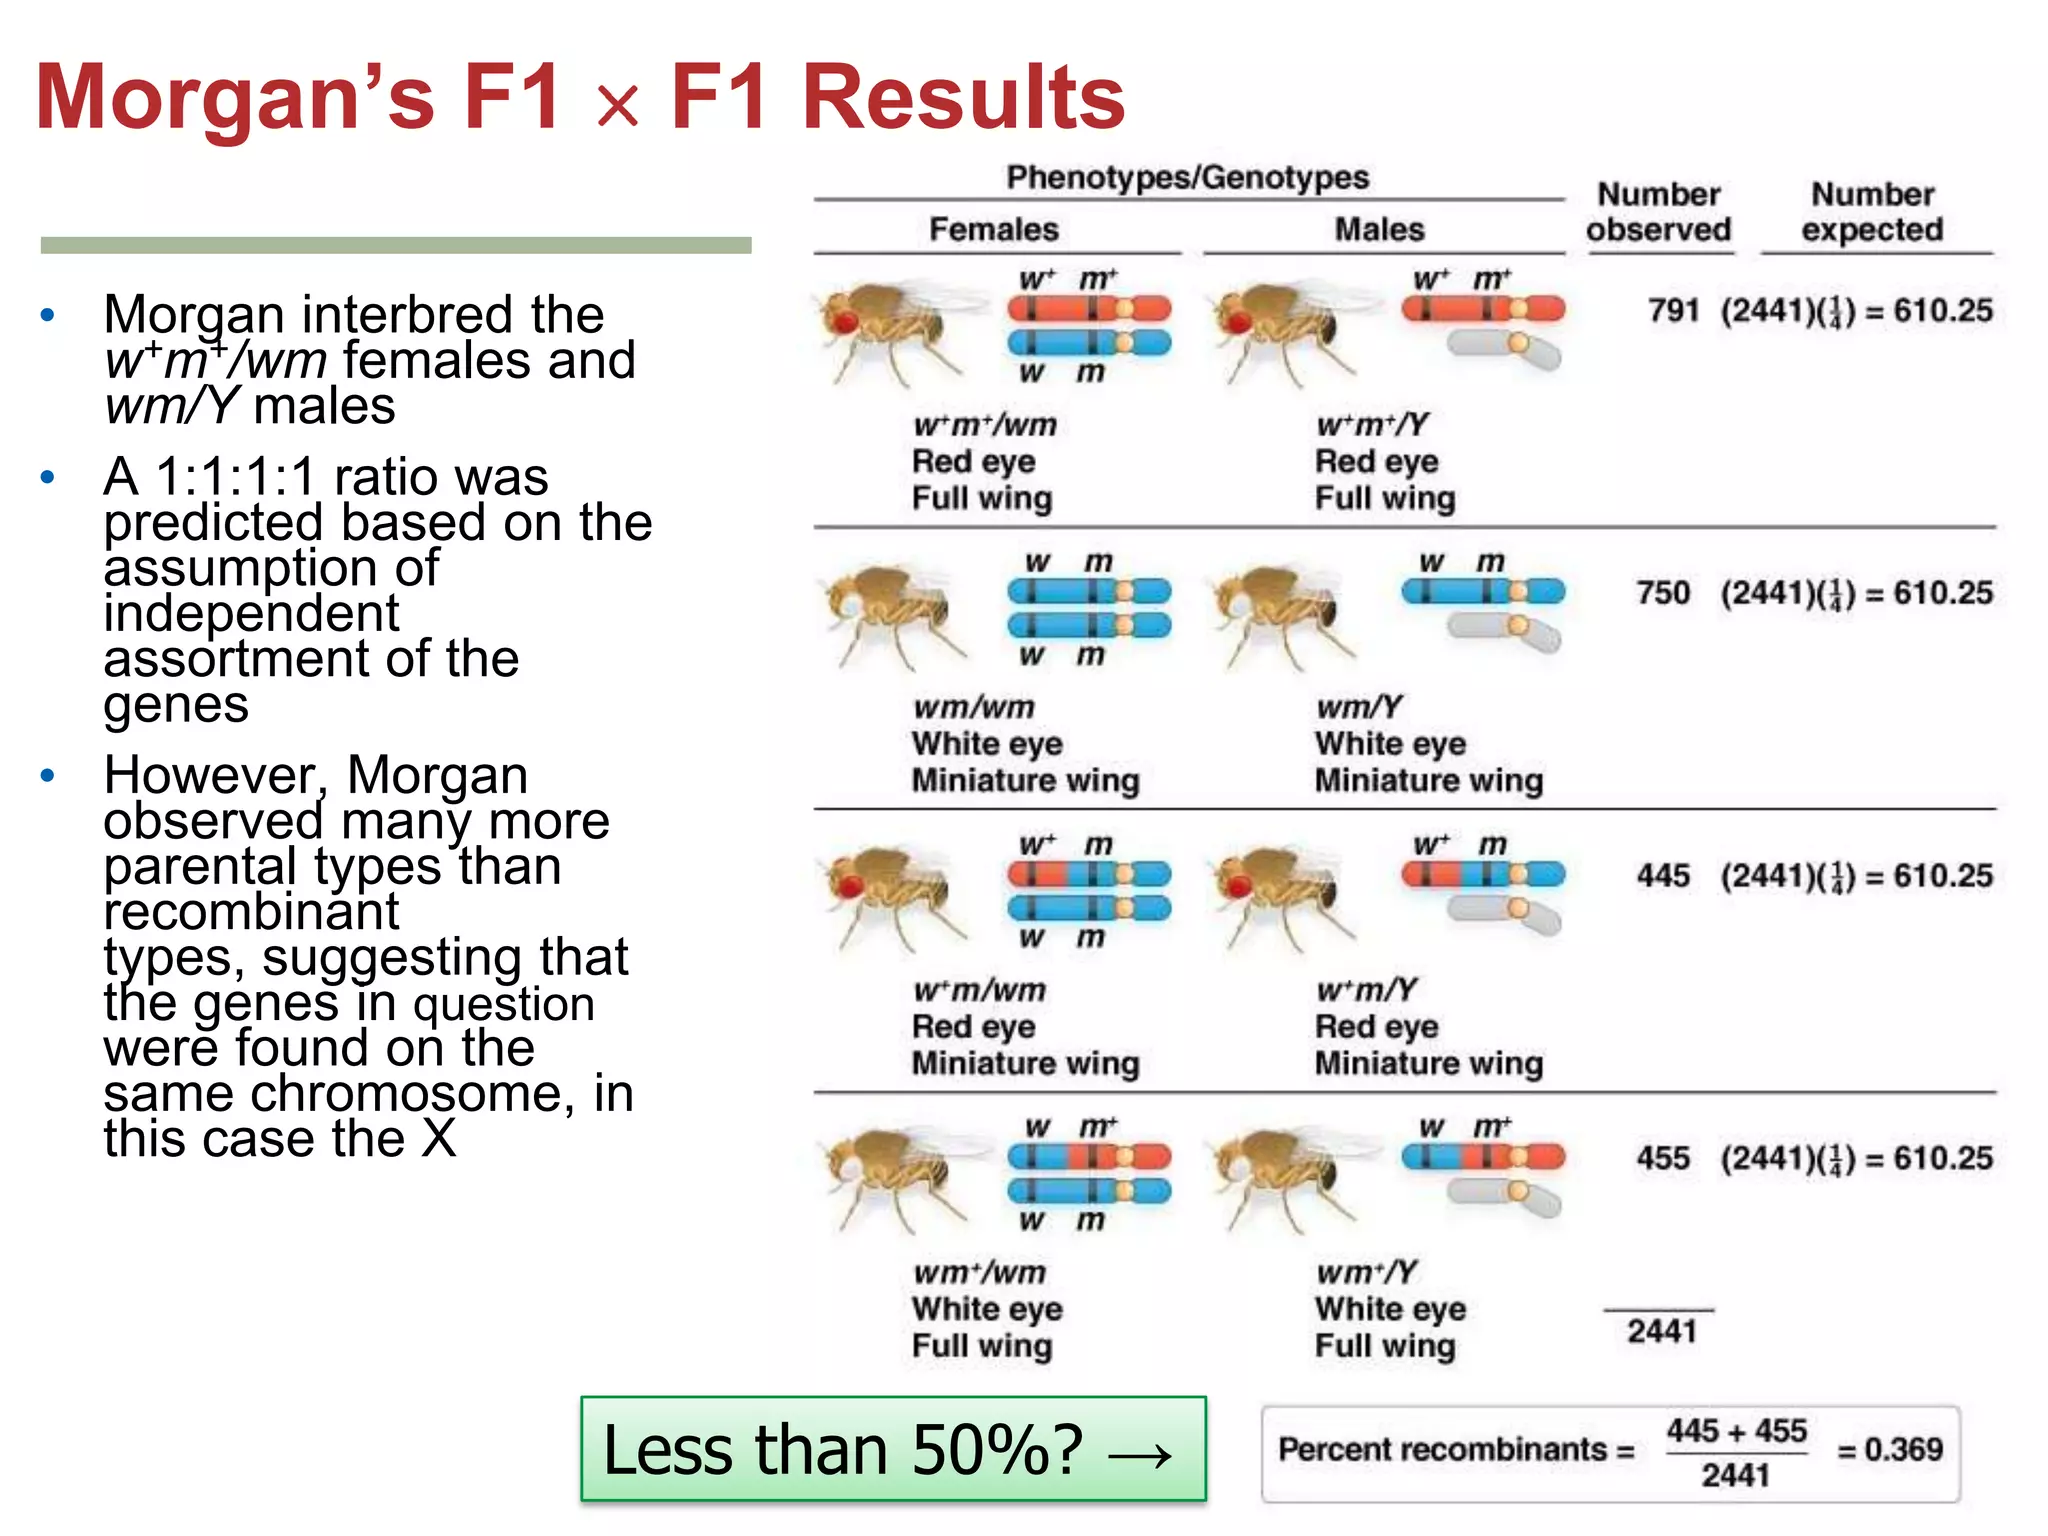
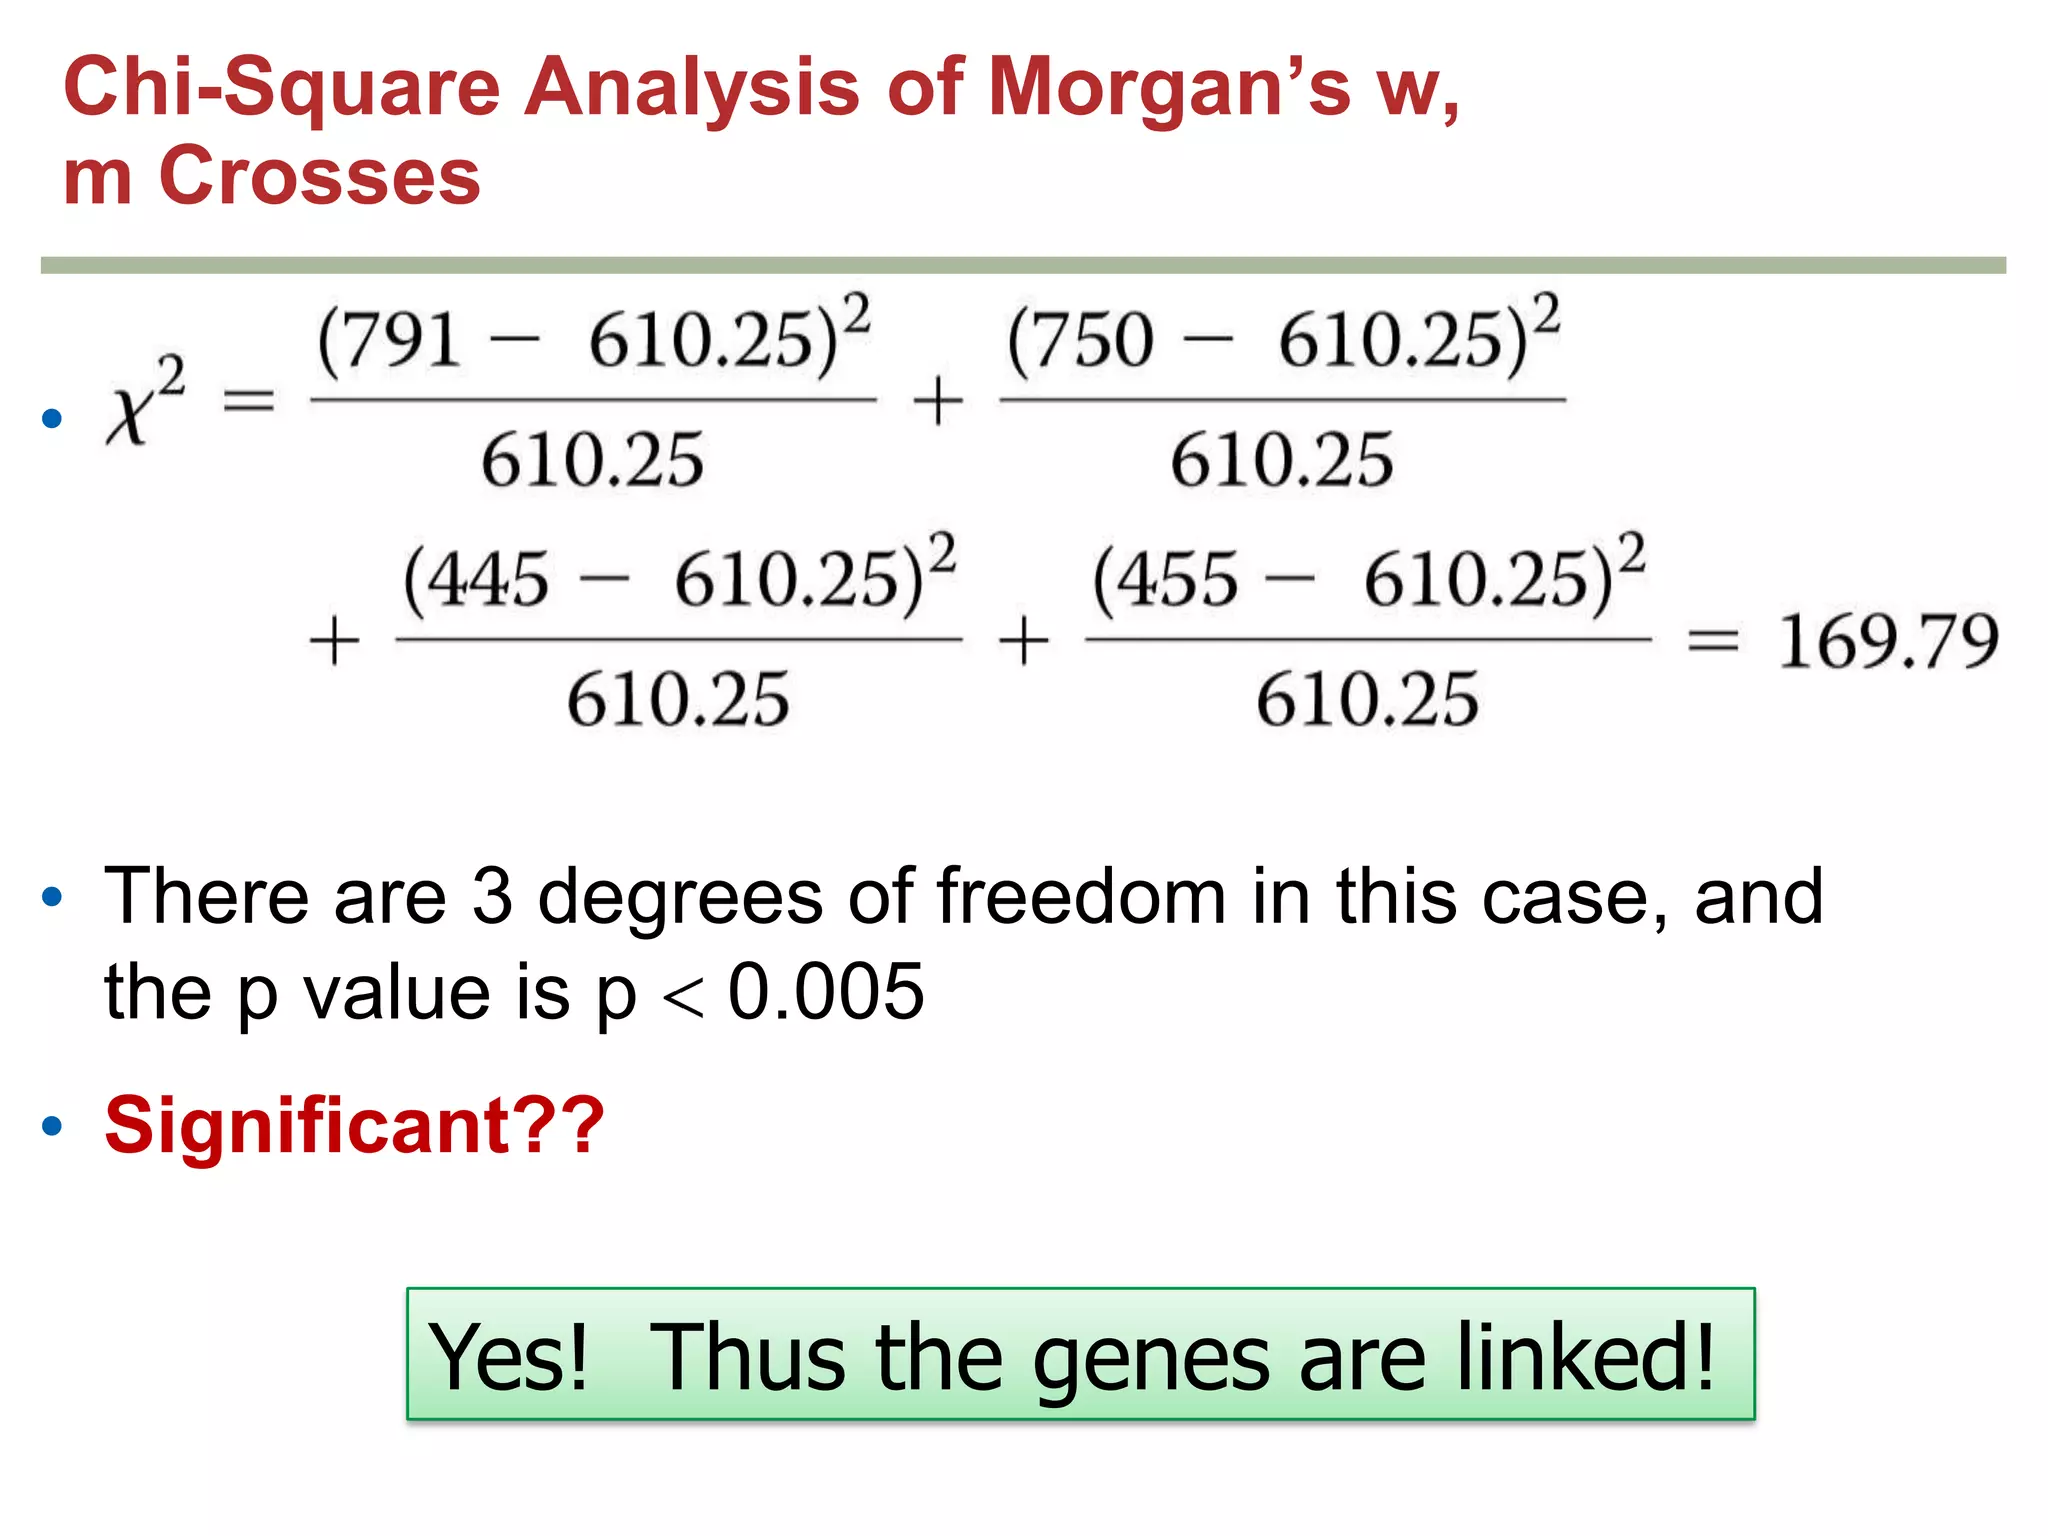
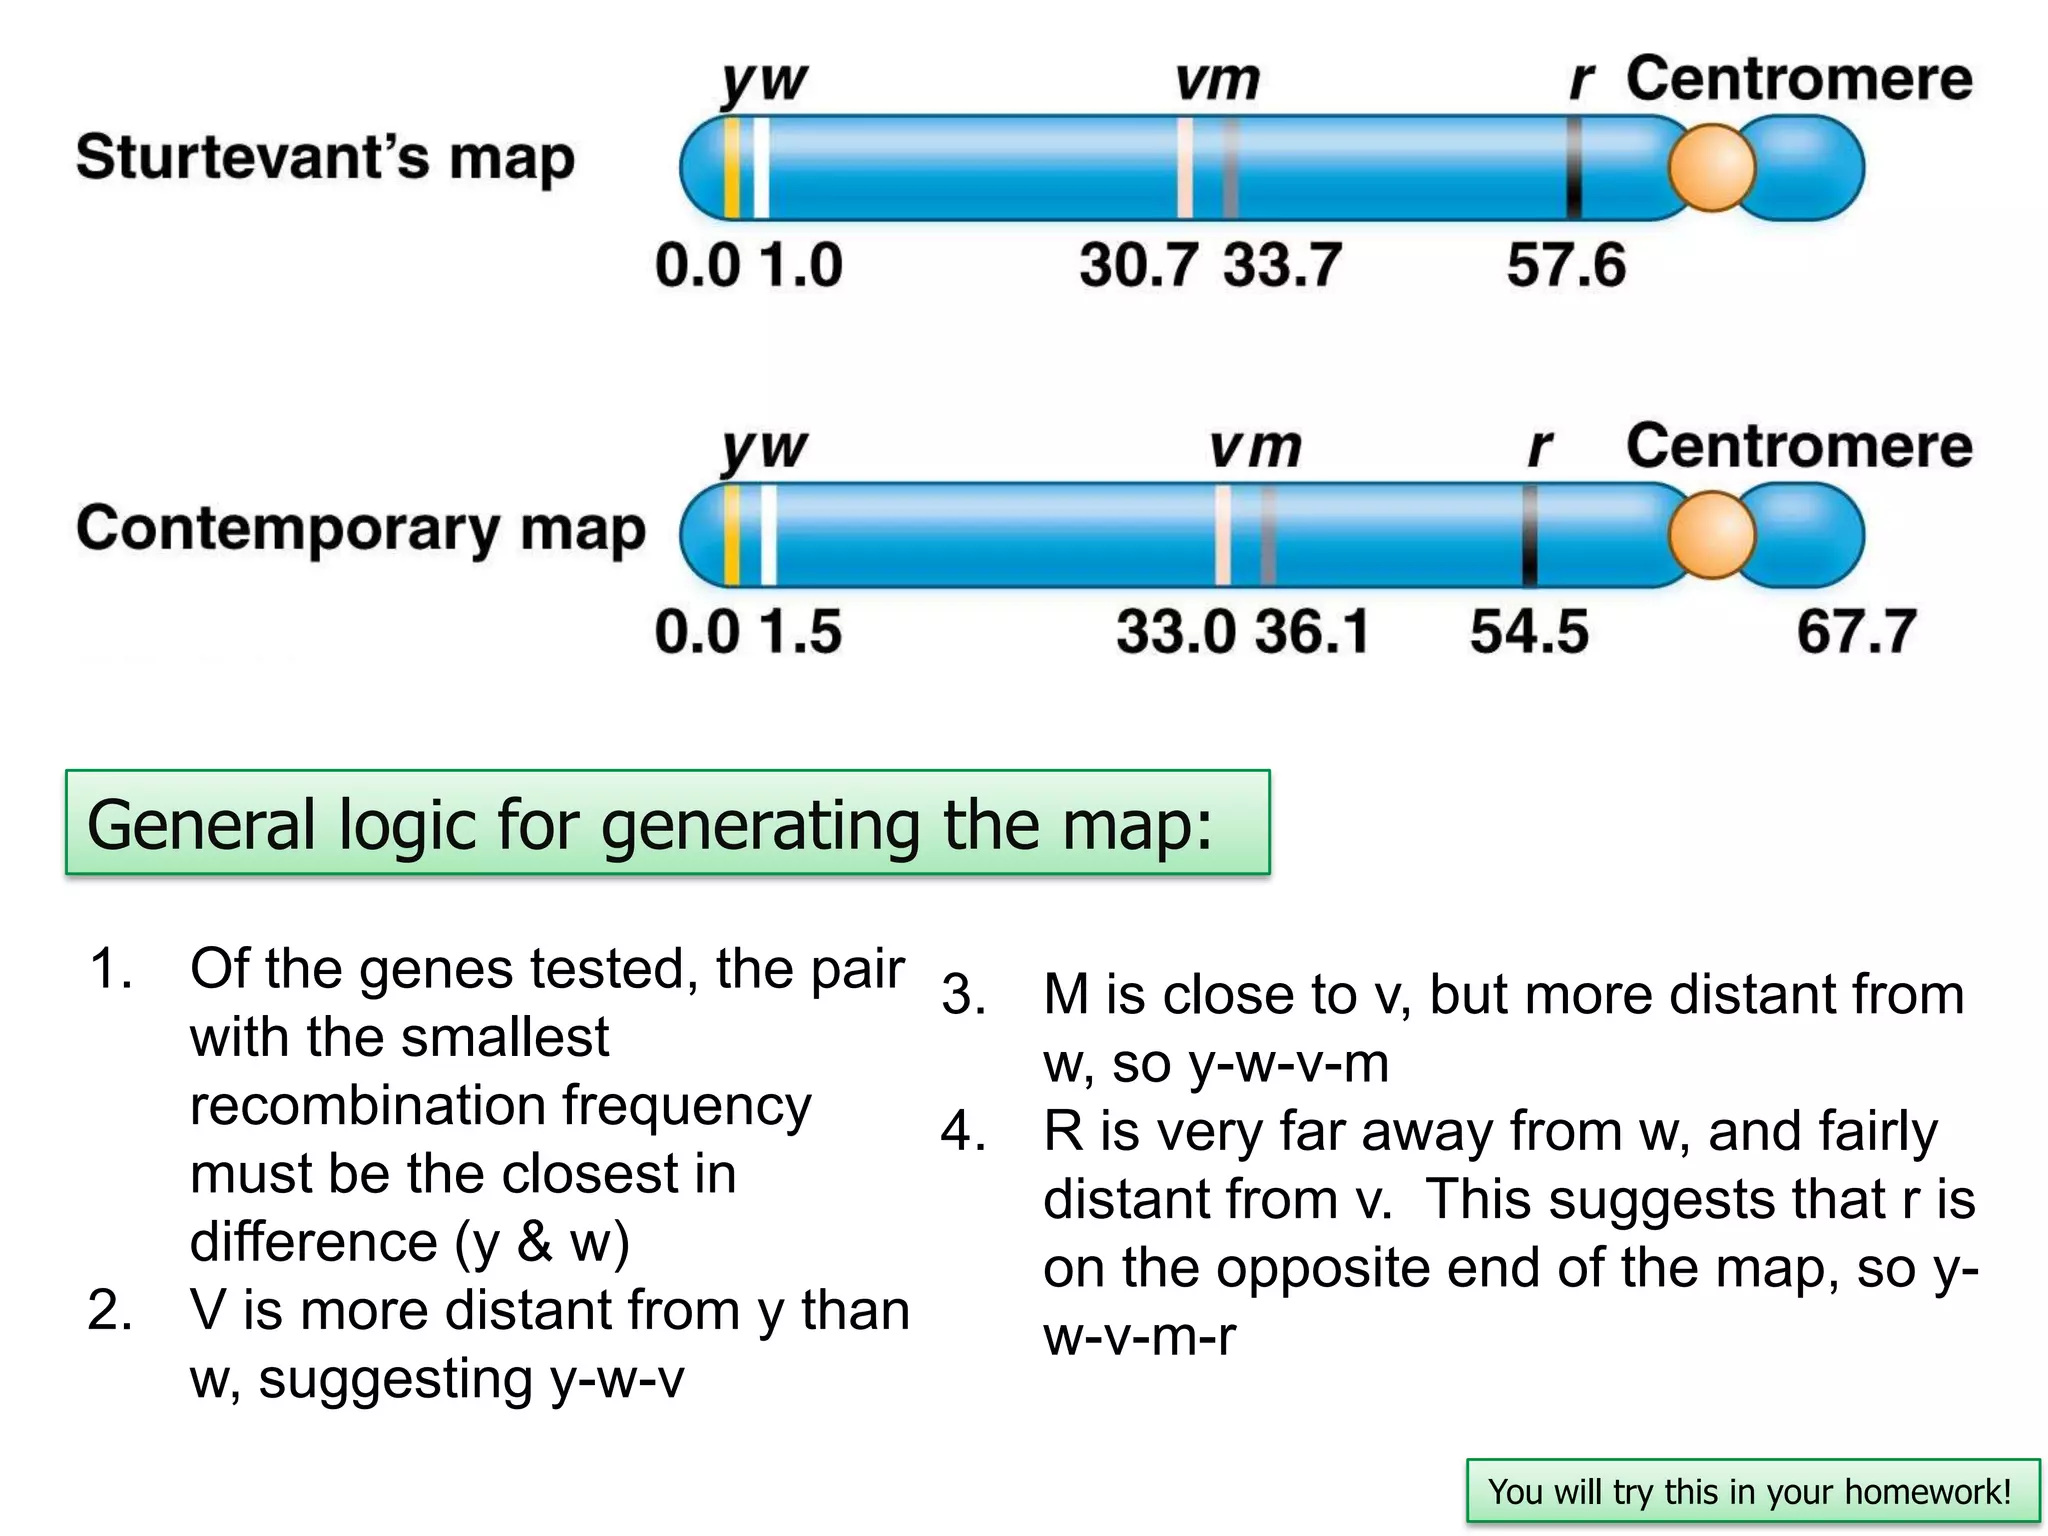
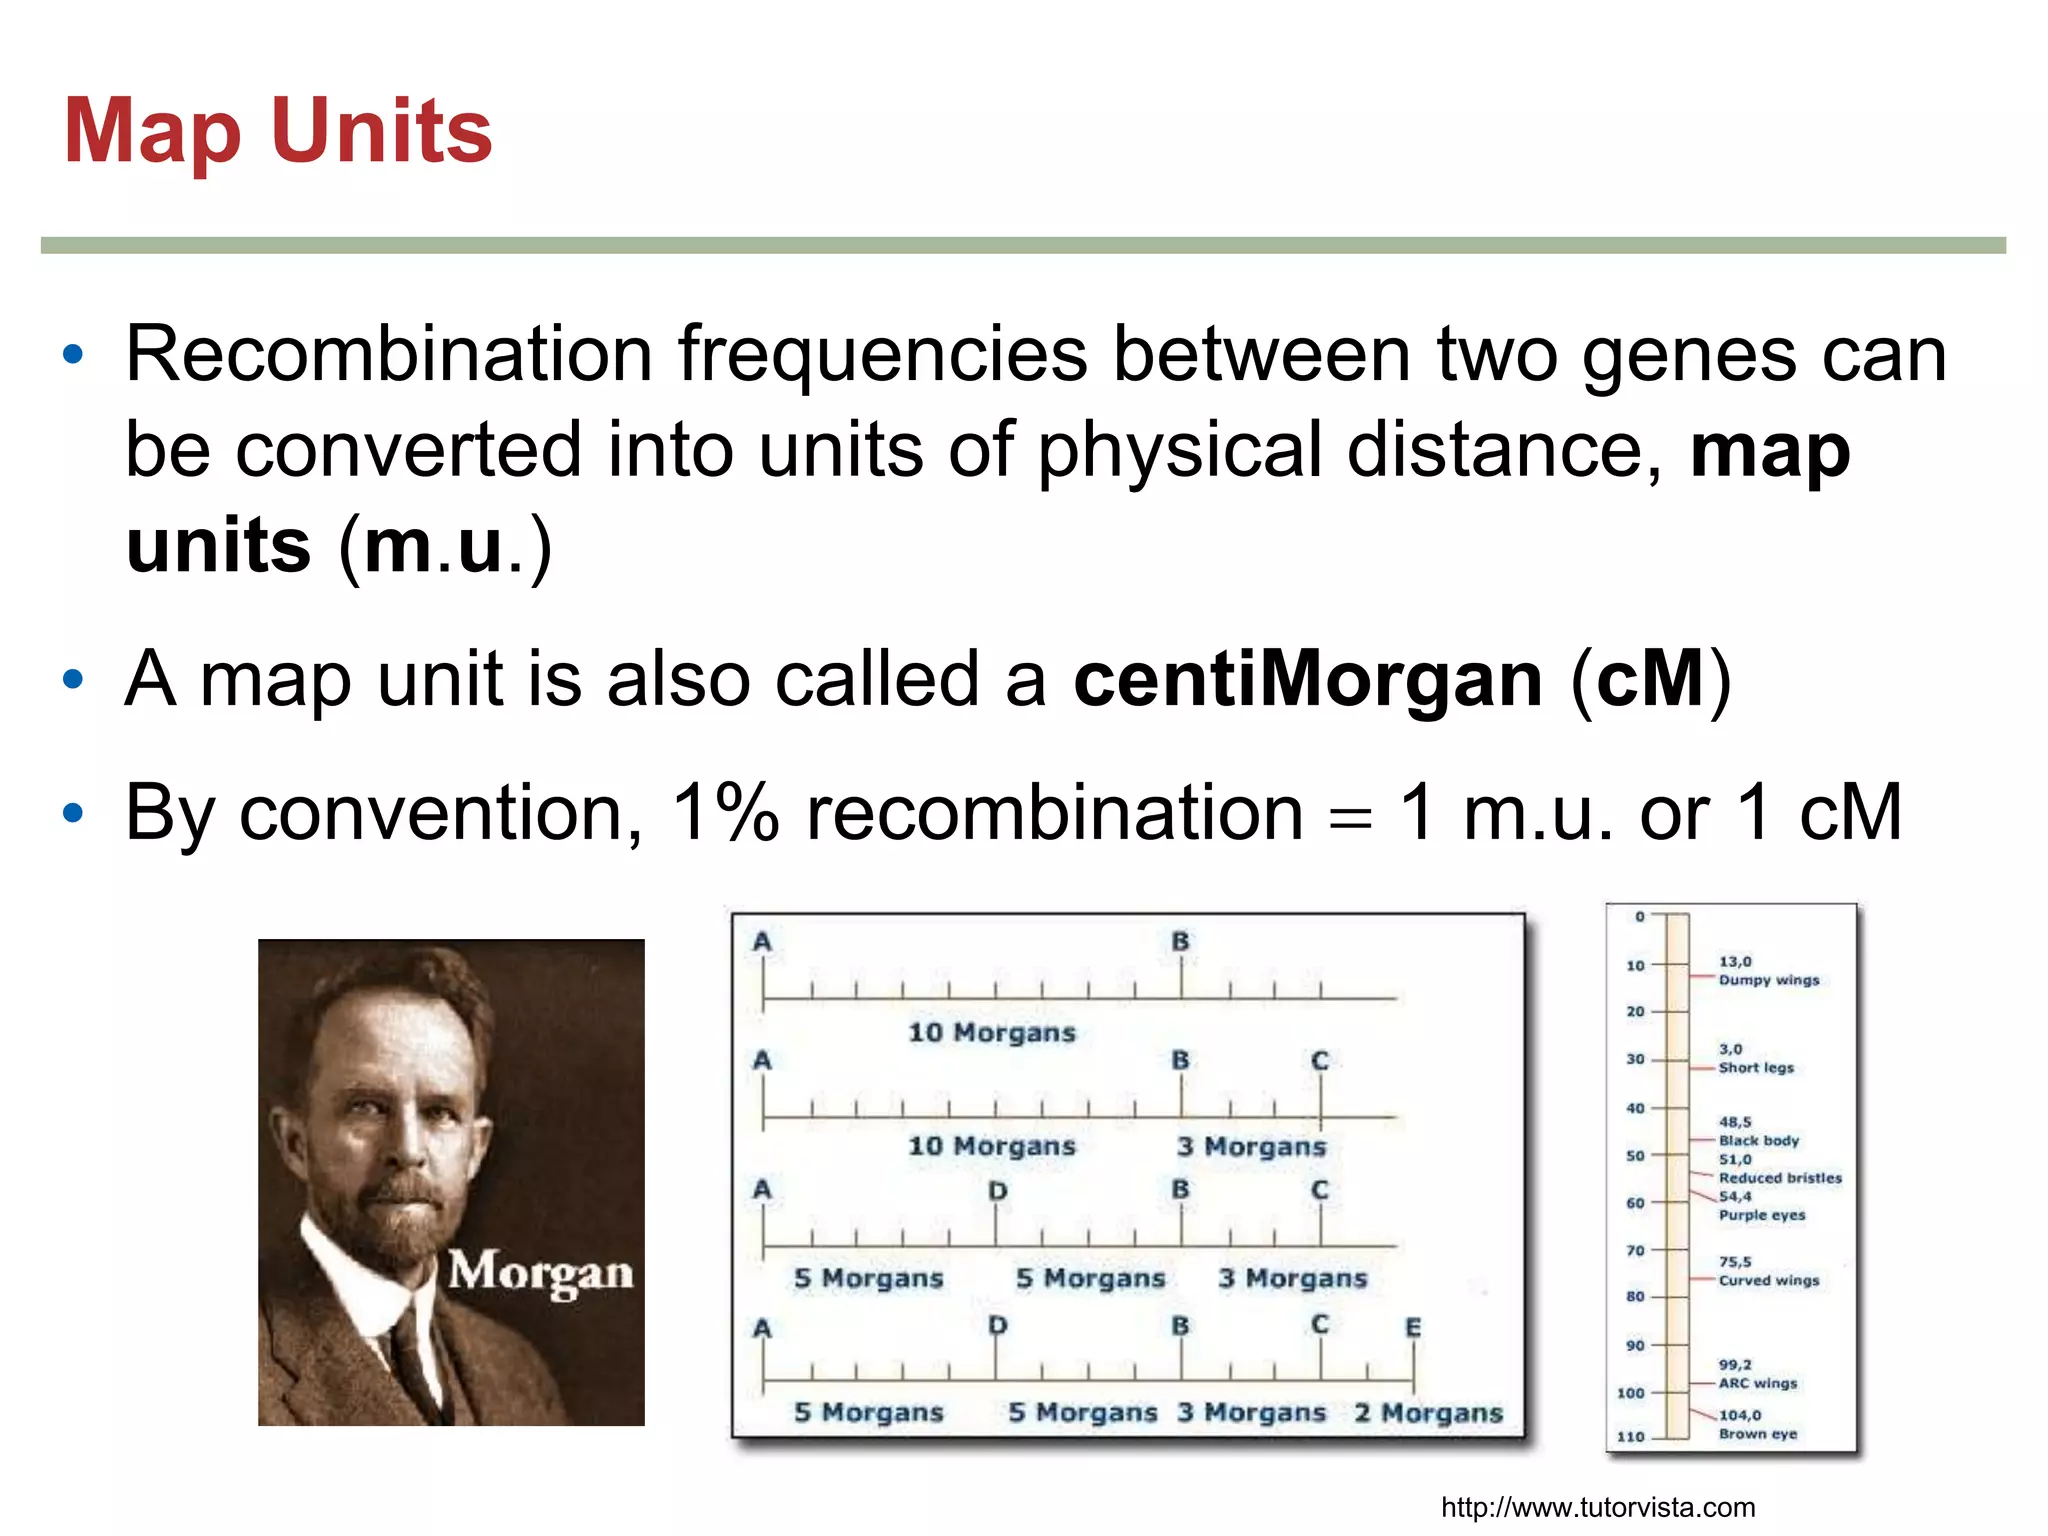
This document provides an overview of genetic linkage and mapping. It discusses how Thomas Morgan established the chromosome theory of inheritance by discovering genetic linkage between genes located on the same chromosome. Genes located close together on a chromosome assort together more often than genes farther apart due to less recombination between linked genes. The document describes Morgan's early experiments in Drosophila that demonstrated genetic linkage between eye color and wing size genes. It also explains how Alfred Sturtevant created the first genetic linkage map by quantifying recombination frequencies between linked genes on the X chromosome. The concept of map units (centiMorgans) is introduced as a way to represent the physical distance between genes based on their recombination rate.
![Example Mapping Problem, Cont’
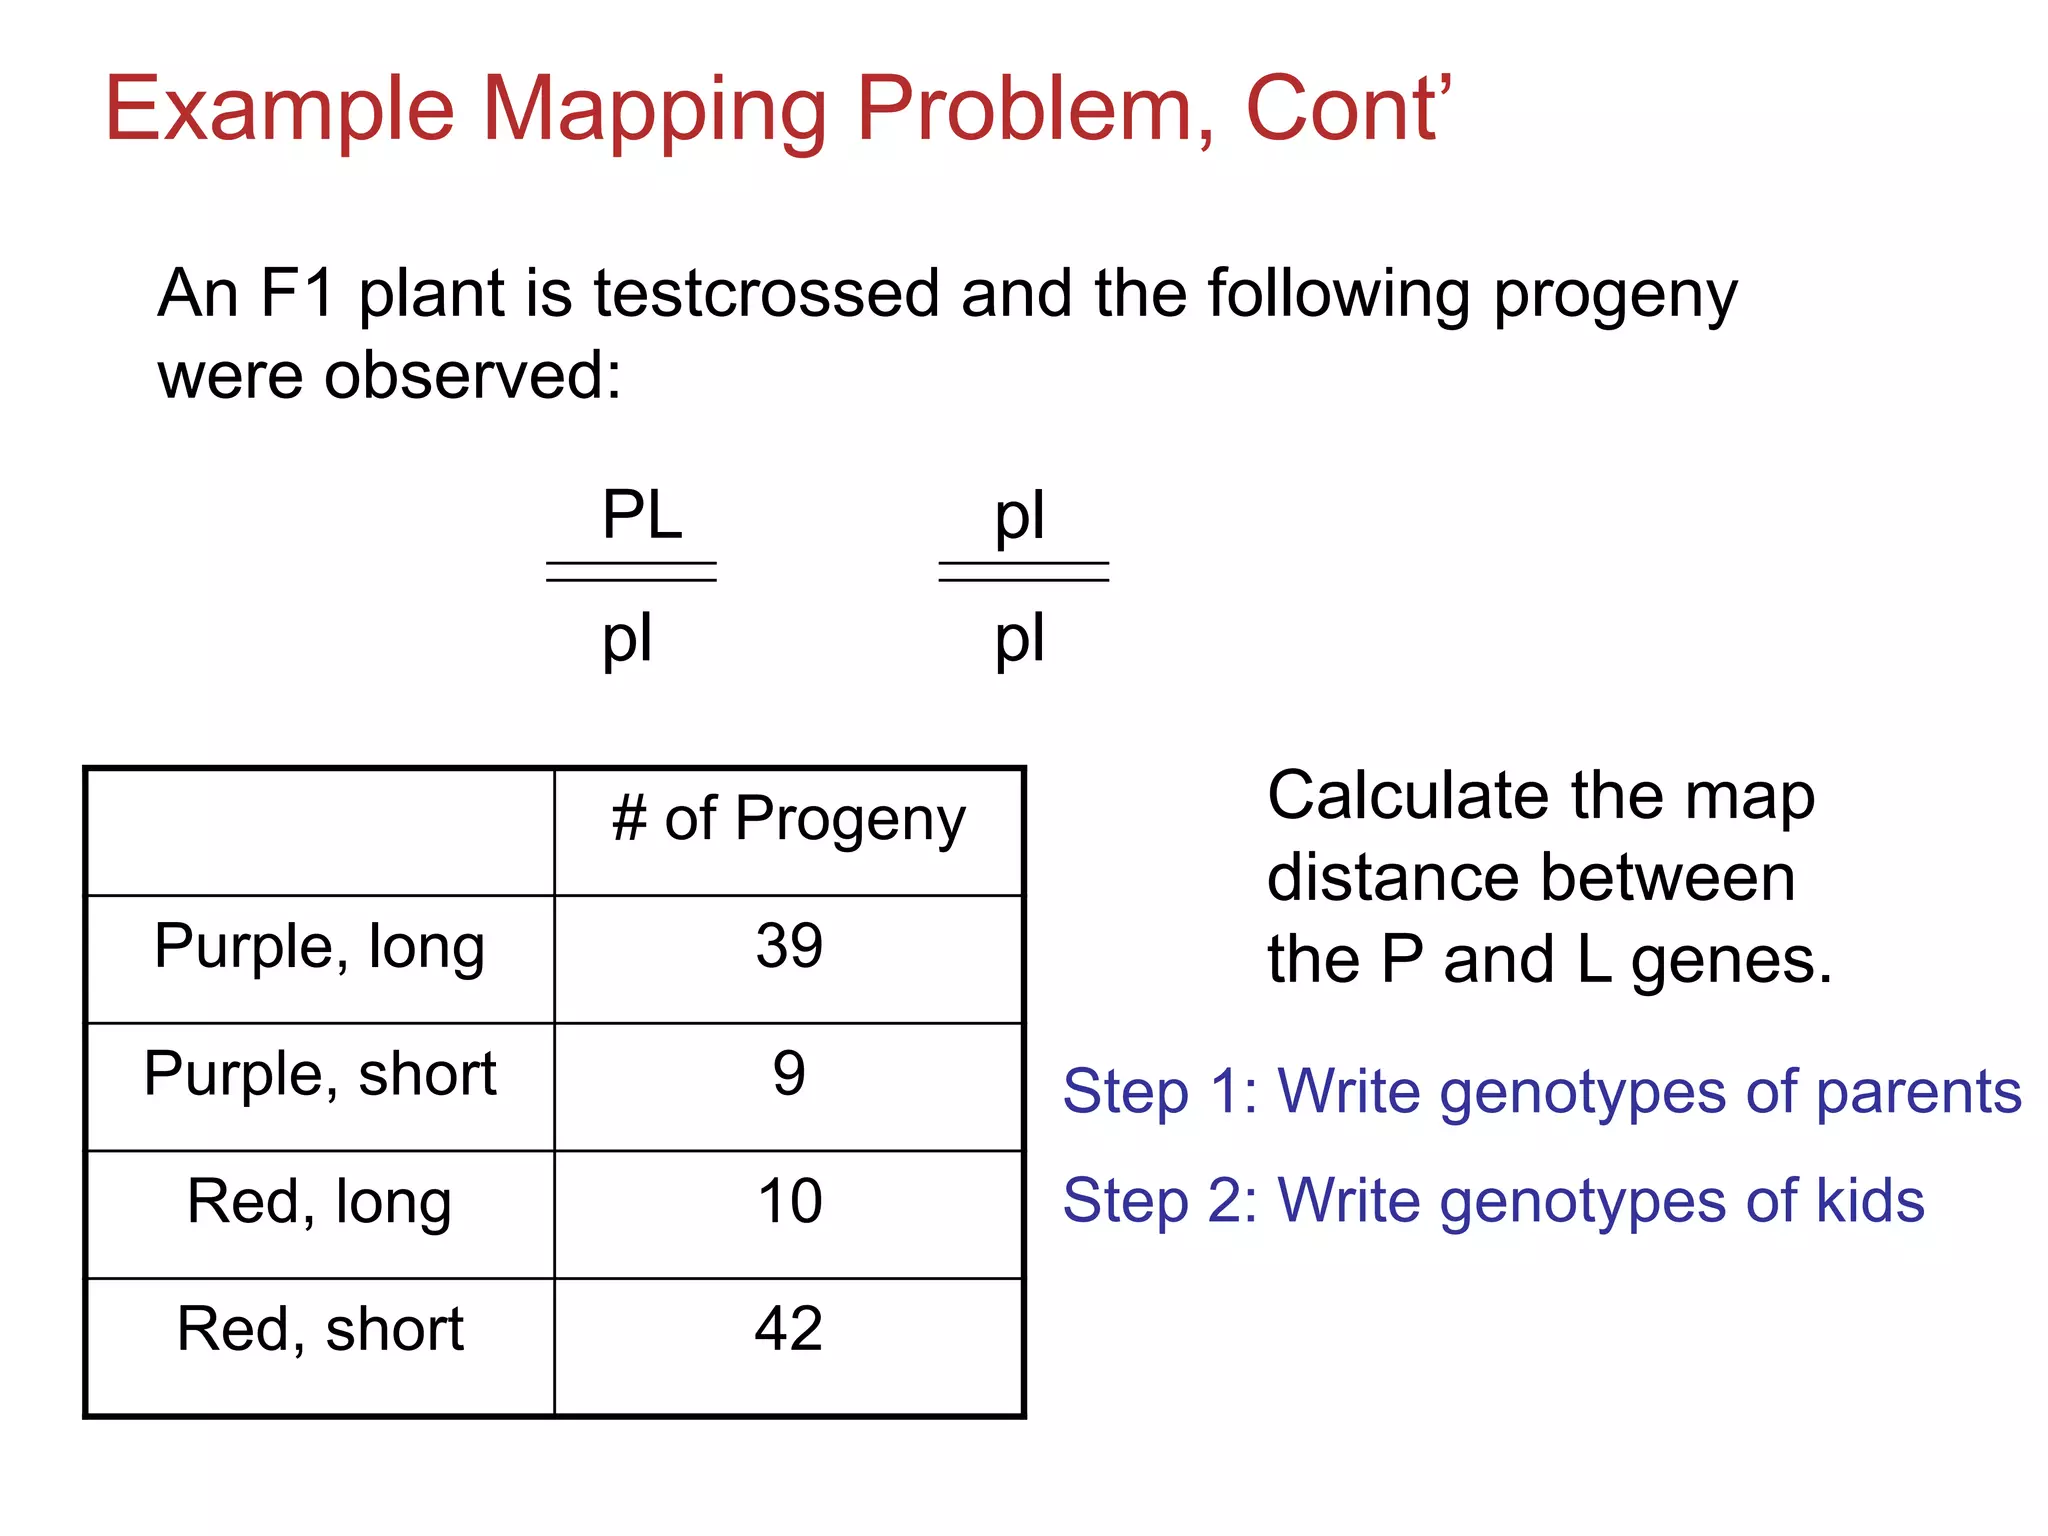
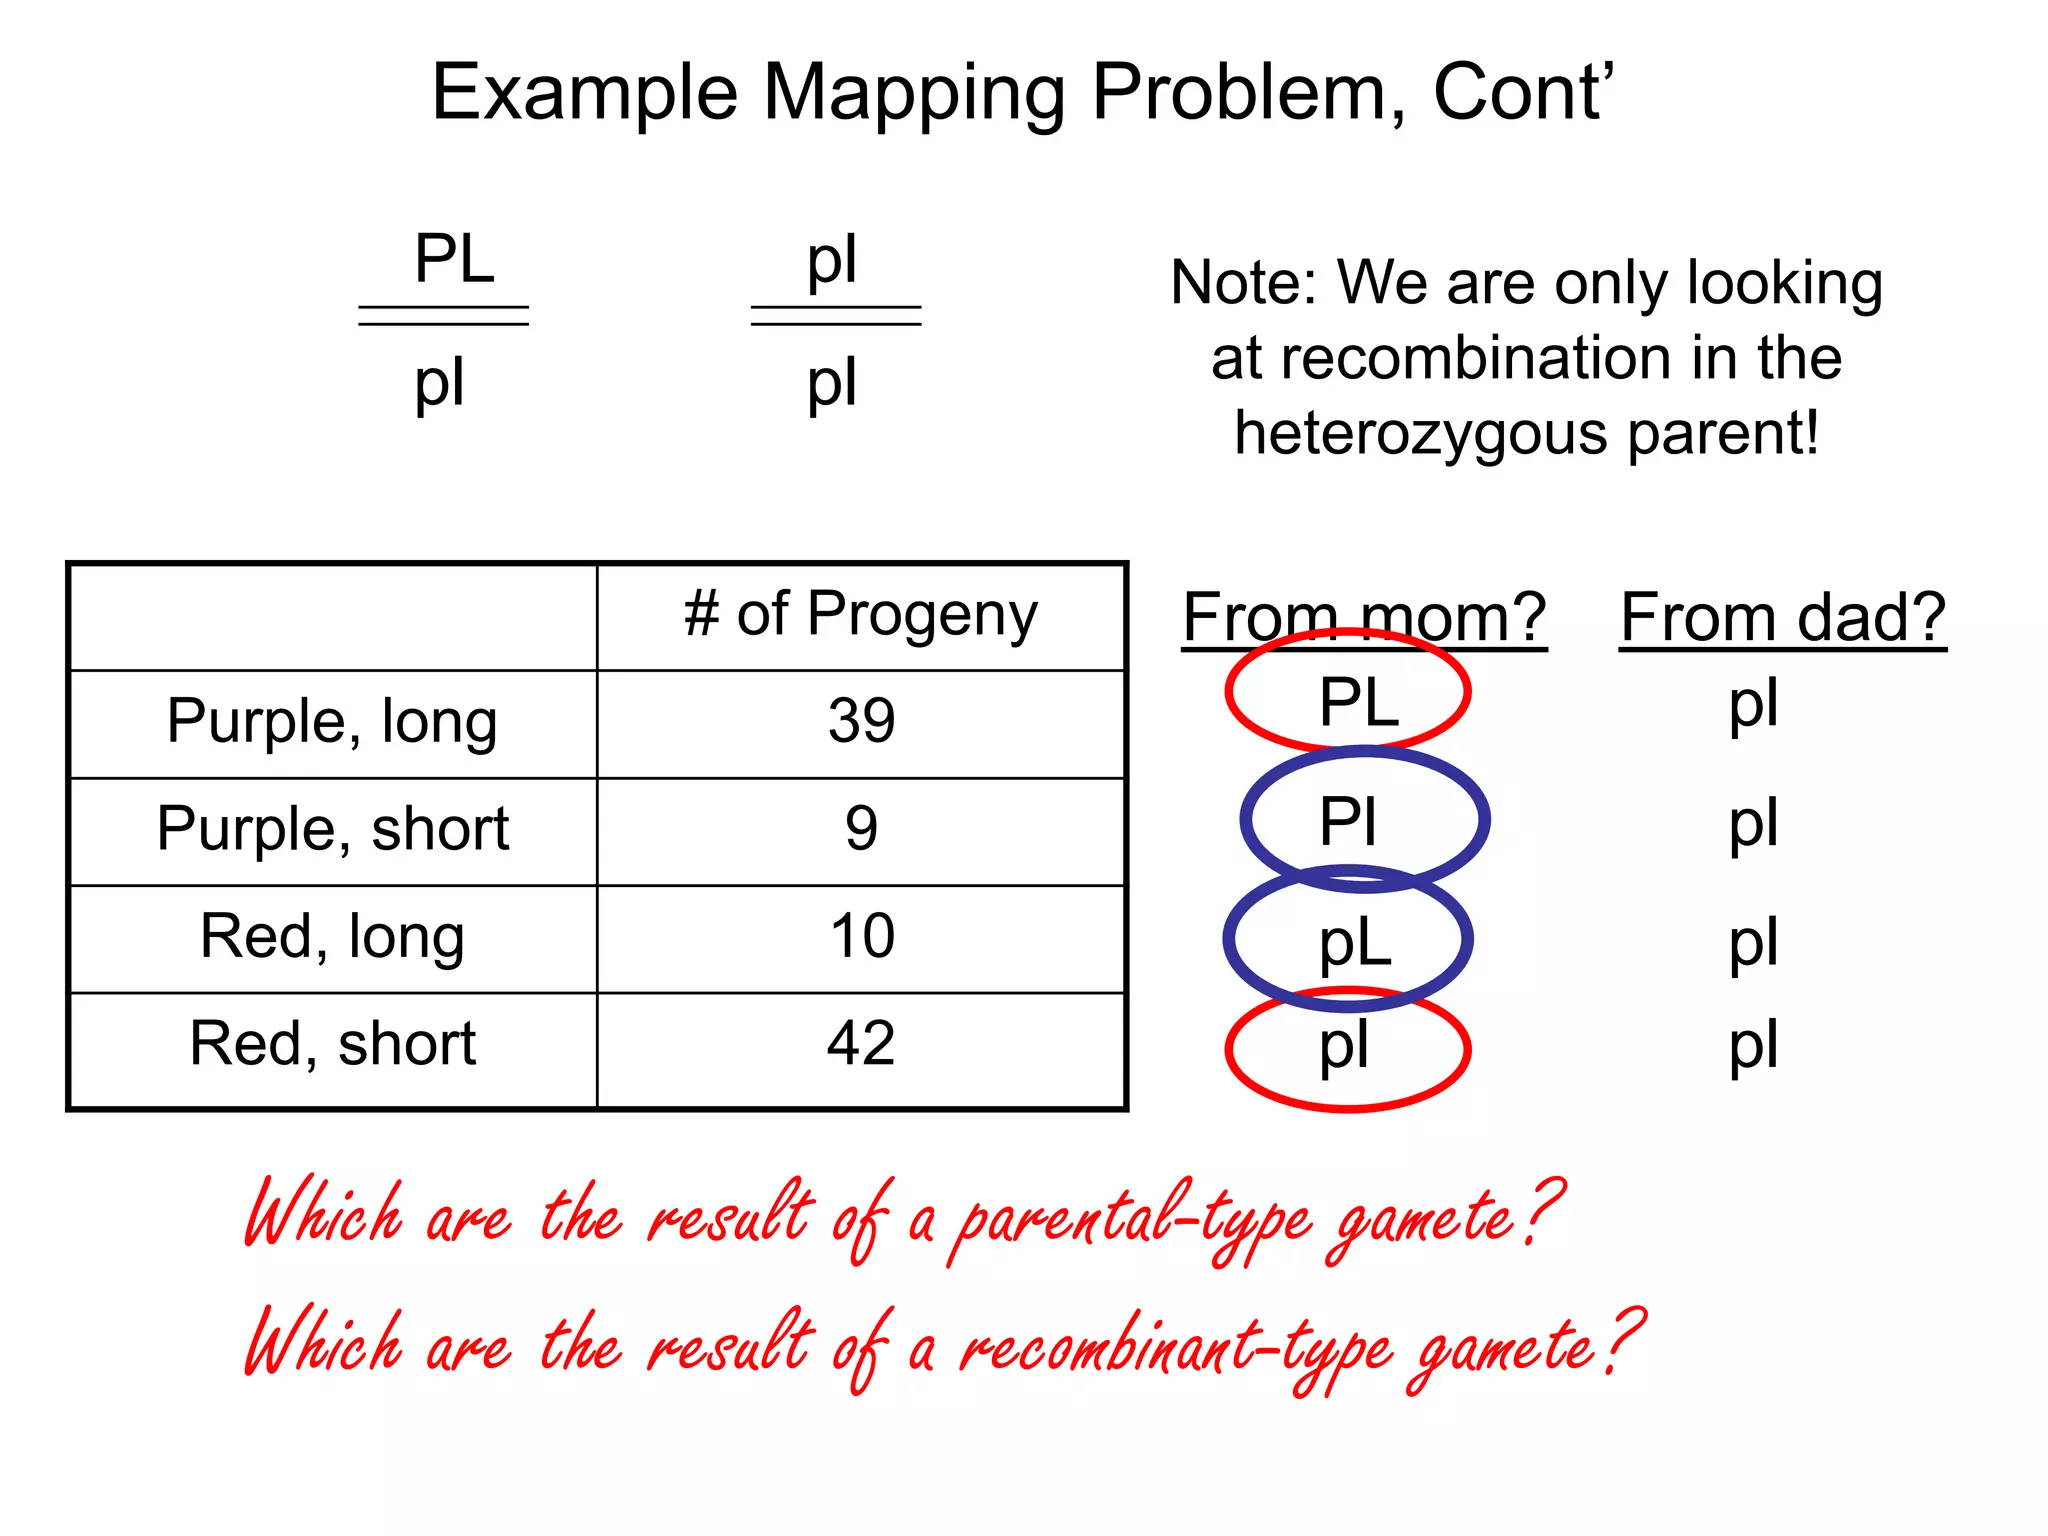
# of Progeny
Purple, long
39
Purple, short
9
Red, long
10
Red, short
42
These 19 progeny were the result of a recombination
between the “P” and “L” genes.
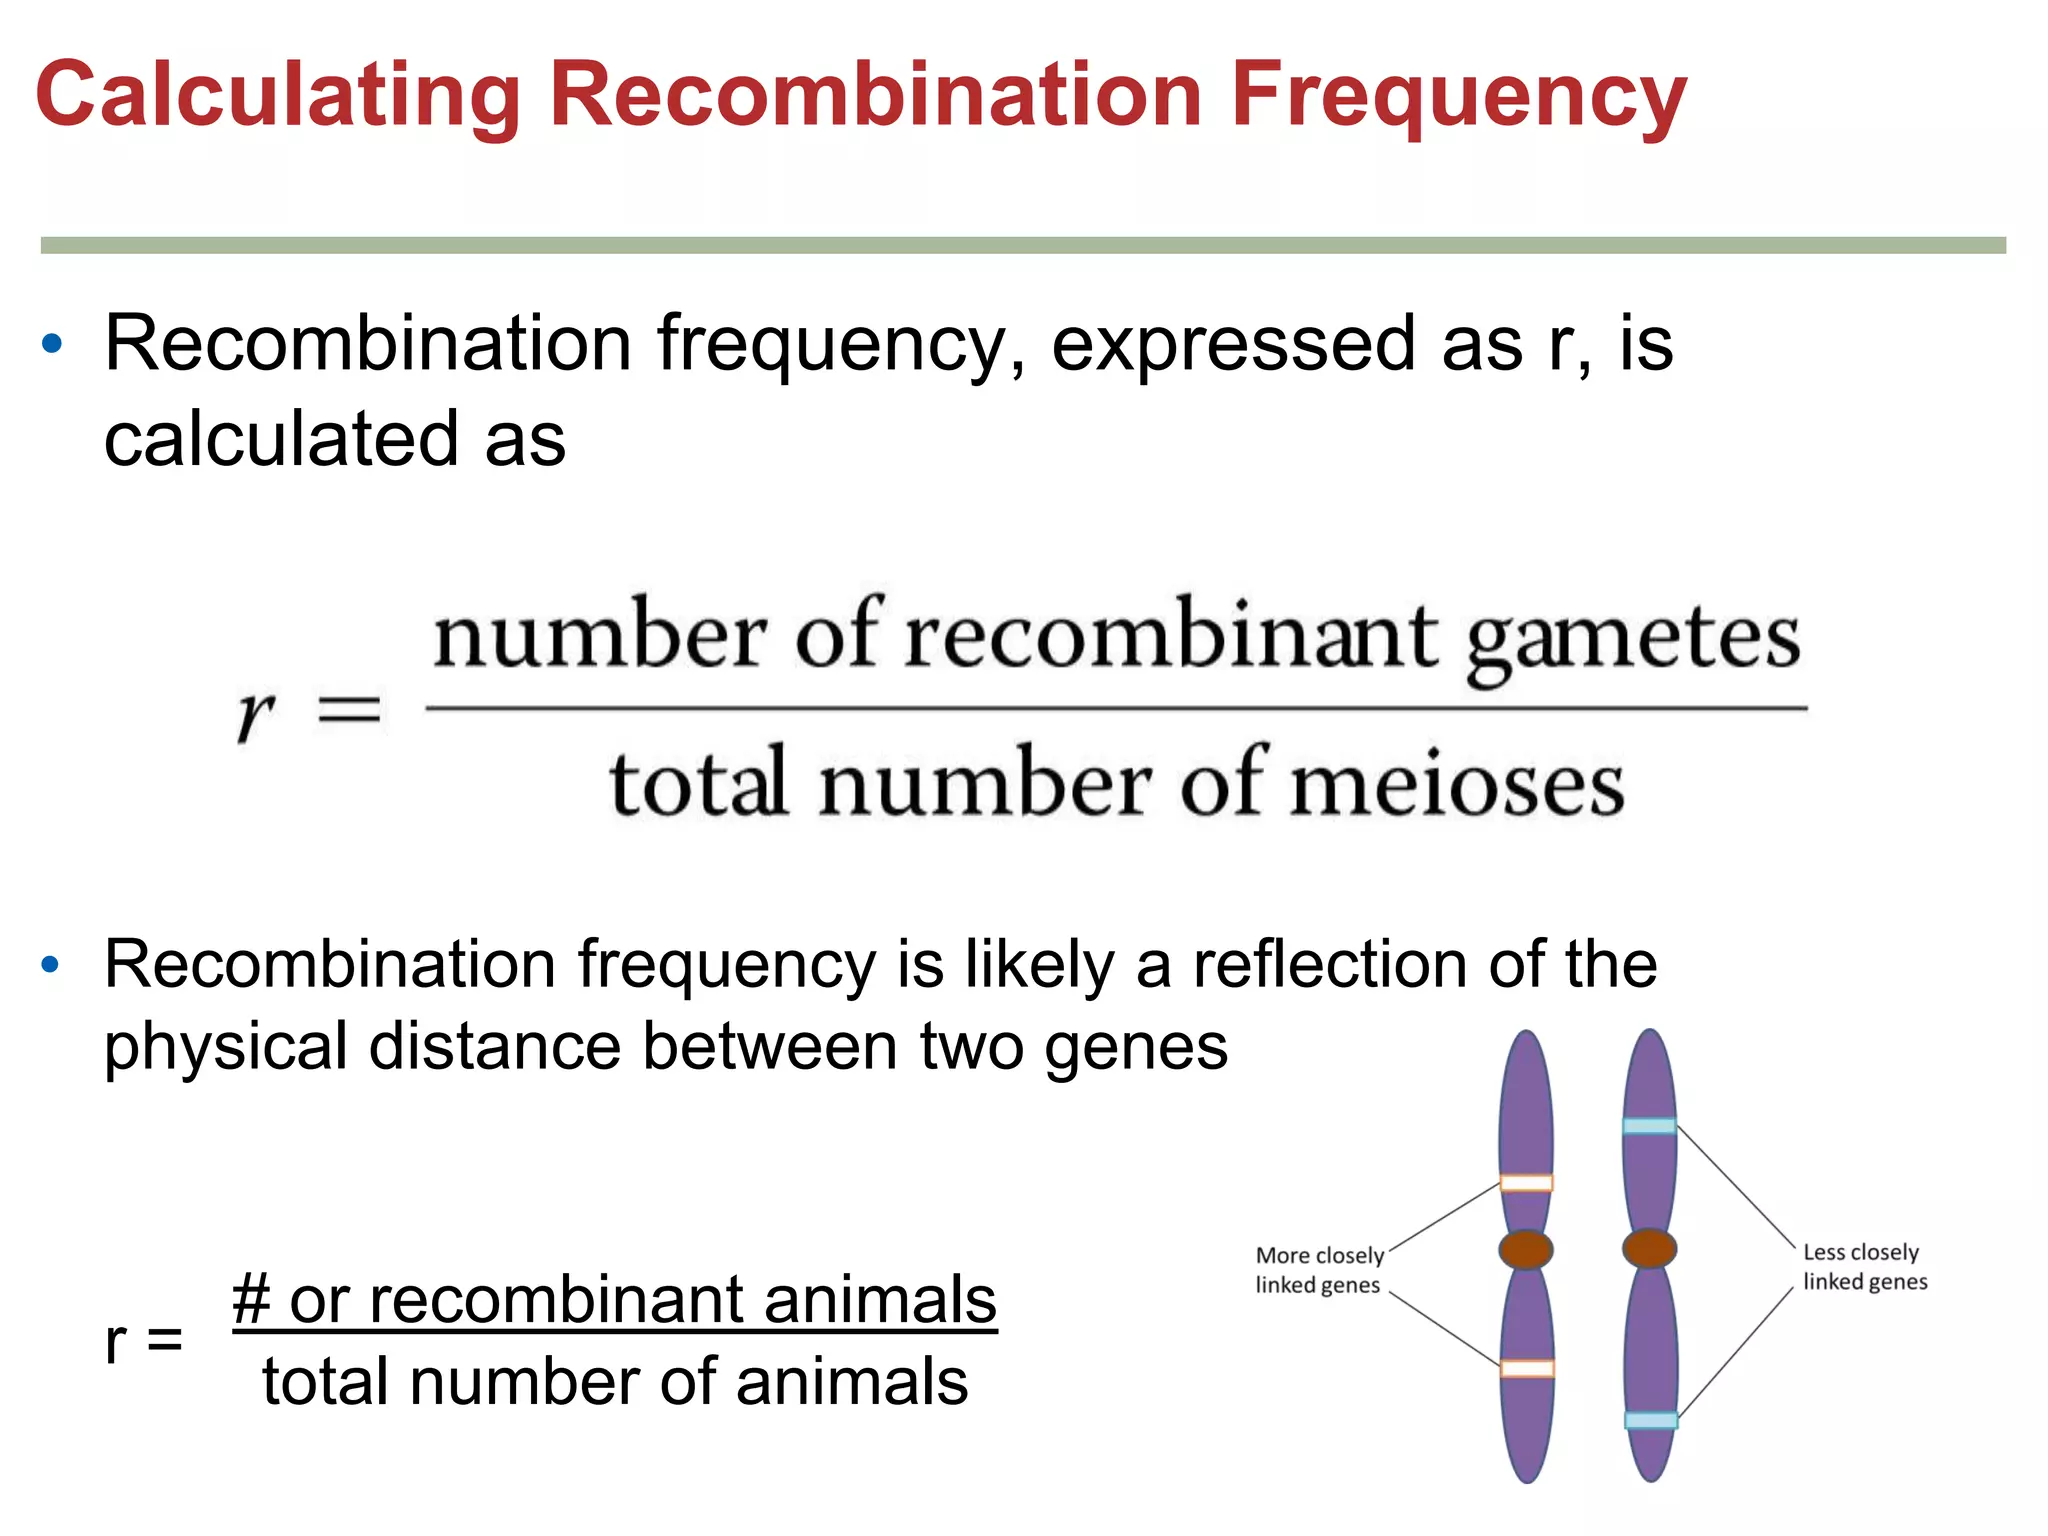
# Recombinants
Total # of progeny
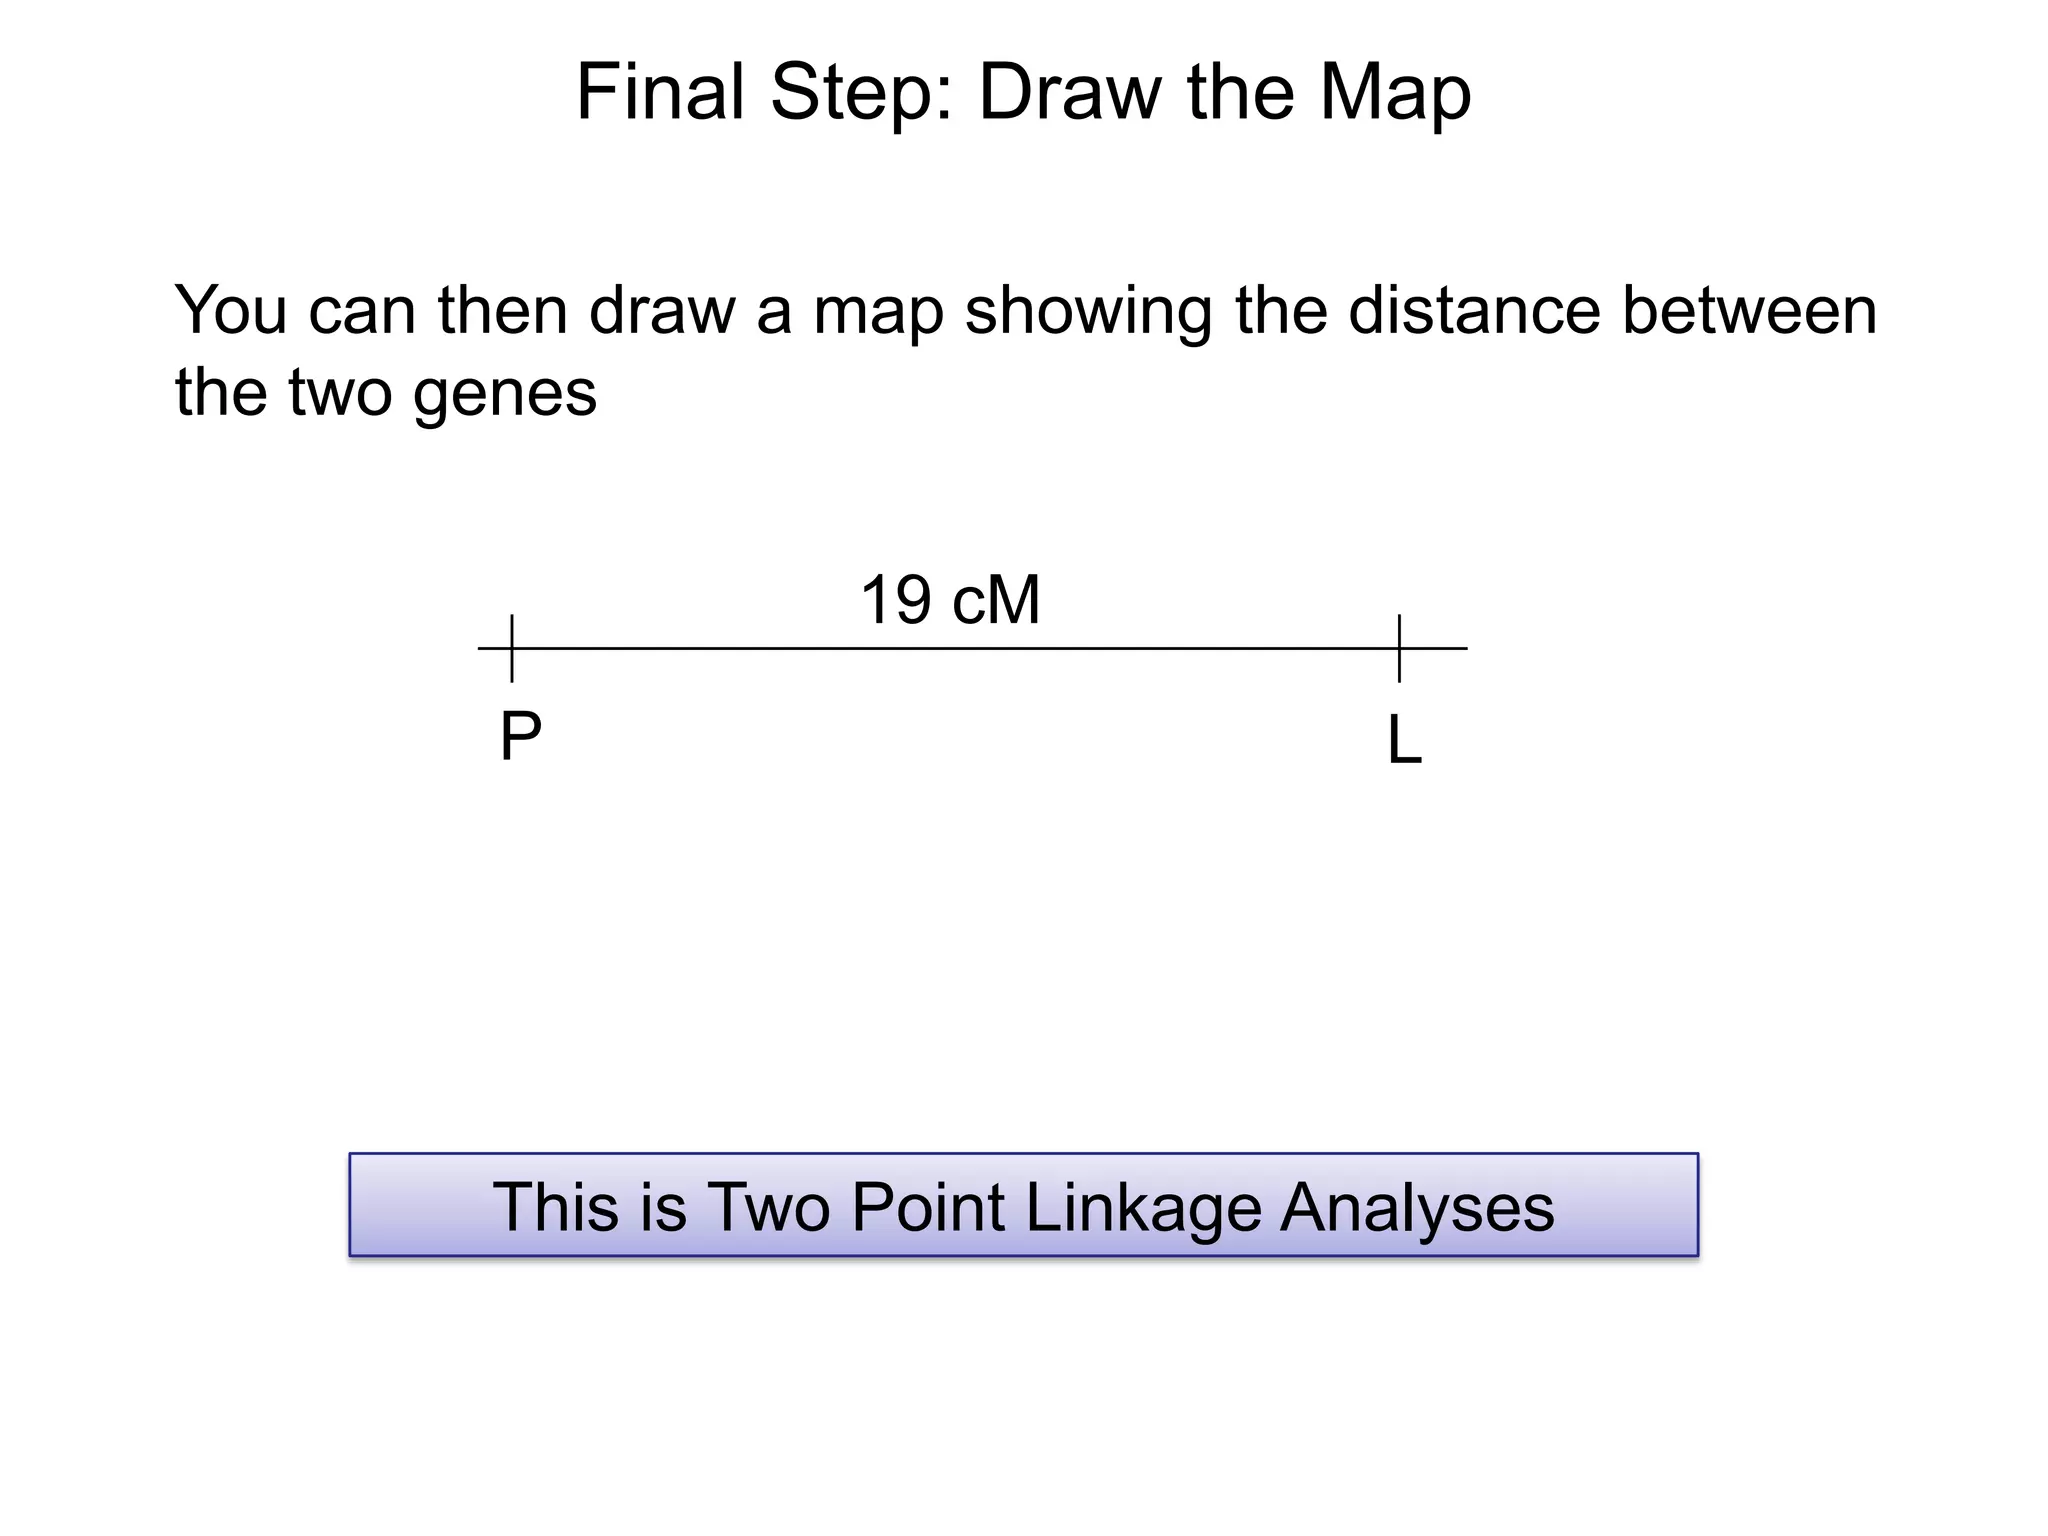
What is the map distance?
Recombination % =
X 100
= [(9 + 10) / 100] x 100 = 19%
The P and L genes are 19 cM apart](https://image.slidesharecdn.com/geneticschapter5part1-140222103829-phpapp02/75/Genetics-chapter-5-part-1-41-2048.jpg)


![extra-chromosomal-inheritance[1].pptx.pdfpdf](https://cdn.slidesharecdn.com/ss_thumbnails/extra-chromosomal-inheritance1-240529182826-8153c739-thumbnail.jpg?width=640&height=640&fit=bounds)