Downloaded 621 times
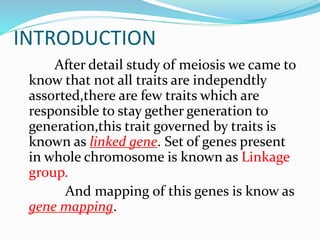
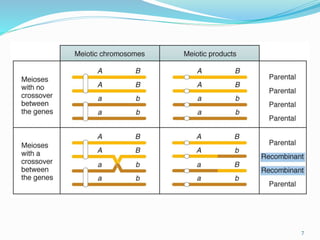
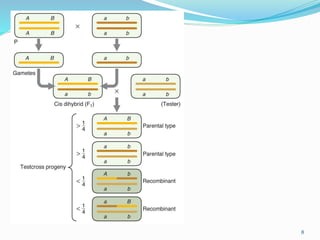
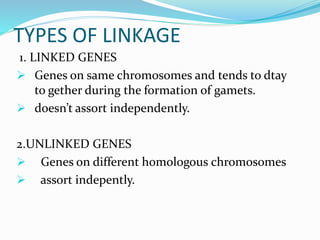
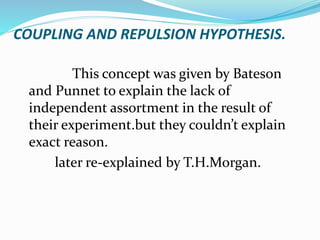
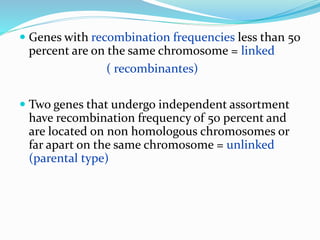
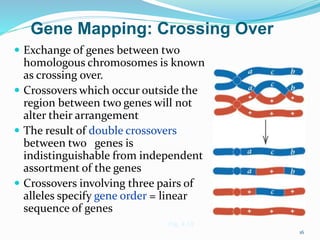
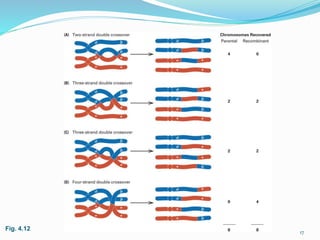
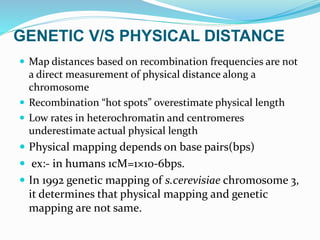
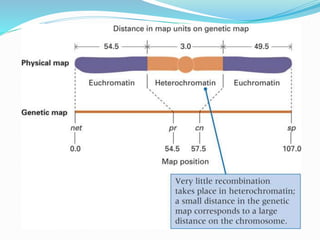
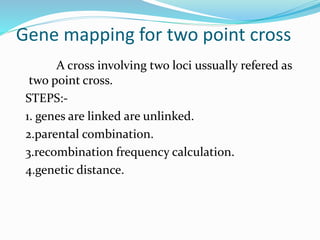
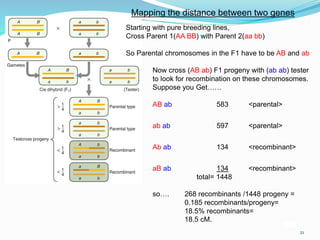
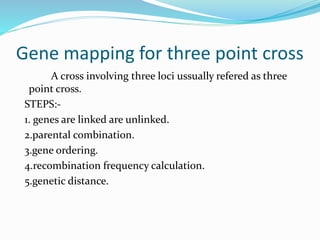


The document provides an overview of genetic linkage and gene mapping, detailing how linked genes on the same chromosome tend to inherit together and the concepts of coupling and repulsion phases. It discusses historical discoveries, methods for calculating recombination frequency, and the significance of tetrad analysis in determining gene linkage. Furthermore, it outlines the processes and formulas for gene mapping through both two-point and three-point crosses, emphasizing the relationship between genetic and physical distances.