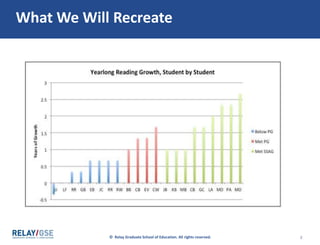
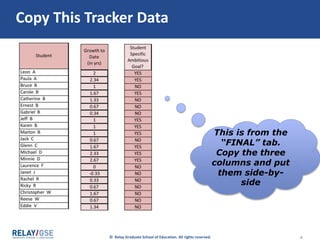
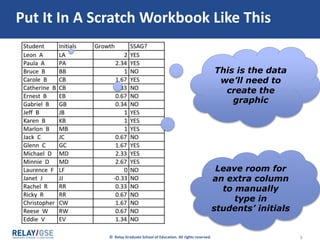
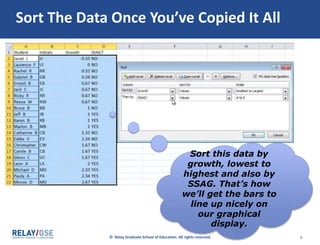
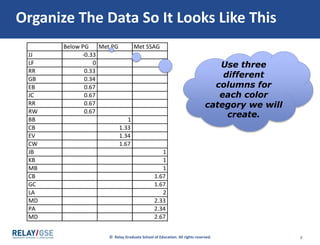
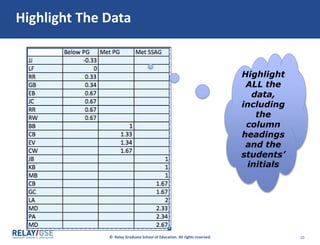
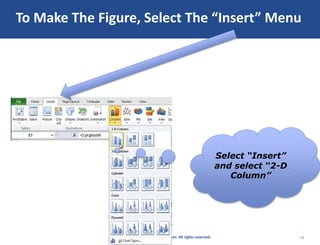
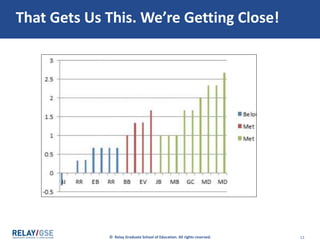
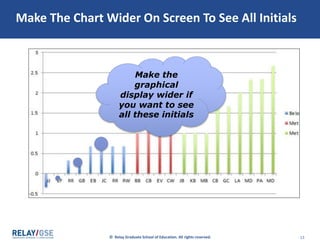
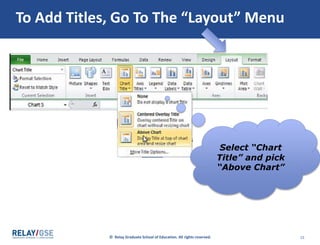
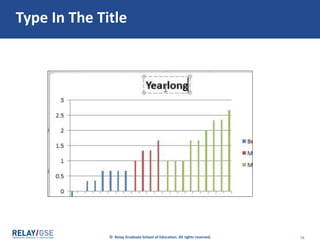
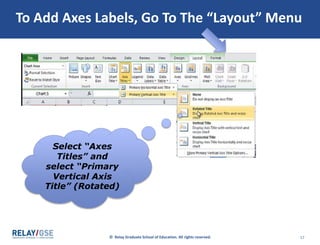
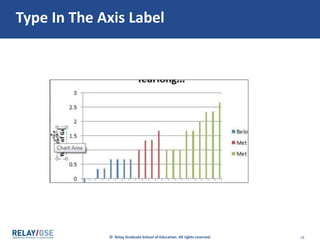
The document provides instructions for copying student assessment data from a tracker into a new workbook, organizing it into columns by category and sorting by growth level, then using this organized data to generate a column chart in Excel. The steps include highlighting the organized data and selecting "Insert" then "2-D Column" to create an initial chart, making the chart wider to see all student initials, and then adding a title and axis labels through the "Layout" menu to make the figure accessible.


![Data driven ppt_presentation[1]](https://cdn.slidesharecdn.com/ss_thumbnails/datadrivenpptpresentation1-100710102551-phpapp02-thumbnail.jpg?width=640&height=640&fit=bounds)


