Pivot Table | Statistics
•Download as PPTX, PDF•
1 like•1,459 views

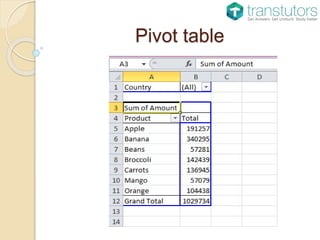
The pivot tables are not created mechanically. In Microsoft excel the user should select the data first for which the pivot table should be created. The pivot table option is available on the insert tab. The user has the option of inserting the pivot table either in the existing sheet or creating the pivot table in the new sheet. Copy the link given below and paste it in new browser window to get more information on Pivot Table:- http://www.transtutors.com/homework-help/statistics/pivot-table.aspx

Recommended
More Related Content
What's hot
What's hot (20)
Viewers also liked
Viewers also liked (20)
Similar to Pivot Table | Statistics
Similar to Pivot Table | Statistics (20)
More from Transweb Global Inc
More from Transweb Global Inc (20)
Recently uploaded
Recently uploaded (20)
Pivot Table | Statistics
- 1. Pivot table
- 2. Introduction Pivot table is one of most powerful features of excel. It allows the users to extract the consequence from the large and the detailed sets of data. A pivot table helps us to summarize the data quickly and emphasize the preferred information The practice of pivot table is tremendously broad and depends on the circumstances. Usually, a pivot table consists of rows, columns and the fact fields
- 3. Uses of pivot table A pivot table, without human intervention can sort, count total and average the stored data A pivot table is also useful for creating unweighted cross tabulations The pivot tables are not created mechanically. In Microsoft excel the user should select the data first for which the pivot table should be created. The pivot table option is available on the insert tab. Many pivot table tutorials have come into existence for the better understanding of the pivot tables
- 4. Pivot chart implementations Pivot chart was given for various versions of excel such as 2007, 2010 and 2013 The change is that the presence of the icons and the way they are implemented Once the user creates the pivot table changes like sort, filter, summary calculation can be done. By using the sort option the user can arrange the data according to the alphabetical order or in the descending order
- 5. Pivot chart A pivot chart is a tool that is used to analyze the data in the pivot table. Pivot chart is the built in feature of MS Excel and MS Access. Pivot chart is one of the best types of graphs used to analyze the data of the pivot table. In Microsoft Access a user can create multi plots from a shared data type. User cannot copy a pivot chart and paste it in the Microsoft Access. To insert a pivot chart in a worksheet, the users first have to select the table for which the pivot chart should be created. Then, from the insert tab the users can select the pivot chart option and fill the required details in the create pivot chart dialog box and click ok. The details such as location where the chart to be inserted whether in the existing worksheet or in the new worksheet and the details for which the pivot chart to be inserted etc. at last the pivot chart will appear on the worksheet where the users need the pivot chart to be inserted.
- 6. Features Pivot table has the ability to build a list of unique values as they have the ability to summarize data and to find the unique data in the given field. It is suggested as a good way for the excel works. The pivot table can be refreshed for the recent recorded data and can be setup for the different database, query and for the report updates also. Pivot table is known for its flexibility and for the formatting changes that occur in the data that is entered in the excel format along with the auto-format options. Each tim e when we create a pivot table, excel keeps a copy of the data and the entries in the memory. The pivot table is especially used for the location requirements and provides access to the OLAP data that is present in the form of cubes. We can base a pivot chart on another pivot chart directly without any defects
- 7. Hey Friends, This was just a summary on Pivot Table. For more detailed information on this topic, please type the link given below or copy it from the description of this PPT and open it in a new browser window. http://www.transtutors.com/homework- help/statistics/pivot-table.aspx