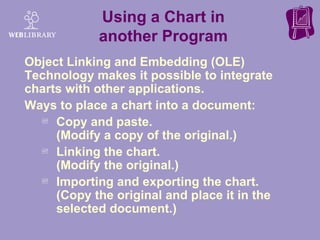
SlideShare a Scribd company logo
1 of 25
Using Charts and Graphs in the Classroom Visual Effects and Data Interpretation
Overview ,[object Object],[object Object]
Important Questions ,[object Object],[object Object],[object Object]
Charts and Graphs ,[object Object],[object Object],[object Object],Reasons to create charts and graphs:
Charts and Graphs ,[object Object],[object Object],[object Object],[object Object],[object Object],[object Object],[object Object]
Charts and Graphs ,[object Object],[object Object],[object Object],[object Object],[object Object],[object Object]
Products for Creating Charts and Graphs ,[object Object],[object Object],[object Object],[object Object],[object Object],[object Object],[object Object]
Charting Considerations ,[object Object],[object Object],[object Object],[object Object]
Charting Considerations ,[object Object],[object Object],[object Object]
Charting Terminology  ,[object Object],[object Object],[object Object],[object Object],[object Object],[object Object]
Classroom Applications of Charts or Graphs ,[object Object],[object Object],[object Object],[object Object],[object Object],[object Object],[object Object]
Charts and Graphs ,[object Object],[object Object],[object Object],[object Object]
Modifying Charts ,[object Object],[object Object],[object Object],[object Object],[object Object]
Modifying Charts ,[object Object],[object Object],[object Object]
Modifying Charts ,[object Object],[object Object]
Using a Chart in another Program ,[object Object],[object Object],[object Object],[object Object],[object Object]
Resizing Charts ,[object Object],[object Object],[object Object]
Integrating ,[object Object],[object Object]
[object Object],[object Object],[object Object],[object Object],[object Object],[object Object],[object Object],Integrating
[object Object],[object Object],[object Object],[object Object],Integrating The use of integrated application software can help students:
[object Object],[object Object],[object Object],[object Object],[object Object],Integrating Bitter and Pierson (2002) suggest the following for learning activities that integrate technology:
[object Object],[object Object],[object Object],[object Object],Integrating Bitter and Pierson (2002) suggest the following for learning activities that integrate technology:
References  ,[object Object],[object Object]
Summary ,[object Object],Remember,  “a picture is worth a thousand words…”

More Related Content

What's hot

Pivot table essential learning 1
Pivot table   essential learning 1Pivot table   essential learning 1
Pivot table essential learning 1
Vijay Perepa
 
SharePoint - Make Informed Decisions
SharePoint - Make Informed DecisionsSharePoint - Make Informed Decisions
SharePoint - Make Informed Decisions
David J Rosenthal
 
Instructions for analysis of results 2013 leaving certificate
Instructions for analysis of results 2013 leaving certificateInstructions for analysis of results 2013 leaving certificate
Instructions for analysis of results 2013 leaving certificate
Martin Brown
 

What's hot (19)

Tableau data types
Tableau   data typesTableau   data types
Tableau data types
 
Spreadsheet terminology
Spreadsheet terminologySpreadsheet terminology
Spreadsheet terminology
 
Office 365 Tip: Analyze Data Effectively
Office 365 Tip: Analyze Data EffectivelyOffice 365 Tip: Analyze Data Effectively
Office 365 Tip: Analyze Data Effectively
 
Spreadsheets Chapter 8
Spreadsheets Chapter 8Spreadsheets Chapter 8
Spreadsheets Chapter 8
 
Pivot table and Dashboard in microsoft excel
Pivot table  and Dashboard in microsoft excelPivot table  and Dashboard in microsoft excel
Pivot table and Dashboard in microsoft excel
 
Tableau Final Presentation
Tableau Final PresentationTableau Final Presentation
Tableau Final Presentation
 
What are dashboards?
What are dashboards?What are dashboards?
What are dashboards?
 
ICT: SPREADSHEETS (MICROSOFT EXCEL)
ICT: SPREADSHEETS (MICROSOFT EXCEL)ICT: SPREADSHEETS (MICROSOFT EXCEL)
ICT: SPREADSHEETS (MICROSOFT EXCEL)
 
Working with Pivot Tables
Working with Pivot TablesWorking with Pivot Tables
Working with Pivot Tables
 
Pivot table essential learning 1
Pivot table   essential learning 1Pivot table   essential learning 1
Pivot table essential learning 1
 
Microsoft excel
Microsoft excelMicrosoft excel
Microsoft excel
 
graphing experimental result
graphing experimental resultgraphing experimental result
graphing experimental result
 
Microsoft excel
Microsoft excelMicrosoft excel
Microsoft excel
 
Every graph tells a story
Every graph tells a story Every graph tells a story
Every graph tells a story
 
Performance Indicators Percentage Circle
Performance Indicators Percentage CirclePerformance Indicators Percentage Circle
Performance Indicators Percentage Circle
 
MS access (basic)
MS access (basic)MS access (basic)
MS access (basic)
 
Excel syllabusppt
Excel syllabuspptExcel syllabusppt
Excel syllabusppt
 
SharePoint - Make Informed Decisions
SharePoint - Make Informed DecisionsSharePoint - Make Informed Decisions
SharePoint - Make Informed Decisions
 
Instructions for analysis of results 2013 leaving certificate
Instructions for analysis of results 2013 leaving certificateInstructions for analysis of results 2013 leaving certificate
Instructions for analysis of results 2013 leaving certificate
 

Viewers also liked

3 2016 pept overview - philippine educational placement test
3 2016 pept overview - philippine educational placement test3 2016 pept overview - philippine educational placement test
3 2016 pept overview - philippine educational placement test
jhaymz02
 
Picture description
Picture descriptionPicture description
Picture description
jcgarrido
 
Educational Technology Exam
Educational Technology ExamEducational Technology Exam
Educational Technology Exam
jwheetley
 
Educational Technology Exam Review
Educational Technology Exam ReviewEducational Technology Exam Review
Educational Technology Exam Review
jwheetley
 
The roles of educational technology in learning
The roles of educational technology in learningThe roles of educational technology in learning
The roles of educational technology in learning
Mary Blaise Mantiza
 
Educational technology presentation
Educational technology presentationEducational technology presentation
Educational technology presentation
JamieDeYoung
 

Viewers also liked (16)

3 2016 pept overview - philippine educational placement test
3 2016 pept overview - philippine educational placement test3 2016 pept overview - philippine educational placement test
3 2016 pept overview - philippine educational placement test
 
Picture description
Picture descriptionPicture description
Picture description
 
Students Vote 2016: State Results
Students Vote 2016: State ResultsStudents Vote 2016: State Results
Students Vote 2016: State Results
 
Educational technology
Educational technologyEducational technology
Educational technology
 
Computer graphics mcq question bank
Computer graphics mcq question bankComputer graphics mcq question bank
Computer graphics mcq question bank
 
Educational media and technology solved multiple choice questions
Educational media and technology solved multiple choice questionsEducational media and technology solved multiple choice questions
Educational media and technology solved multiple choice questions
 
Mcq for final
Mcq for finalMcq for final
Mcq for final
 
Educational Technology Exam
Educational Technology ExamEducational Technology Exam
Educational Technology Exam
 
Edgar Dales Cone Of Experience1
Edgar Dales Cone Of Experience1Edgar Dales Cone Of Experience1
Edgar Dales Cone Of Experience1
 
Educational Technology Exam Review
Educational Technology Exam ReviewEducational Technology Exam Review
Educational Technology Exam Review
 
Educational Technology 2 Lesson 1
Educational Technology 2 Lesson 1Educational Technology 2 Lesson 1
Educational Technology 2 Lesson 1
 
01-Educational Technology 2
01-Educational Technology 201-Educational Technology 2
01-Educational Technology 2
 
The roles of educational technology in learning
The roles of educational technology in learningThe roles of educational technology in learning
The roles of educational technology in learning
 
Educational technology presentation
Educational technology presentationEducational technology presentation
Educational technology presentation
 
Evaluation of educational technology and its current application
Evaluation of educational technology and its current applicationEvaluation of educational technology and its current application
Evaluation of educational technology and its current application
 
Comparing and Contrasting photos
Comparing and Contrasting photosComparing and Contrasting photos
Comparing and Contrasting photos
 

Similar to Teachcht

Data-Presentation-and-Interpretation-in-Tabular-Graphical.pptx
Data-Presentation-and-Interpretation-in-Tabular-Graphical.pptxData-Presentation-and-Interpretation-in-Tabular-Graphical.pptx
Data-Presentation-and-Interpretation-in-Tabular-Graphical.pptx
shyrahipolitoe
 
Applications: Word-Processing, Spreadsheet & Database
Applications: Word-Processing, Spreadsheet & DatabaseApplications: Word-Processing, Spreadsheet & Database
Applications: Word-Processing, Spreadsheet & Database
Alaa Sadik
 
For Part 1, write 400–500 words analyzing characterization and poi
For Part 1, write 400–500 words analyzing characterization and poiFor Part 1, write 400–500 words analyzing characterization and poi
For Part 1, write 400–500 words analyzing characterization and poi
ShainaBoling829
 
Spreadsheets in education
Spreadsheets in educationSpreadsheets in education
Spreadsheets in education
jessicaajanee
 

Similar to Teachcht (20)

Lect10
Lect10Lect10
Lect10
 
The Art of Data Visualization in Microsoft Excel for Mac.pdf
The Art of Data Visualization in Microsoft Excel for Mac.pdfThe Art of Data Visualization in Microsoft Excel for Mac.pdf
The Art of Data Visualization in Microsoft Excel for Mac.pdf
 
Tableau for beginners
Tableau for beginnersTableau for beginners
Tableau for beginners
 
Tableau for beginners
Tableau for beginnersTableau for beginners
Tableau for beginners
 
tableau online training course Content
 tableau online training course Content tableau online training course Content
tableau online training course Content
 
Data-Presentation-and-Interpretation-in-Tabular-Graphical.pptx
Data-Presentation-and-Interpretation-in-Tabular-Graphical.pptxData-Presentation-and-Interpretation-in-Tabular-Graphical.pptx
Data-Presentation-and-Interpretation-in-Tabular-Graphical.pptx
 
Exp2003 exl ppt_03
Exp2003 exl ppt_03Exp2003 exl ppt_03
Exp2003 exl ppt_03
 
DataScience_RoadMap_2023.pdf
DataScience_RoadMap_2023.pdfDataScience_RoadMap_2023.pdf
DataScience_RoadMap_2023.pdf
 
Use-of-ICT-in-presentation.pdf
Use-of-ICT-in-presentation.pdfUse-of-ICT-in-presentation.pdf
Use-of-ICT-in-presentation.pdf
 
Lab file on research methodology
Lab file on research methodologyLab file on research methodology
Lab file on research methodology
 
ADP L7 Tables and Figures
ADP L7 Tables and FiguresADP L7 Tables and Figures
ADP L7 Tables and Figures
 
The use of data visualization to tell effective
The use of data visualization to tell effectiveThe use of data visualization to tell effective
The use of data visualization to tell effective
 
Applications: Word-Processing, Spreadsheet & Database
Applications: Word-Processing, Spreadsheet & DatabaseApplications: Word-Processing, Spreadsheet & Database
Applications: Word-Processing, Spreadsheet & Database
 
Using Excel in Mathematics
Using Excel in MathematicsUsing Excel in Mathematics
Using Excel in Mathematics
 
data_science_introduction_for beginners.pptx
data_science_introduction_for beginners.pptxdata_science_introduction_for beginners.pptx
data_science_introduction_for beginners.pptx
 
Extension presentation
Extension presentationExtension presentation
Extension presentation
 
Technology in maths and maths in technology
Technology  in maths and maths in technologyTechnology  in maths and maths in technology
Technology in maths and maths in technology
 
Assessment tools
Assessment toolsAssessment tools
Assessment tools
 
For Part 1, write 400–500 words analyzing characterization and poi
For Part 1, write 400–500 words analyzing characterization and poiFor Part 1, write 400–500 words analyzing characterization and poi
For Part 1, write 400–500 words analyzing characterization and poi
 
Spreadsheets in education
Spreadsheets in educationSpreadsheets in education
Spreadsheets in education
 

Recently uploaded

Modular Monolith - a Practical Alternative to Microservices @ Devoxx UK 2024
Modular Monolith - a Practical Alternative to Microservices @ Devoxx UK 2024Modular Monolith - a Practical Alternative to Microservices @ Devoxx UK 2024
Modular Monolith - a Practical Alternative to Microservices @ Devoxx UK 2024
Victor Rentea
 
Why Teams call analytics are critical to your entire business
Why Teams call analytics are critical to your entire businessWhy Teams call analytics are critical to your entire business
Why Teams call analytics are critical to your entire business
panagenda
 
Cloud Frontiers: A Deep Dive into Serverless Spatial Data and FME
Cloud Frontiers:  A Deep Dive into Serverless Spatial Data and FMECloud Frontiers:  A Deep Dive into Serverless Spatial Data and FME
Cloud Frontiers: A Deep Dive into Serverless Spatial Data and FME
Safe Software
 

Recently uploaded (20)

"I see eyes in my soup": How Delivery Hero implemented the safety system for ...
"I see eyes in my soup": How Delivery Hero implemented the safety system for ..."I see eyes in my soup": How Delivery Hero implemented the safety system for ...
"I see eyes in my soup": How Delivery Hero implemented the safety system for ...
 
How to Troubleshoot Apps for the Modern Connected Worker
How to Troubleshoot Apps for the Modern Connected WorkerHow to Troubleshoot Apps for the Modern Connected Worker
How to Troubleshoot Apps for the Modern Connected Worker
 
[BuildWithAI] Introduction to Gemini.pdf
[BuildWithAI] Introduction to Gemini.pdf[BuildWithAI] Introduction to Gemini.pdf
[BuildWithAI] Introduction to Gemini.pdf
 
Decarbonising Commercial Real Estate: The Role of Operational Performance
Decarbonising Commercial Real Estate: The Role of Operational PerformanceDecarbonising Commercial Real Estate: The Role of Operational Performance
Decarbonising Commercial Real Estate: The Role of Operational Performance
 
Exploring Multimodal Embeddings with Milvus
Exploring Multimodal Embeddings with MilvusExploring Multimodal Embeddings with Milvus
Exploring Multimodal Embeddings with Milvus
 
Modular Monolith - a Practical Alternative to Microservices @ Devoxx UK 2024
Modular Monolith - a Practical Alternative to Microservices @ Devoxx UK 2024Modular Monolith - a Practical Alternative to Microservices @ Devoxx UK 2024
Modular Monolith - a Practical Alternative to Microservices @ Devoxx UK 2024
 
WSO2's API Vision: Unifying Control, Empowering Developers
WSO2's API Vision: Unifying Control, Empowering DevelopersWSO2's API Vision: Unifying Control, Empowering Developers
WSO2's API Vision: Unifying Control, Empowering Developers
 
Repurposing LNG terminals for Hydrogen Ammonia: Feasibility and Cost Saving
Repurposing LNG terminals for Hydrogen Ammonia: Feasibility and Cost SavingRepurposing LNG terminals for Hydrogen Ammonia: Feasibility and Cost Saving
Repurposing LNG terminals for Hydrogen Ammonia: Feasibility and Cost Saving
 
Six Myths about Ontologies: The Basics of Formal Ontology
Six Myths about Ontologies: The Basics of Formal OntologySix Myths about Ontologies: The Basics of Formal Ontology
Six Myths about Ontologies: The Basics of Formal Ontology
 
JohnPollard-hybrid-app-RailsConf2024.pptx
JohnPollard-hybrid-app-RailsConf2024.pptxJohnPollard-hybrid-app-RailsConf2024.pptx
JohnPollard-hybrid-app-RailsConf2024.pptx
 
Why Teams call analytics are critical to your entire business
Why Teams call analytics are critical to your entire businessWhy Teams call analytics are critical to your entire business
Why Teams call analytics are critical to your entire business
 
Corporate and higher education May webinar.pptx
Corporate and higher education May webinar.pptxCorporate and higher education May webinar.pptx
Corporate and higher education May webinar.pptx
 
Elevate Developer Efficiency & build GenAI Application with Amazon Q​
Elevate Developer Efficiency & build GenAI Application with Amazon Q​Elevate Developer Efficiency & build GenAI Application with Amazon Q​
Elevate Developer Efficiency & build GenAI Application with Amazon Q​
 
AI+A11Y 11MAY2024 HYDERBAD GAAD 2024 - HelloA11Y (11 May 2024)
AI+A11Y 11MAY2024 HYDERBAD GAAD 2024 - HelloA11Y (11 May 2024)AI+A11Y 11MAY2024 HYDERBAD GAAD 2024 - HelloA11Y (11 May 2024)
AI+A11Y 11MAY2024 HYDERBAD GAAD 2024 - HelloA11Y (11 May 2024)
 
Quantum Leap in Next-Generation Computing
Quantum Leap in Next-Generation ComputingQuantum Leap in Next-Generation Computing
Quantum Leap in Next-Generation Computing
 
Vector Search -An Introduction in Oracle Database 23ai.pptx
Vector Search -An Introduction in Oracle Database 23ai.pptxVector Search -An Introduction in Oracle Database 23ai.pptx
Vector Search -An Introduction in Oracle Database 23ai.pptx
 
Connector Corner: Accelerate revenue generation using UiPath API-centric busi...
Connector Corner: Accelerate revenue generation using UiPath API-centric busi...Connector Corner: Accelerate revenue generation using UiPath API-centric busi...
Connector Corner: Accelerate revenue generation using UiPath API-centric busi...
 
AWS Community Day CPH - Three problems of Terraform
AWS Community Day CPH - Three problems of TerraformAWS Community Day CPH - Three problems of Terraform
AWS Community Day CPH - Three problems of Terraform
 
Rising Above_ Dubai Floods and the Fortitude of Dubai International Airport.pdf
Rising Above_ Dubai Floods and the Fortitude of Dubai International Airport.pdfRising Above_ Dubai Floods and the Fortitude of Dubai International Airport.pdf
Rising Above_ Dubai Floods and the Fortitude of Dubai International Airport.pdf
 
Cloud Frontiers: A Deep Dive into Serverless Spatial Data and FME
Cloud Frontiers:  A Deep Dive into Serverless Spatial Data and FMECloud Frontiers:  A Deep Dive into Serverless Spatial Data and FME
Cloud Frontiers: A Deep Dive into Serverless Spatial Data and FME
 

Teachcht

  • 1. Using Charts and Graphs in the Classroom Visual Effects and Data Interpretation
  • 2.
  • 3.
  • 4.
  • 5.
  • 6.
  • 7.
  • 8.
  • 9.
  • 10.
  • 11.
  • 12.
  • 13.
  • 14.
  • 15.
  • 16.
  • 17.
  • 18.
  • 19.
  • 20.
  • 21.
  • 22.
  • 23.
  • 24.
  • 25.