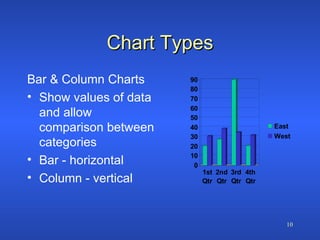
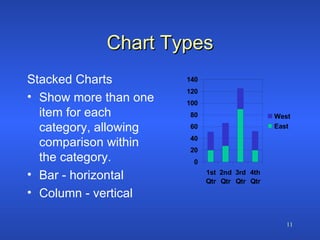
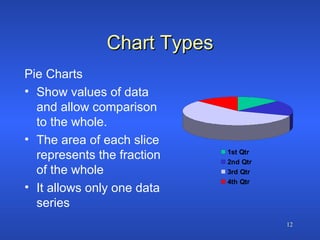
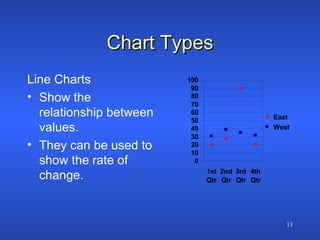
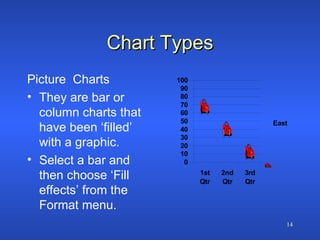
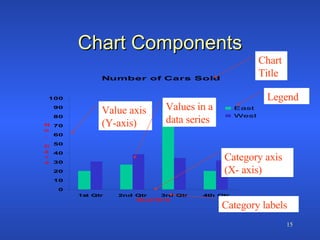
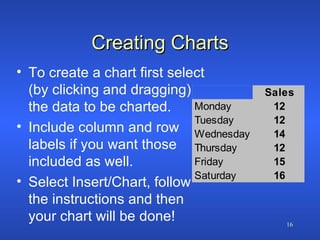
Introduction to Spreadsheets Fundamental Skills 2
Spreadsheet Presentation As a spreadsheet is used to present information, being able to present it WELL, is a skill in itself. Presentation can be enhanced by such things as setting text and cell attributes, use of borders and shading and setting printing options.
Text & Cell Attributes Be consistent with alignment in columns, particularly decimal points. Highlight totals or summary figures bold, coloured, shaded
Text & Cell Attributes Headings should be a consistent style The addition of graphics/charts can significantly improve a worksheet.
Text & Cell Attributes Use cell formatting techniques such as: merging cells,  wrapping text within a cell adjusting the vertical as well as the horizontal alignment of cells All of these options are available through the Format/Cells menu option.
Spreadsheet Printing Printing a worksheet properly can sometimes be a complex task. Some options that can solve these problems are: decreasing/increasing margins reducing/increasing column widths changing the layout from portrait to landscape.
Spreadsheet Printing Headers and/or footers should be added and page numbers MUST be included if more than one page is used. Where there is a large amount of information to be shown, then gridlines should also be printed. All of these options can be selected through the Page Setup menu choice.
Charts Charts are used to present information so that it can be quickly and easily understood.
Advantages of Charts Easier to identify trends. Easier to identify interrelationships in data. Chart is linked to the data so that changes to the data are shown immediately in the chart.
Chart Types Bar & Column Charts Show values of data and allow comparison between categories Bar - horizontal  Column - vertical
Chart Types Stacked Charts Show more than one item for each category, allowing comparison within the category. Bar - horizontal  Column - vertical
Chart Types Pie Charts Show values of data and allow comparison to the whole. The area of each slice represents the fraction of the whole It allows only one data series
Chart Types Line Charts Show the relationship between values. They can be used to show the rate of change.
Chart Types Picture  Charts They are bar or column charts that have been ‘filled’ with a graphic. Select a bar and then choose ‘Fill effects’ from the Format menu.
Chart Components Chart Title Category labels Legend Category axis (X- axis) Value axis (Y-axis) Values in a data series
Creating Charts To create a chart first select (by clicking and dragging) the data to be charted.  Include column and row labels if you want those included as well. Select Insert/Chart, follow the instructions and then your chart will be done!
Creating Charts Embedded charts are those that are included in the worksheet that contains the data, otherwise you can include it as a separate sheet.
Creating Charts Once the chart has been created it is possible to edit any part of the chart. Select the component that needs to be changed and choose the selected item from the Format menu or use the chart toolbar. The chart type can also be changed by selecting Chart Type from the Chart menu.
Printing Charts You can elect to print a chart as a separate sheet or as part of the worksheet containing the data. To print a chart as a separate sheet if it is  embedded, select the chart first and choose Print.

Spreadsheets 2

  • 1.
    Introduction to SpreadsheetsFundamental Skills 2
  • 2.
    Spreadsheet Presentation Asa spreadsheet is used to present information, being able to present it WELL, is a skill in itself. Presentation can be enhanced by such things as setting text and cell attributes, use of borders and shading and setting printing options.
  • 3.
    Text & CellAttributes Be consistent with alignment in columns, particularly decimal points. Highlight totals or summary figures bold, coloured, shaded
  • 4.
    Text & CellAttributes Headings should be a consistent style The addition of graphics/charts can significantly improve a worksheet.
  • 5.
    Text & CellAttributes Use cell formatting techniques such as: merging cells, wrapping text within a cell adjusting the vertical as well as the horizontal alignment of cells All of these options are available through the Format/Cells menu option.
  • 6.
    Spreadsheet Printing Printinga worksheet properly can sometimes be a complex task. Some options that can solve these problems are: decreasing/increasing margins reducing/increasing column widths changing the layout from portrait to landscape.
  • 7.
    Spreadsheet Printing Headersand/or footers should be added and page numbers MUST be included if more than one page is used. Where there is a large amount of information to be shown, then gridlines should also be printed. All of these options can be selected through the Page Setup menu choice.
  • 8.
    Charts Charts areused to present information so that it can be quickly and easily understood.
  • 9.
    Advantages of ChartsEasier to identify trends. Easier to identify interrelationships in data. Chart is linked to the data so that changes to the data are shown immediately in the chart.
  • 10.
    Chart Types Bar& Column Charts Show values of data and allow comparison between categories Bar - horizontal Column - vertical
  • 11.
    Chart Types StackedCharts Show more than one item for each category, allowing comparison within the category. Bar - horizontal Column - vertical
  • 12.
    Chart Types PieCharts Show values of data and allow comparison to the whole. The area of each slice represents the fraction of the whole It allows only one data series
  • 13.
    Chart Types LineCharts Show the relationship between values. They can be used to show the rate of change.
  • 14.
    Chart Types Picture Charts They are bar or column charts that have been ‘filled’ with a graphic. Select a bar and then choose ‘Fill effects’ from the Format menu.
  • 15.
    Chart Components ChartTitle Category labels Legend Category axis (X- axis) Value axis (Y-axis) Values in a data series
  • 16.
    Creating Charts Tocreate a chart first select (by clicking and dragging) the data to be charted. Include column and row labels if you want those included as well. Select Insert/Chart, follow the instructions and then your chart will be done!
  • 17.
    Creating Charts Embeddedcharts are those that are included in the worksheet that contains the data, otherwise you can include it as a separate sheet.
  • 18.
    Creating Charts Oncethe chart has been created it is possible to edit any part of the chart. Select the component that needs to be changed and choose the selected item from the Format menu or use the chart toolbar. The chart type can also be changed by selecting Chart Type from the Chart menu.
  • 19.
    Printing Charts Youcan elect to print a chart as a separate sheet or as part of the worksheet containing the data. To print a chart as a separate sheet if it is embedded, select the chart first and choose Print.