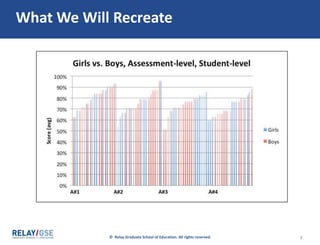
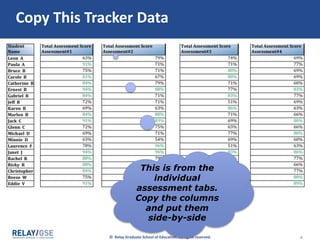
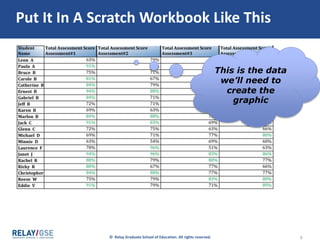
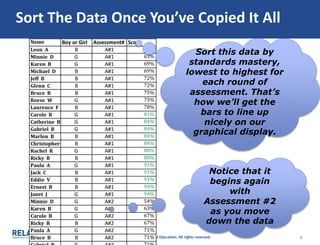
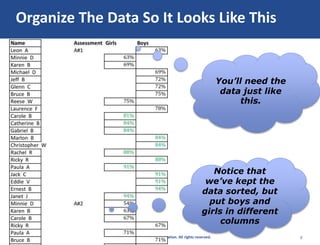
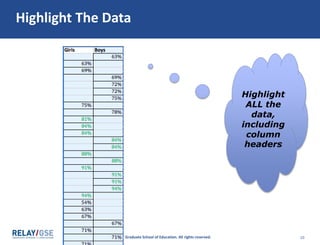
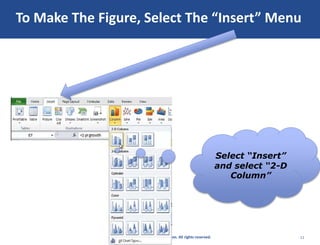
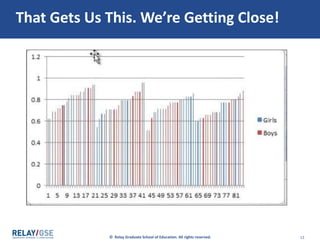
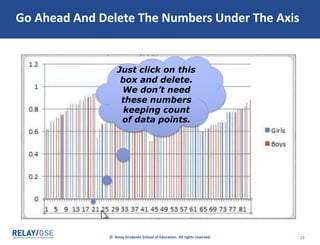
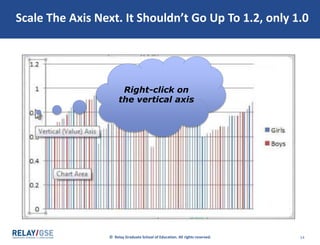
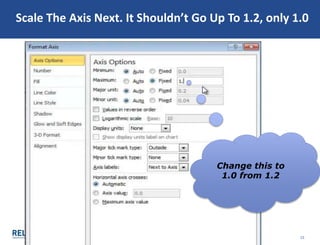
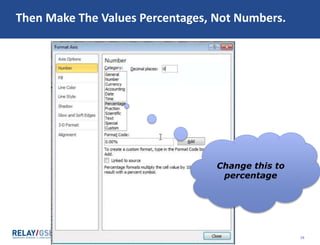
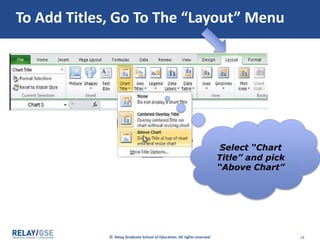
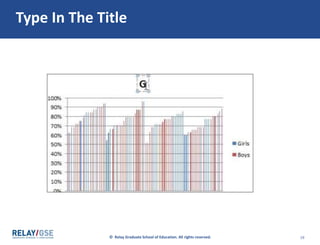
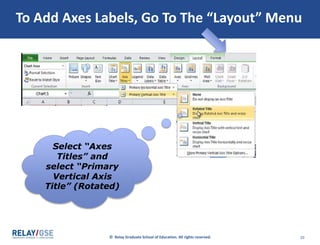
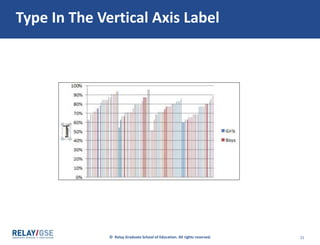
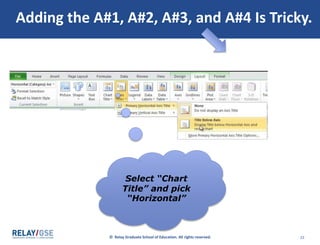
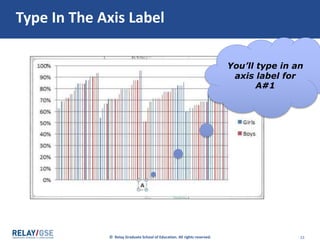
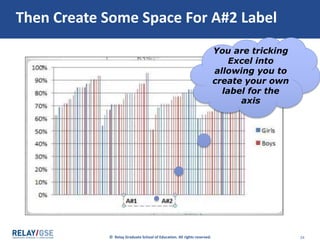
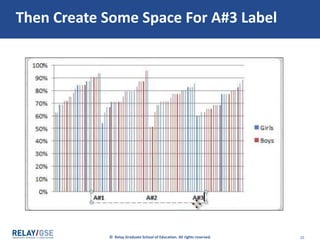
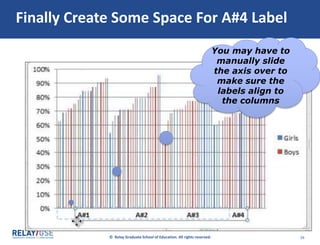
The document provides step-by-step instructions for creating a column graph in Excel to display student assessment data. It involves copying assessment data from individual student tabs into a scratch workbook, sorting the data, organizing it into columns for boys and girls, highlighting the data and selecting "Insert" then "2-D Column" to generate a column graph. Additional steps include deleting axis numbers, scaling the vertical axis to 1.0, labeling the values as percentages, and adding titles and labels to make the graph accessible.


![Data driven ppt_presentation[1]](https://cdn.slidesharecdn.com/ss_thumbnails/datadrivenpptpresentation1-100710102551-phpapp02-thumbnail.jpg?width=640&height=640&fit=bounds)


