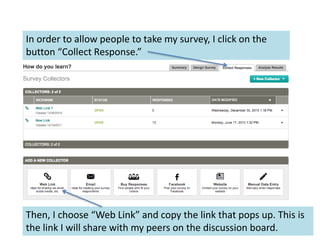
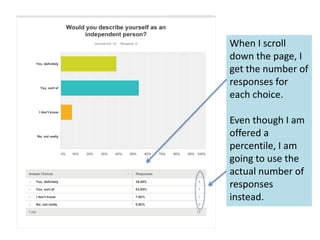
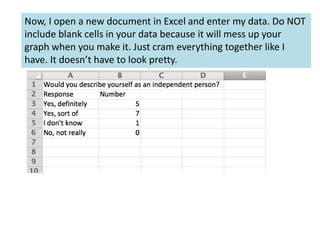
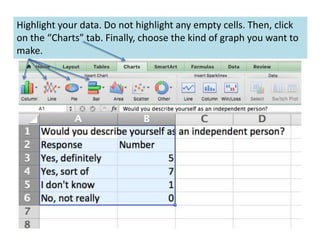
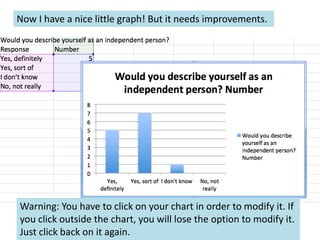
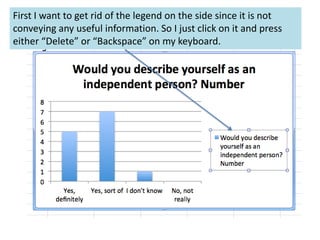
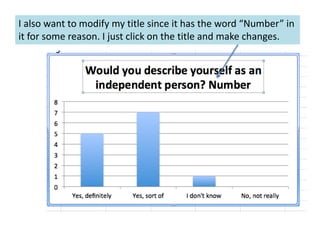
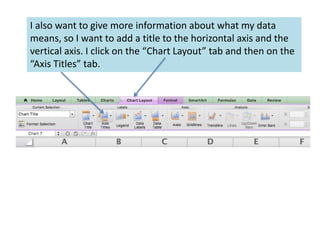
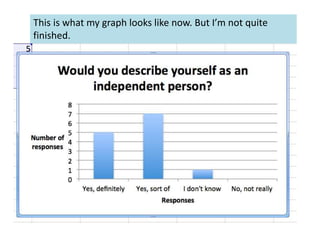
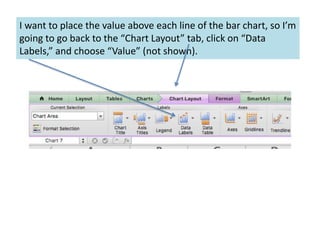
Withdrawal of Legal Tender Character of the old Bank Notes in the denominations of ₹ 500/- and ₹ 1000/-
Why is this scheme introduced?
The incidence of fake Indian currency notes in higher denomination has increased. For ordinary persons, the fake notes look similar to genuine notes, even though no security feature has been copied. The fake notes are used for antinational and illegal activities. High denomination notes have been misused by terrorists and for hoarding black money. India remains a cash based economy hence the circulation of Fake Indian Currency Notes continues to be a menace. In order to contain the rising incidence of fake notes and black money, the scheme to withdraw has been introduced.
What is this scheme?
The legal tender character of the existing bank notes in denominations of ₹ 500 and ₹ 1000 issued by the Reserve bank of India till November 8, 2016 (hereinafter referred to as Specified Bank Notes) stands withdrawn. In consequence thereof these Bank Notes cannot be used for transacting business and/or store of value for future usage. The Specified Bank Notes can be exchanged for value at any of the 19 offices of the Reserve Bank of India and deposited at any of the bank branches of commercial banks/ Regional Rural Banks/ Co-operative banks (only Urban Co-operative Banks and State Co-operative Banks) or at any Head Post Office or Sub-Post Office.
District Central Cooperative Banks (DCCBs) can allow their existing customers to withdraw money from their accounts upto ₹ 24,000 per week. No exchange facility against the specified bank notes (₹ 500 and ₹ 1000) or deposit of such notes should be entertained by DCCB’s. The Reserve Bank has accordingly advised all banks to permit withdrawal of cash by DCCBs from their accounts based on need.
Nơi nghĩ dưỡng và tận hưởng cuộc sống an lành cùng với biển. Khu biệt thự biển - Orchard villas resort - Phan Thiết mang đến cho Quý Khách cuộc mới. Liên hệ HOTLINE CĐT 0909 009 304 để biết thêm chi tiết
Website: http://www.orchardvillasresort.com/
My name is Chan Pichada, I'm study at Zaman University. Here is the link to my University website CS101 Assignment: <a> Zaman University Phnom Penh Cambodia </a>
Make a floating column chart in excel. Includes four fun examples of floating column charts. Also a neat tip on adding a degree notation format to your data in excel.
Needs some basic knowledge of making charts in excel, or refer my previous tutorial. for beginners.
Level - Medium. 2nd in a series on Column Charts, 4th in my series on Charts.
Office 365 Productivity Tips -- Mayhem in MinneapolisChristian Buckley
Tom Duff (@duffbert) and Christian Buckley (@buckleyplanet) are back with another head-to-head battle of the Microsoft Office and Office 365 productivity hints and tips, delivered to a live audience at SharePoint Saturday Twin Cities, October 28th, 2017 with audience voting. Follow us on Twitter for future webinars and sessions where we'll share more great tips!
In this latest installment, Tom Duff (@duffbert) and Christian Buckley (@buckleyplanet) return with another head-to-head battle of the Microsoft Office and Office 365 productivity hints and tips, delivered at SharePoint Saturday Twin Cities in October 2017 with audience members voting on each round. Follow us on Twitter for future webinars and sessions where we'll share more great tips!
This presentation shows you a few different ideas on how to bring your presentations up a notch by presenting data in a more creative way. We'll show you exactly how to recreate each design. Don't forget to check out the helpful resources at the end of the deck.
This presentation was created 100% in PowerPoint. View more presentation and production ideas on our blog: https://www.macroproductions.net/blog/
Why you should do your works cited page as you research, how to do in-text citations, how to created works cited entries, how to format the works cited page--updated for MLA edition 8
Biological screening of herbal drugs: Introduction and Need for
Phyto-Pharmacological Screening, New Strategies for evaluating
Natural Products, In vitro evaluation techniques for Antioxidants, Antimicrobial and Anticancer drugs. In vivo evaluation techniques
for Anti-inflammatory, Antiulcer, Anticancer, Wound healing, Antidiabetic, Hepatoprotective, Cardio protective, Diuretics and
Antifertility, Toxicity studies as per OECD guidelines
How to Make a Field invisible in Odoo 17Celine George
It is possible to hide or invisible some fields in odoo. Commonly using “invisible” attribute in the field definition to invisible the fields. This slide will show how to make a field invisible in odoo 17.
Embracing GenAI - A Strategic ImperativePeter Windle
Artificial Intelligence (AI) technologies such as Generative AI, Image Generators and Large Language Models have had a dramatic impact on teaching, learning and assessment over the past 18 months. The most immediate threat AI posed was to Academic Integrity with Higher Education Institutes (HEIs) focusing their efforts on combating the use of GenAI in assessment. Guidelines were developed for staff and students, policies put in place too. Innovative educators have forged paths in the use of Generative AI for teaching, learning and assessments leading to pockets of transformation springing up across HEIs, often with little or no top-down guidance, support or direction.
This Gasta posits a strategic approach to integrating AI into HEIs to prepare staff, students and the curriculum for an evolving world and workplace. We will highlight the advantages of working with these technologies beyond the realm of teaching, learning and assessment by considering prompt engineering skills, industry impact, curriculum changes, and the need for staff upskilling. In contrast, not engaging strategically with Generative AI poses risks, including falling behind peers, missed opportunities and failing to ensure our graduates remain employable. The rapid evolution of AI technologies necessitates a proactive and strategic approach if we are to remain relevant.
The French Revolution, which began in 1789, was a period of radical social and political upheaval in France. It marked the decline of absolute monarchies, the rise of secular and democratic republics, and the eventual rise of Napoleon Bonaparte. This revolutionary period is crucial in understanding the transition from feudalism to modernity in Europe.
For more information, visit-www.vavaclasses.com
Read| The latest issue of The Challenger is here! We are thrilled to announce that our school paper has qualified for the NATIONAL SCHOOLS PRESS CONFERENCE (NSPC) 2024. Thank you for your unwavering support and trust. Dive into the stories that made us stand out!
Operation “Blue Star” is the only event in the history of Independent India where the state went into war with its own people. Even after about 40 years it is not clear if it was culmination of states anger over people of the region, a political game of power or start of dictatorial chapter in the democratic setup.
The people of Punjab felt alienated from main stream due to denial of their just demands during a long democratic struggle since independence. As it happen all over the word, it led to militant struggle with great loss of lives of military, police and civilian personnel. Killing of Indira Gandhi and massacre of innocent Sikhs in Delhi and other India cities was also associated with this movement.
1. In this video, you will learn to
• Gather data from
surveymonkey.com
• Create a graph in Microsoft Excel
• Paste your graph into Microsoft
Word
Feel free to pause, rewind, or rewatch this video.
2. I’ve created my survey and am still on the “Design Survey” tab.
3. In order to allow people to take my survey, I click on the
button “Collect Response.”
Then, I choose “Web Link” and copy the link that pops up. This is
the link I will share with my peers on the discussion board.
4. Once I’ve collected responses from my audience (my peers), I can
look at the results by clicking on the “Analyze Results” tab.
Then, I get a really cool graph, but unfortunately, I can’t copy and
paste it. So I’ll have to make my own.
5. When I scroll
down the page, I
get the number of
responses for
each choice.
Even though I am
offered a
percentile, I am
going to use the
actual number of
responses
instead.
6. Now, I open a new document in Excel and enter my data. Do NOT
include blank cells in your data because it will mess up your
graph when you make it. Just cram everything together like I
have. It doesn’t have to look pretty.
7. Highlight your data. Do not highlight any empty cells. Then, click
on the “Charts” tab. Finally, choose the kind of graph you want to
make.
8. I have chosen a
column chart,
more
specifically the
“Clustered
Column” chart.
9. Now I have a nice little graph! But it needs improvements.
Warning: You have to click on your chart in order to modify it. If
you click outside the chart, you will lose the option to modify it.
Just click back on it again.
10. First I want to get rid of the legend on the side since it is not
conveying any useful information. So I just click on it and press
either “Delete” or “Backspace” on my keyboard.
11. I also want to modify my title since it has the word “Number” in
it for some reason. I just click on the title and make changes.
12. I also want to give more information about what my data
means, so I want to add a title to the horizontal axis and the
vertical axis. I click on the “Chart Layout” tab and then on the
“Axis Titles” tab.
13. Now I can give my graph a horizontal title…
…and a vertical title.
14. This is what my graph looks like now. But I’m not quite
finished.
15. I want to place the value above each line of the bar chart, so I’m
going to go back to the “Chart Layout” tab, click on “Data
Labels,” and choose “Value” (not shown).
16. Now I have a gorgeous chart to put in my paper!
17. Adding my chart to my paper is very easy. I just click on the
chart and then copy it.
18. Then, I open a new Word document and paste it in.
20. To make your graph easier to move around, click on the graph itself.
Then, choose the “Format” tab that pops up, “Wrap Text,” and “Top
and Bottom” (not shown).
21. That’s the end of this tutorial. I hope you
found it helpful.