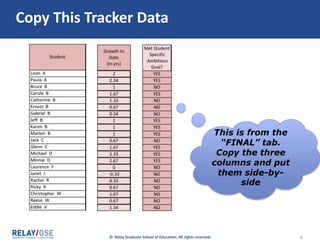
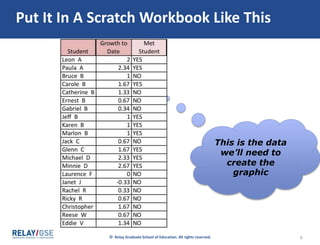
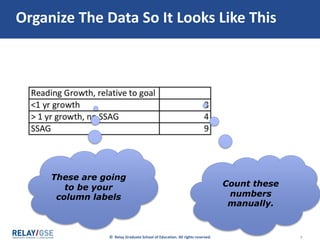
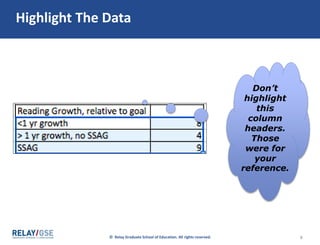
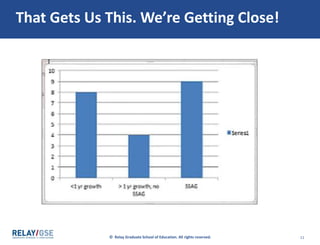
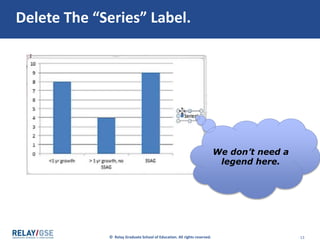
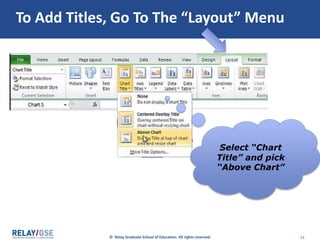
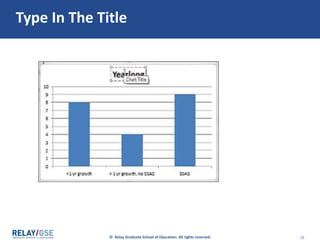
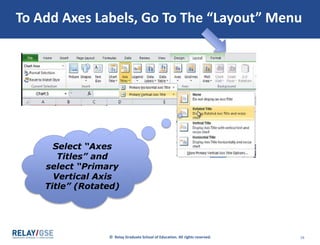
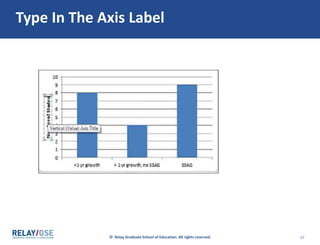
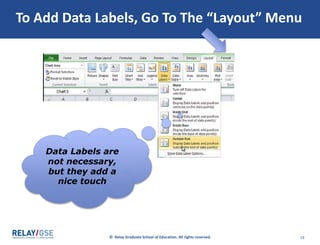
The document provides step-by-step instructions for recreating a column chart in Excel using tracker data. It describes copying the needed data into a new workbook, organizing the data with column labels, selecting "Insert > Column > 2-D Column" to generate the initial chart, and then customizing the chart by adding a title, axis labels, and data labels. The overall process takes the reader through setting up, generating, and formatting the column chart to display the selected tracker data.