This document provides instructions for converting contour data from GIS format to CAD format for use in 3D modeling. It involves checking that ArcGIS ArcInfo software is being used, verifying there is a field named "elevation" in the GIS data, and ensuring the data is in a supported projection before using the ArcToolbox Conversion Tool to export the data to DWG or DXF format.
A great experience you've made with my colleague Ashraf, we have taken the design of a map using satellite imagery by Google Earth, the design was by ArcGIS software, in addition to other programs.
Objective To develop maps designed using different programs that allow for the manufacture of a new and modern designs
In this presentation, we will see How to make Gantt chart in excel. Gantt chart is a wonderful way of planning and tracking activities in Project Management.
For Video Tutorial: https://youtu.be/haXPykHchaY
For Tutorial:
http://www.edtechnology.in/software-engineering/what-is-gantt-chart-how-to-make-gantt-chart-in-excel/
A description of some of the water and storm modeling tools in Civil 3D. This was a specialized presentation, so the slide background was scrubbed out and a standard design used in its place.
By EKALYSIS energy analysis is very easy. EVL-3 stores energy data on SD Card and disk capture save it to computer or laptop.
EKalysis helps to analyse this data by presenting it in Tabular and graphical format.
It also shows events information.
Reports are generated for every date you selected.
You can also save all Tabular data in csv and graph data in image file.
It is useful for analyzing energy of plant,industry, home.
It is also used for testing of load and power of various machines.
UPS,Servo Stabilizer, inverter, heavy machines are also some example which power can be tested by this software.
It is not only energy or power logger, its the step to know energy.
Development of a biomechanical analysis process for use within a sports club Joe Handsaker
I display work I have been conducting over the past three years to make biomechanical analysis a useful, practical tool within a sports club. I outline my methods and give examples of how these techniques could be used to improve performance and reduce the potential for injury in sports club, with the example of a football club.
MBA 620 Module Five Power BI Executive Summary AssignmentAbramMartino96
MBA 620 Module Five
Power BI Executive Summary Assignment User Manual
MBA 620 Module Five .............................................................................................................................1
Power BI Executive Summary Assignment User Manual ........................................................................1
Introduction .........................................................................................................................................1
Accessing Power BI via the Virtual Desktop Infrastructure (VDI) .......................................................1
Cleaning the CSV File ...........................................................................................................................2
Importing Files to Power BI .................................................................................................................4
Working on the Module Five Visualization of Financial Performance Assignment ............................8
Creating Clustered Column Charts 8
Creating a Line Chart ........................................................................................................................ 14
Exporting Files From Power BI ......................................................................................................... 18
Uploading Image Files to OneDrive .................................................................................................. 20
Introduction
Power BI is a tool that enables its users to visualize and present data in a manner that is easy to
understand and analyze.
Accessing Power BI via the Virtual Desktop Infrastructure (VDI)
1. Open the virtual desktop interface (VDI) on your machine.
2
2. On the VDI home screen, select Power BI Desktop. The Power BI homepage is displayed.
Cleaning the CSV File
We should clean the CSV file before we import it into Power BI. For example, to plot charts as per
the prompt in the assignment guidelines, we will use data from the Balance Sheets section of the
CSV file. The other data sections, such as Income Statement, Cash Flow Statement, and Supporting
Schedules, are not required. Therefore, we can remove them and conduct the analysis.
To clean the data set file, locate MBA620_Module five_Assignment two_Company A Financial.
1. On the VDI home screen, open the Business Analytics Course Content folder.
3
2. Open the MBA620_Module five_Assignment two_Company A Financial CSV file.
3. In the file, we can remove following data to clean the CSV file for creating the specific chart
in the assignment:
• Remove columns A, C, and D, as they are empty and not required in analysis.
• Remove rows 1, 2, 3, and 4, as that data is not required to plot the charts in Power
BI.
• In section 1 of the prompt, in guiding question 1, you are asked to analyze the data
in the balance sheet section of the CSV file, which is starting ...
Memorandum
Design4Practice (D4P) Program
To: EGR 186 Students
From: Dr. Ostroha
Date: March 23, 2015
Re: Using Excel – Airplane Cargo Drop
This assignment is due at the beginning of next class. Excel is available in many computer labs across campus.
Using formulas, absolute addresses, and x-y plot:
Supplies are dropped from an airplane to land at a certain point. The velocity of the package at release from the airplane is the speed of the airplane, v0x=200ft/s. The acceleration of the package due to gravity is ay = -32.2 ft/s2. The displacement in the y direction can be found using the following equation: y - y0 = v0yt + ½ayt2. The final position of the package (y) is on the ground, and y0 represents the height of the plane when the package is dropped. The initial velocity in the y direction (v0y) is zero. Therefore the equation becomes: y = y0 + ½ayt2.
The distance the package travels in the x direction can be found from the equation: x - x0 = v0xt + ½axt2. The final position of the package (x) is measured from the initial position (x0). If x0 is taken as zero, and if the plane is traveling at a constant speed (ax is zero), then the equation becomes: x = v0xt.
Solve this problem using Excel (it may help to print this page and cross off the directions as you complete them).
1. Create a table for the initial data:
i. In cell B2 put the label “Plane height:”
ii. In cell C2 put the initial height of the plane in feet (ft): 300
iii. In cell B3 put the label “Acceleration (g):”
iv. In cell C3 put the acceleration of gravity in ft/s^2: -32.2
v. In cell B4 put the label “Velocity:”
vi. In cell C4 put the velocity in ft/s: 200
vii. In cells D2, D3, and D4, place the appropriate units
2. Create a table for the data and calculations:
i. In cells B6, C6, and D6 respectively, put the labels “t”, “x”, and “y”.
ii. In cell B7, enter the initial time: 0
iii. Increment the time in ½-second intervals in column B, from B8 to B16.
iv. Center all of the labels and data in columns B, C, and D.
v. Enter the formulas to calculate 1) x in cell C7 and 2) y in cell D7.
vi. Copy the formula from C7 to C8 through C16 and from D7 to D8 through D16.
vii. Format the numbers in the y column to one decimal point.
3. Create separate graphs of 1) “x vs. t” and of 2) “y vs. t”. Using the “x vs. t” graph as an example:
i. Select the x data (C7:C16), and then select the “line with markers” plot type.
ii. To add the time on the horizontal axis, right-click on the chart and chose “Select Data…”. In the “Select Data Source” dialog box, chose “edit” for the Horizontal (Category). In the next dialog box, simply select (drag the mouse over) the time data (B7:B16).
iii. Add major vertical gridlines, chart titles, and axis labels using the buttons under the “Layout” tab. Include the correct units in the axis titles and rotate the vertical axis title to the horizontal.
iv. Remove the “series” labels from these two charts (Layout/legend).
v. Repeat these steps for the “y vs ...
A geographic information system (GIS) is a collection of hardware,
software, geographicdata, and personnel designed to create, store, edit,
manipulate, analyze and display geographically referenced information.
This document contains a step by step guide to create a BI Solution with SQL Server 2008 R2, it was downloaded from
http://channel9.msdn.com/Learn/Courses/Office2010/BIApplicationsUnit/BIApplicationsLab
This document is part of the Developing BI Applications Course that is available at Channel9 from Microsoft
Regards,
Eduardo Castro
Microsoft SQL Server MVP
http://ecastrom.blogspot.com
How to Make a Field invisible in Odoo 17Celine George
It is possible to hide or invisible some fields in odoo. Commonly using “invisible” attribute in the field definition to invisible the fields. This slide will show how to make a field invisible in odoo 17.
Operation “Blue Star” is the only event in the history of Independent India where the state went into war with its own people. Even after about 40 years it is not clear if it was culmination of states anger over people of the region, a political game of power or start of dictatorial chapter in the democratic setup.
The people of Punjab felt alienated from main stream due to denial of their just demands during a long democratic struggle since independence. As it happen all over the word, it led to militant struggle with great loss of lives of military, police and civilian personnel. Killing of Indira Gandhi and massacre of innocent Sikhs in Delhi and other India cities was also associated with this movement.
Macroeconomics- Movie Location
This will be used as part of your Personal Professional Portfolio once graded.
Objective:
Prepare a presentation or a paper using research, basic comparative analysis, data organization and application of economic information. You will make an informed assessment of an economic climate outside of the United States to accomplish an entertainment industry objective.
The Roman Empire A Historical Colossus.pdfkaushalkr1407
The Roman Empire, a vast and enduring power, stands as one of history's most remarkable civilizations, leaving an indelible imprint on the world. It emerged from the Roman Republic, transitioning into an imperial powerhouse under the leadership of Augustus Caesar in 27 BCE. This transformation marked the beginning of an era defined by unprecedented territorial expansion, architectural marvels, and profound cultural influence.
The empire's roots lie in the city of Rome, founded, according to legend, by Romulus in 753 BCE. Over centuries, Rome evolved from a small settlement to a formidable republic, characterized by a complex political system with elected officials and checks on power. However, internal strife, class conflicts, and military ambitions paved the way for the end of the Republic. Julius Caesar’s dictatorship and subsequent assassination in 44 BCE created a power vacuum, leading to a civil war. Octavian, later Augustus, emerged victorious, heralding the Roman Empire’s birth.
Under Augustus, the empire experienced the Pax Romana, a 200-year period of relative peace and stability. Augustus reformed the military, established efficient administrative systems, and initiated grand construction projects. The empire's borders expanded, encompassing territories from Britain to Egypt and from Spain to the Euphrates. Roman legions, renowned for their discipline and engineering prowess, secured and maintained these vast territories, building roads, fortifications, and cities that facilitated control and integration.
The Roman Empire’s society was hierarchical, with a rigid class system. At the top were the patricians, wealthy elites who held significant political power. Below them were the plebeians, free citizens with limited political influence, and the vast numbers of slaves who formed the backbone of the economy. The family unit was central, governed by the paterfamilias, the male head who held absolute authority.
Culturally, the Romans were eclectic, absorbing and adapting elements from the civilizations they encountered, particularly the Greeks. Roman art, literature, and philosophy reflected this synthesis, creating a rich cultural tapestry. Latin, the Roman language, became the lingua franca of the Western world, influencing numerous modern languages.
Roman architecture and engineering achievements were monumental. They perfected the arch, vault, and dome, constructing enduring structures like the Colosseum, Pantheon, and aqueducts. These engineering marvels not only showcased Roman ingenuity but also served practical purposes, from public entertainment to water supply.
2024.06.01 Introducing a competency framework for languag learning materials ...Sandy Millin
http://sandymillin.wordpress.com/iateflwebinar2024
Published classroom materials form the basis of syllabuses, drive teacher professional development, and have a potentially huge influence on learners, teachers and education systems. All teachers also create their own materials, whether a few sentences on a blackboard, a highly-structured fully-realised online course, or anything in between. Despite this, the knowledge and skills needed to create effective language learning materials are rarely part of teacher training, and are mostly learnt by trial and error.
Knowledge and skills frameworks, generally called competency frameworks, for ELT teachers, trainers and managers have existed for a few years now. However, until I created one for my MA dissertation, there wasn’t one drawing together what we need to know and do to be able to effectively produce language learning materials.
This webinar will introduce you to my framework, highlighting the key competencies I identified from my research. It will also show how anybody involved in language teaching (any language, not just English!), teacher training, managing schools or developing language learning materials can benefit from using the framework.
Read| The latest issue of The Challenger is here! We are thrilled to announce that our school paper has qualified for the NATIONAL SCHOOLS PRESS CONFERENCE (NSPC) 2024. Thank you for your unwavering support and trust. Dive into the stories that made us stand out!
Honest Reviews of Tim Han LMA Course Program.pptxtimhan337
Personal development courses are widely available today, with each one promising life-changing outcomes. Tim Han’s Life Mastery Achievers (LMA) Course has drawn a lot of interest. In addition to offering my frank assessment of Success Insider’s LMA Course, this piece examines the course’s effects via a variety of Tim Han LMA course reviews and Success Insider comments.
June 3, 2024 Anti-Semitism Letter Sent to MIT President Kornbluth and MIT Cor...Levi Shapiro
Letter from the Congress of the United States regarding Anti-Semitism sent June 3rd to MIT President Sally Kornbluth, MIT Corp Chair, Mark Gorenberg
Dear Dr. Kornbluth and Mr. Gorenberg,
The US House of Representatives is deeply concerned by ongoing and pervasive acts of antisemitic
harassment and intimidation at the Massachusetts Institute of Technology (MIT). Failing to act decisively to ensure a safe learning environment for all students would be a grave dereliction of your responsibilities as President of MIT and Chair of the MIT Corporation.
This Congress will not stand idly by and allow an environment hostile to Jewish students to persist. The House believes that your institution is in violation of Title VI of the Civil Rights Act, and the inability or
unwillingness to rectify this violation through action requires accountability.
Postsecondary education is a unique opportunity for students to learn and have their ideas and beliefs challenged. However, universities receiving hundreds of millions of federal funds annually have denied
students that opportunity and have been hijacked to become venues for the promotion of terrorism, antisemitic harassment and intimidation, unlawful encampments, and in some cases, assaults and riots.
The House of Representatives will not countenance the use of federal funds to indoctrinate students into hateful, antisemitic, anti-American supporters of terrorism. Investigations into campus antisemitism by the Committee on Education and the Workforce and the Committee on Ways and Means have been expanded into a Congress-wide probe across all relevant jurisdictions to address this national crisis. The undersigned Committees will conduct oversight into the use of federal funds at MIT and its learning environment under authorities granted to each Committee.
• The Committee on Education and the Workforce has been investigating your institution since December 7, 2023. The Committee has broad jurisdiction over postsecondary education, including its compliance with Title VI of the Civil Rights Act, campus safety concerns over disruptions to the learning environment, and the awarding of federal student aid under the Higher Education Act.
• The Committee on Oversight and Accountability is investigating the sources of funding and other support flowing to groups espousing pro-Hamas propaganda and engaged in antisemitic harassment and intimidation of students. The Committee on Oversight and Accountability is the principal oversight committee of the US House of Representatives and has broad authority to investigate “any matter” at “any time” under House Rule X.
• The Committee on Ways and Means has been investigating several universities since November 15, 2023, when the Committee held a hearing entitled From Ivory Towers to Dark Corners: Investigating the Nexus Between Antisemitism, Tax-Exempt Universities, and Terror Financing. The Committee followed the hearing with letters to those institutions on January 10, 202
Thesis Statement for students diagnonsed withADHD.ppt
Converting gis contours_to_cad
1. GIS to CAD Conversion of Contour Data for Use in 3D
Modeling
1. Check the version of ArcGIS you are running.
To convert GIS data into CAD data you must be using ArcGIS ArcInfo software.
There are three different types of ArcGIS licenses: ArcInfo, ArcEditor and ArcView.
ArcInfo is the highest level of ArcGIS.
a. ArcGIS ArcInfo is only located in GIS Lab in Tisch Library
b. ArcGIS ArcEditor is in all other labs – One copy of ArcInfo will be
available in the CAD Lab in Anderson.
c. You can check the version of software you
are using in ArcMap or in ArcCatalog. To
check the version, go to the Main toolbar and
click on Help About ArcMap (or About
ArcCatalog). This window will popup and
tell you which version of ArcGIS software
you are currently using.
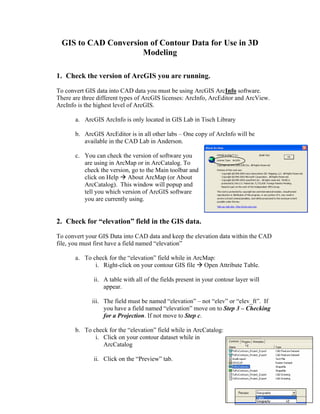
2. Check for “elevation” field in the GIS data.
To convert your GIS Data into CAD data and keep the elevation data within the CAD
file, you must first have a field named “elevation”
a. To check for the “elevation” field while in ArcMap:
i. Right-click on your contour GIS file Open Attribute Table.
ii. A table with all of the fields present in your contour layer will
appear.
iii. The field must be named “elevation” – not “elev” or “elev_ft”. If
you have a field named “elevation” move on to Step 3 – Checking
for a Projection. If not move to Step c.
b. To check for the “elevation” field while in ArcCatalog:
i. Click on your contour dataset while in
ArcCatalog
ii. Click on the “Preview” tab.
2. iii. Change the Preview from Geography to Table.
iv. The Attributes Table will now appear.
v. The field must be named “elevation” – not “elev” or “elev_ft”. If
you have a field named “elevation” move on to Step 3 – Checking
for a Projection. If not move to Step c.
c. To add a field to your GIS dataset:
i. Click on the Options button in the lower right-
hand corner of the Attributes Table.
ii. Go to Add Field
iii. The window to the right will appear. Fill in the
fields as shown and click OK.
iv. Find the existing elevation field in your dataset –
it is probably called something like “elev_ft” or
“elev”.
v. Right-click on the “elevation” field you just created and click on
Calculate Values. You will be asked if it is OK to calculate values
outside of an editing session. Click OK.
vi. The Field Calculator window will
appear. Under the Fields window, click
on the incorrectly named elevation field
(in the example to the right this field is
named “elev_ft”. This will set the
elevation data in the newly created
“elevation” field equal to the
information in the old “elev_ft” field.
vii. Click OK and your “elevation” field will
be populated with the elevation data.
3. Convert GIS files to CAD
• ArcToolbox Conversion Tool To CAD Export To CAD
• Output type DWG _R2000 or DXF_R2000
• Uncheck “Ignore Paths” and “Append to Existing files”
• Do not need seed file
• Must use ArcGIS ArcInfo for this step.