Downloaded 142 times
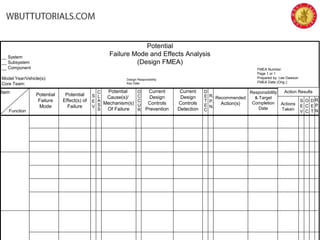
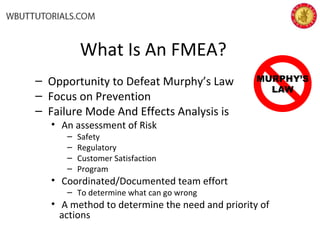
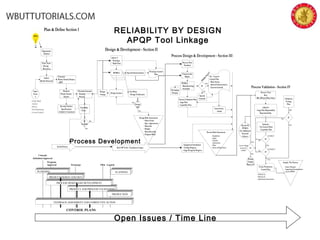
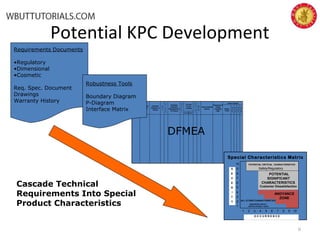
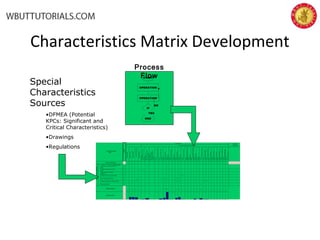
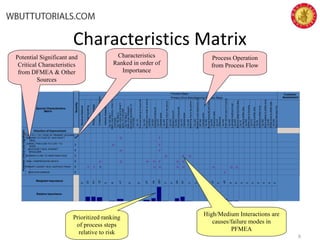
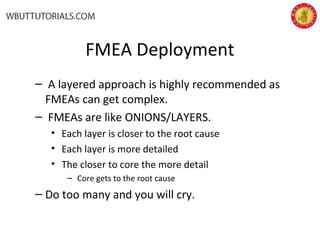
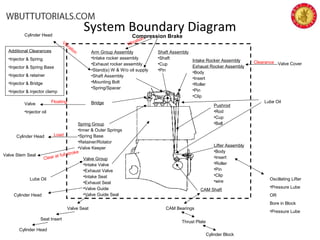
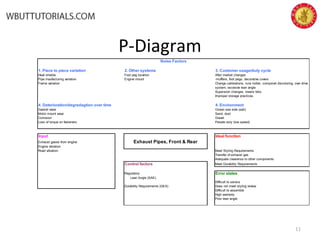
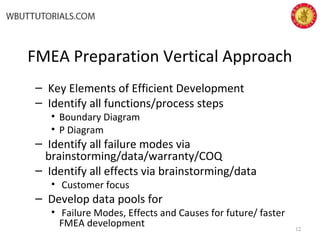
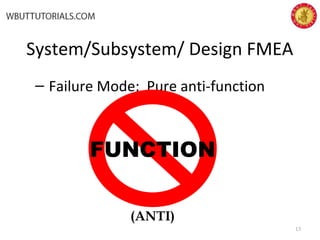
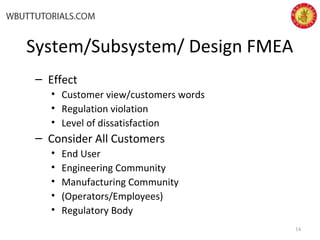
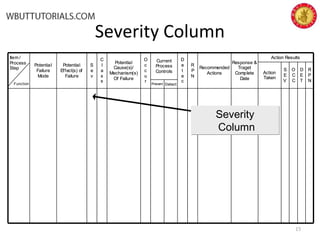
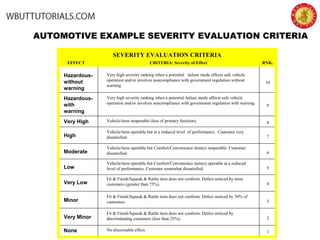
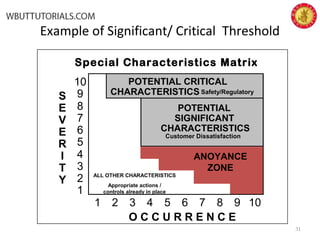
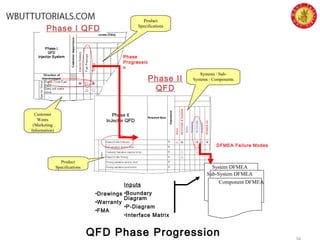
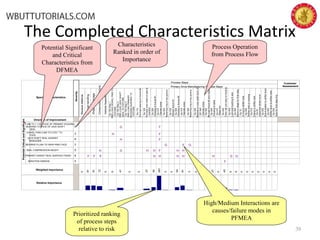
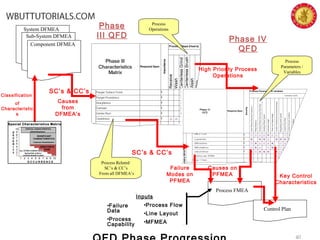


The document provides information on Failure Mode and Effects Analysis (FMEA). It begins with an overview of what an FMEA is and its purpose in identifying potential failures, effects, and causes. It then discusses how FMEAs fit within the product and process development process. The document provides examples of tools that can be used as part of an FMEA, such as boundary diagrams, P-diagrams, and a characteristics matrix. It also discusses approaches for effectively preparing and deploying FMEAs.