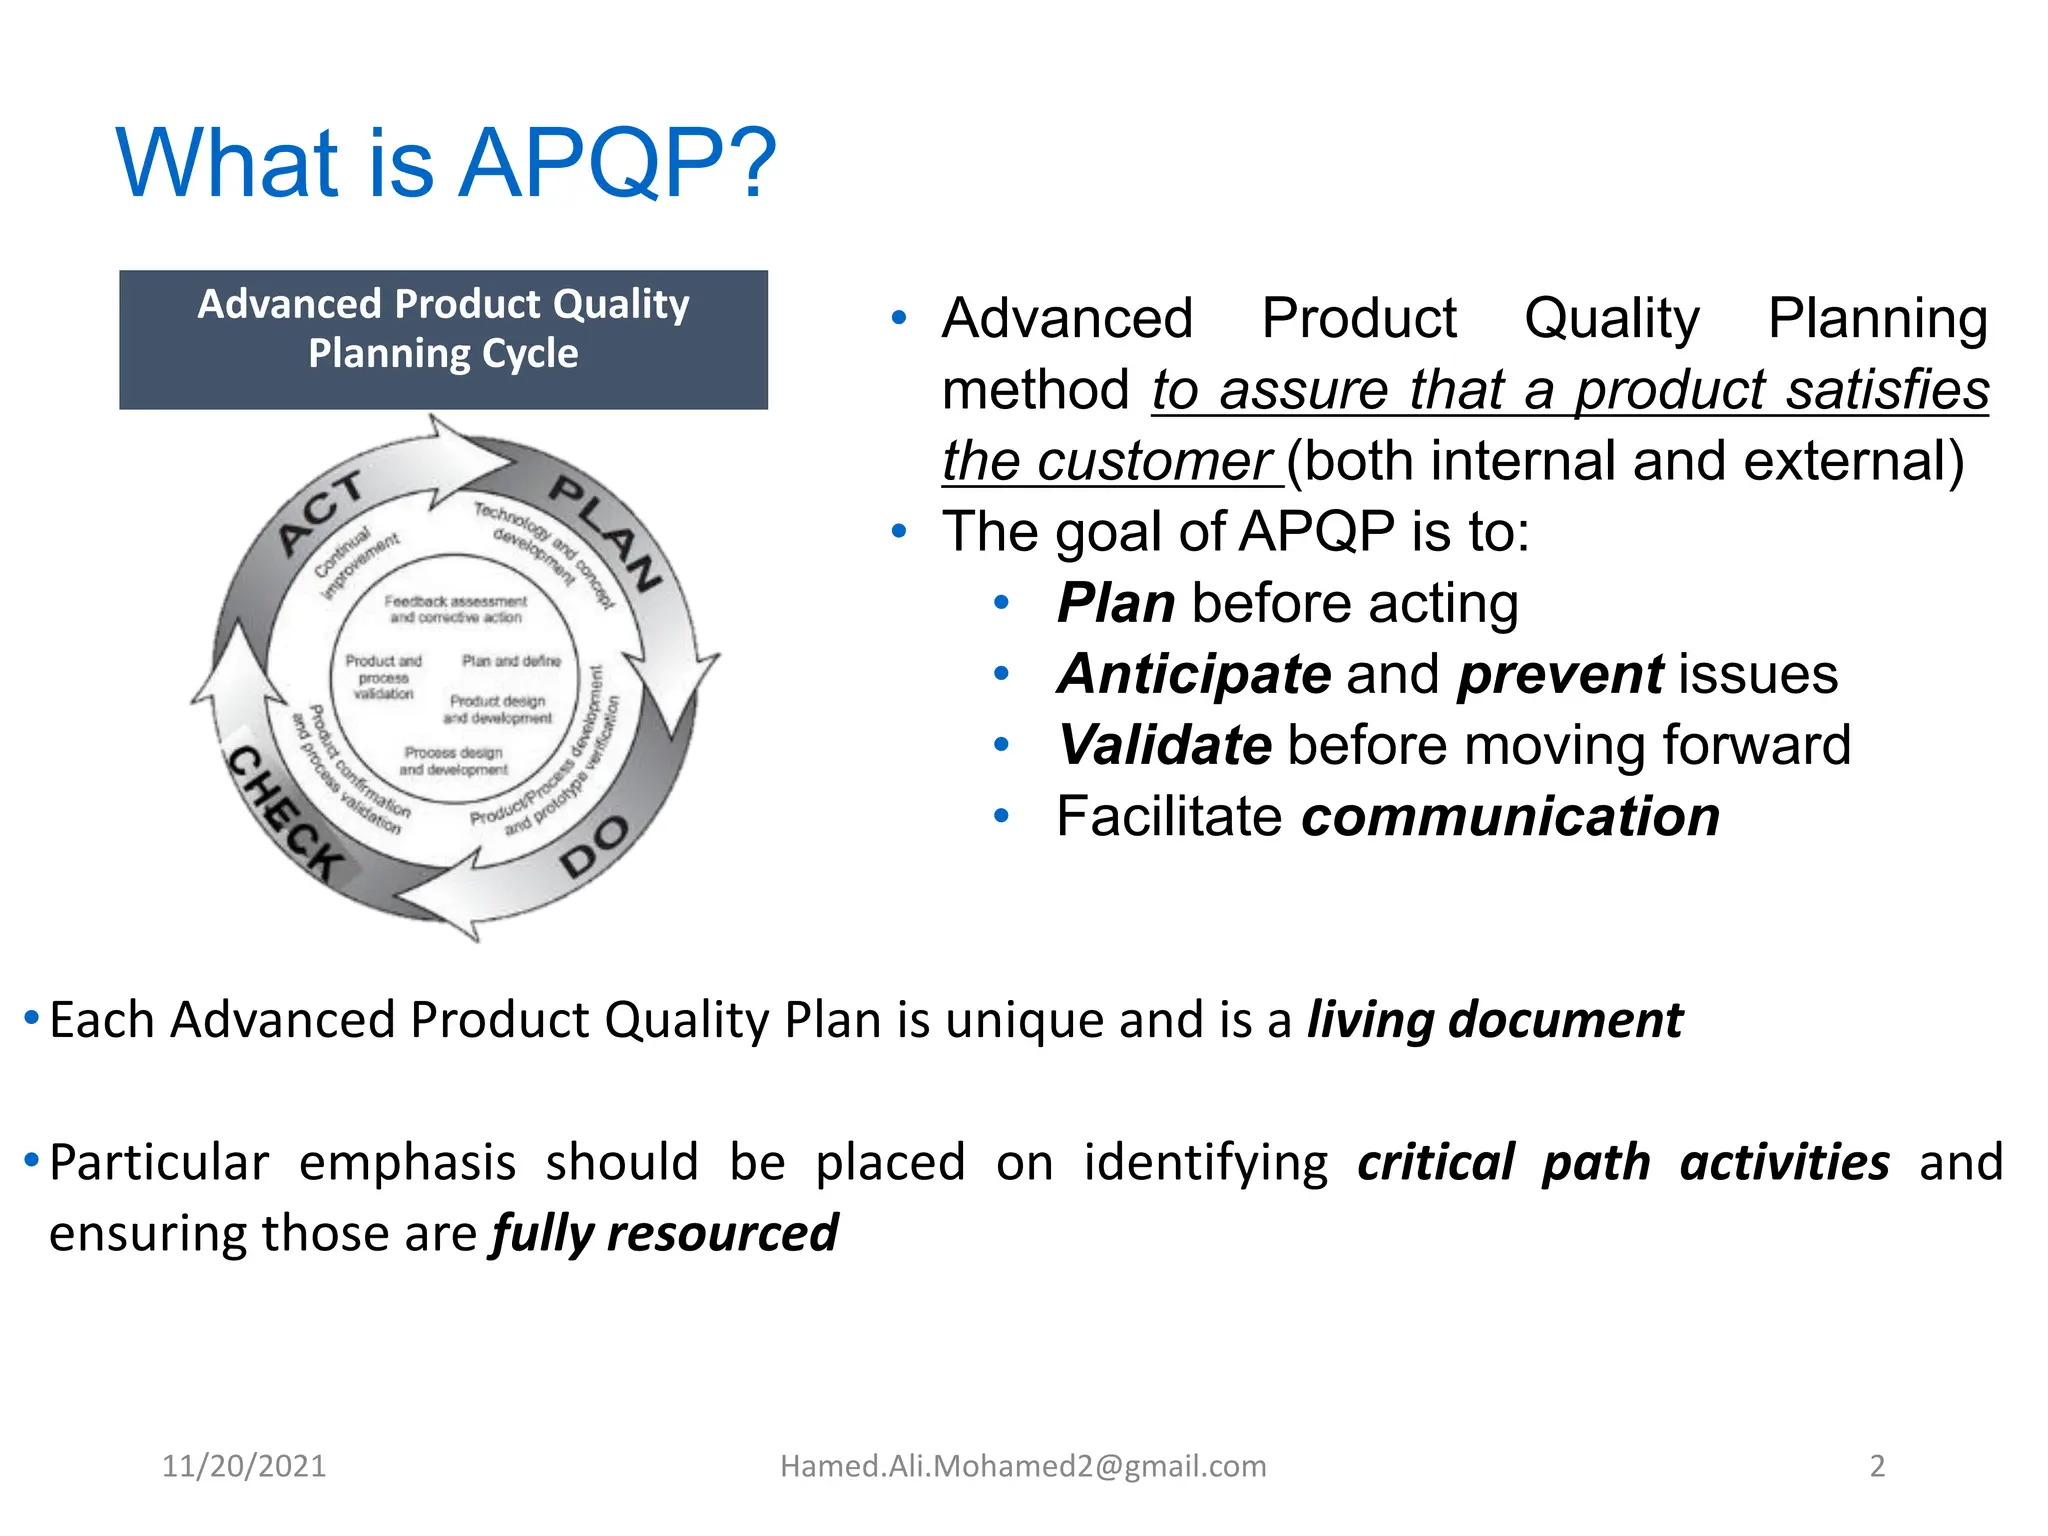
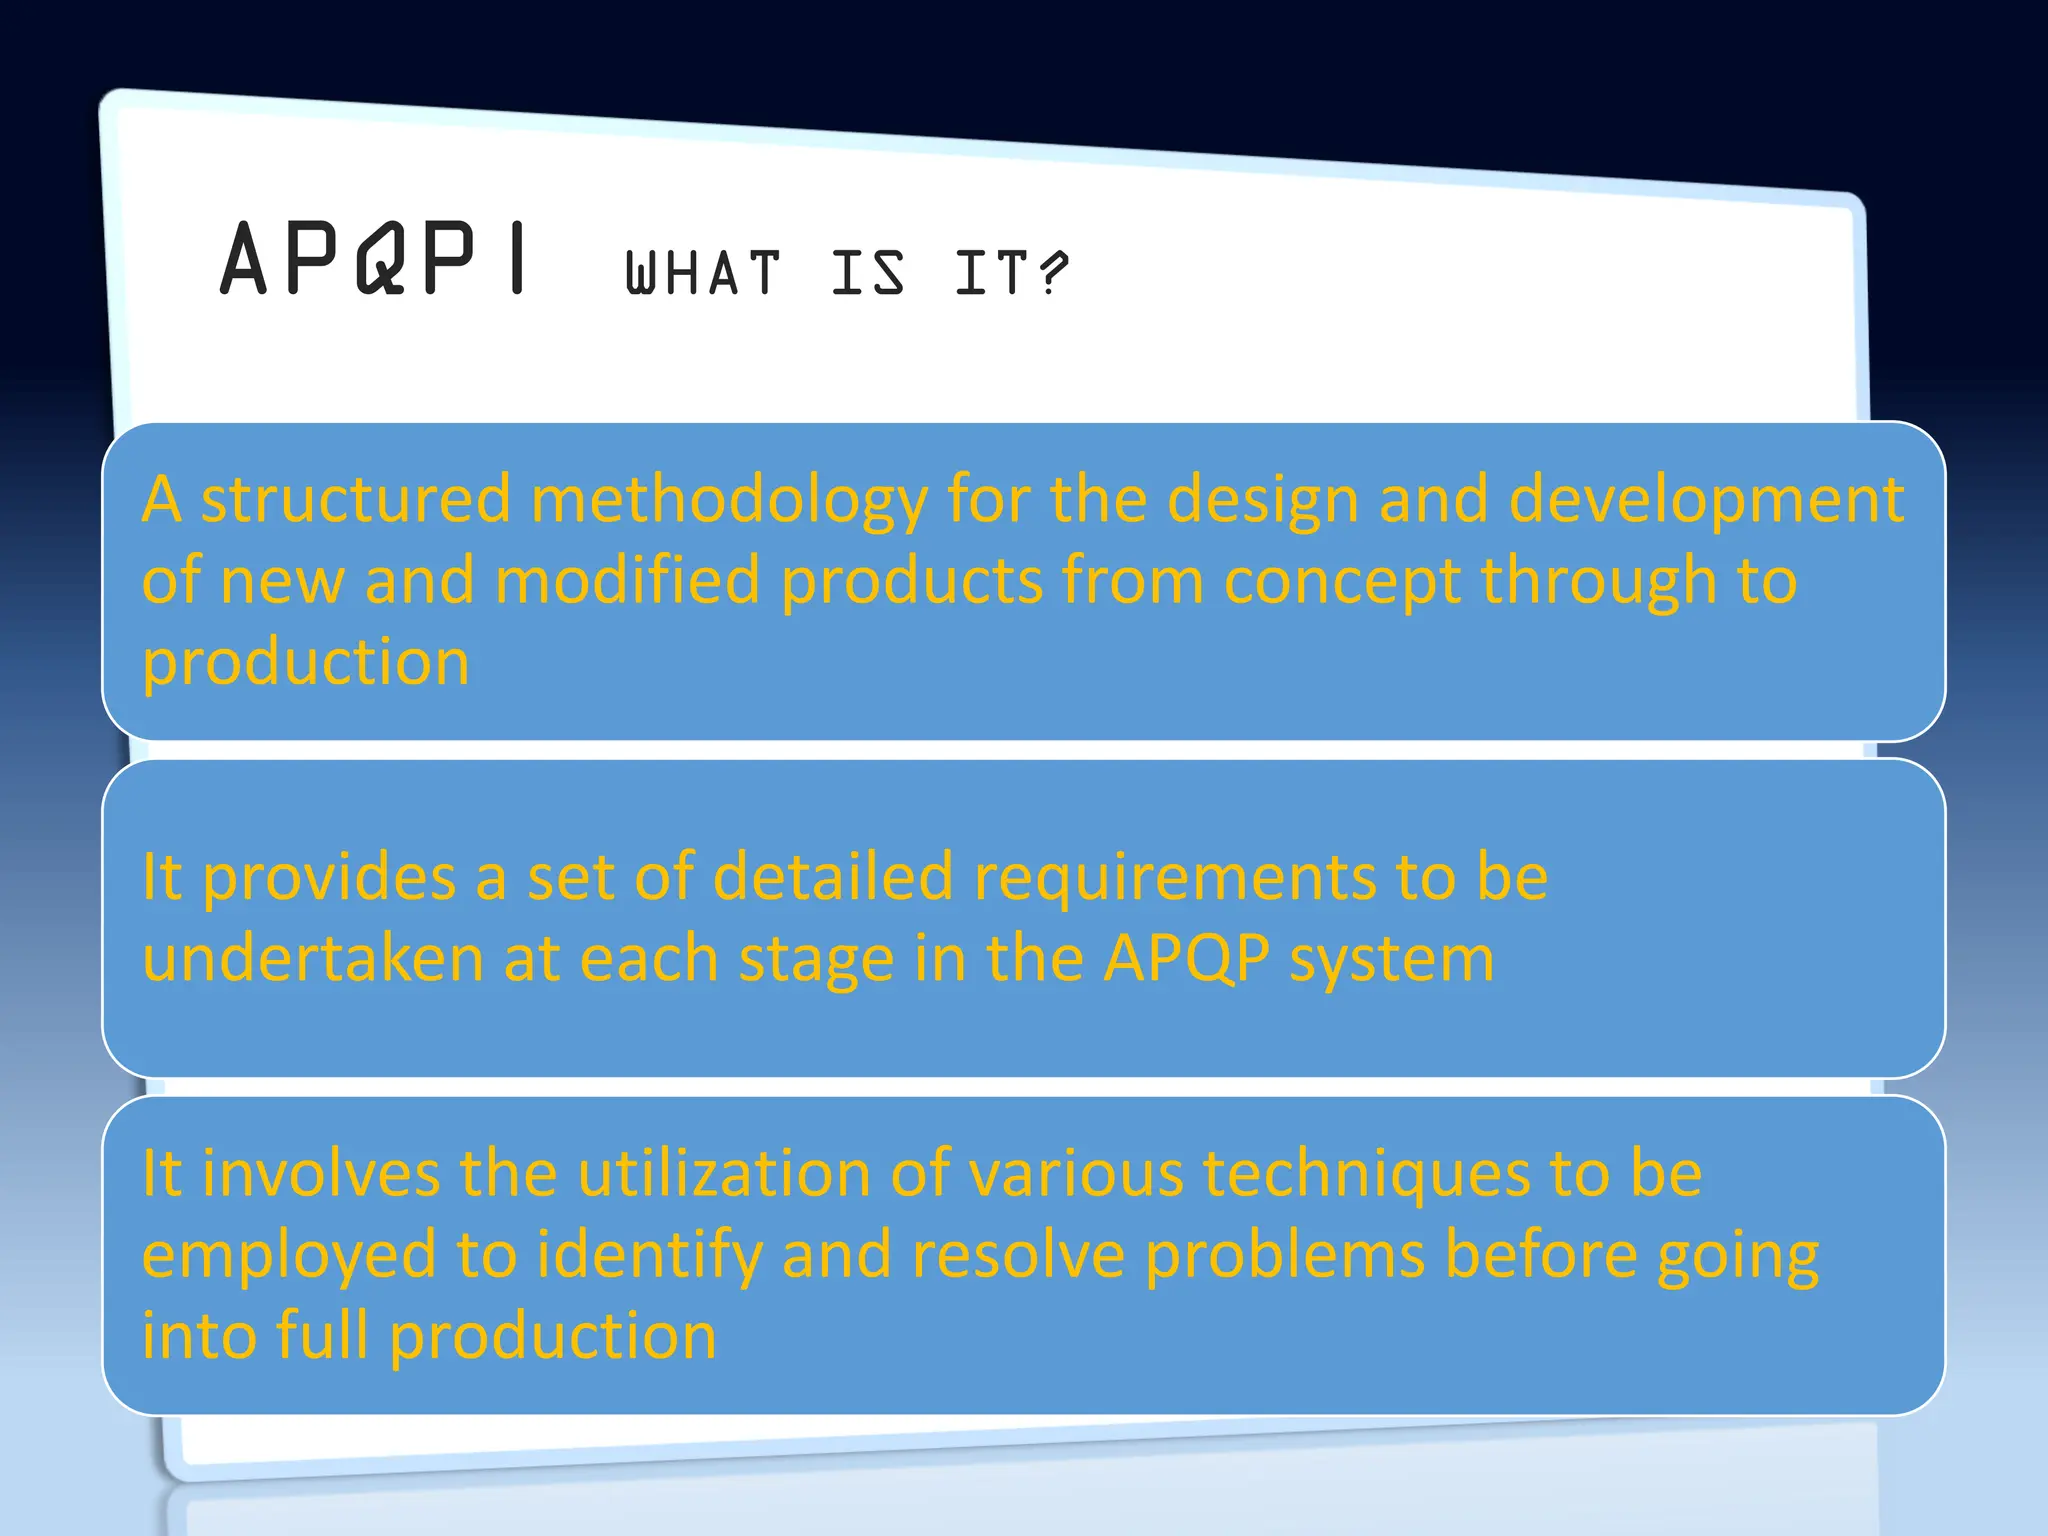
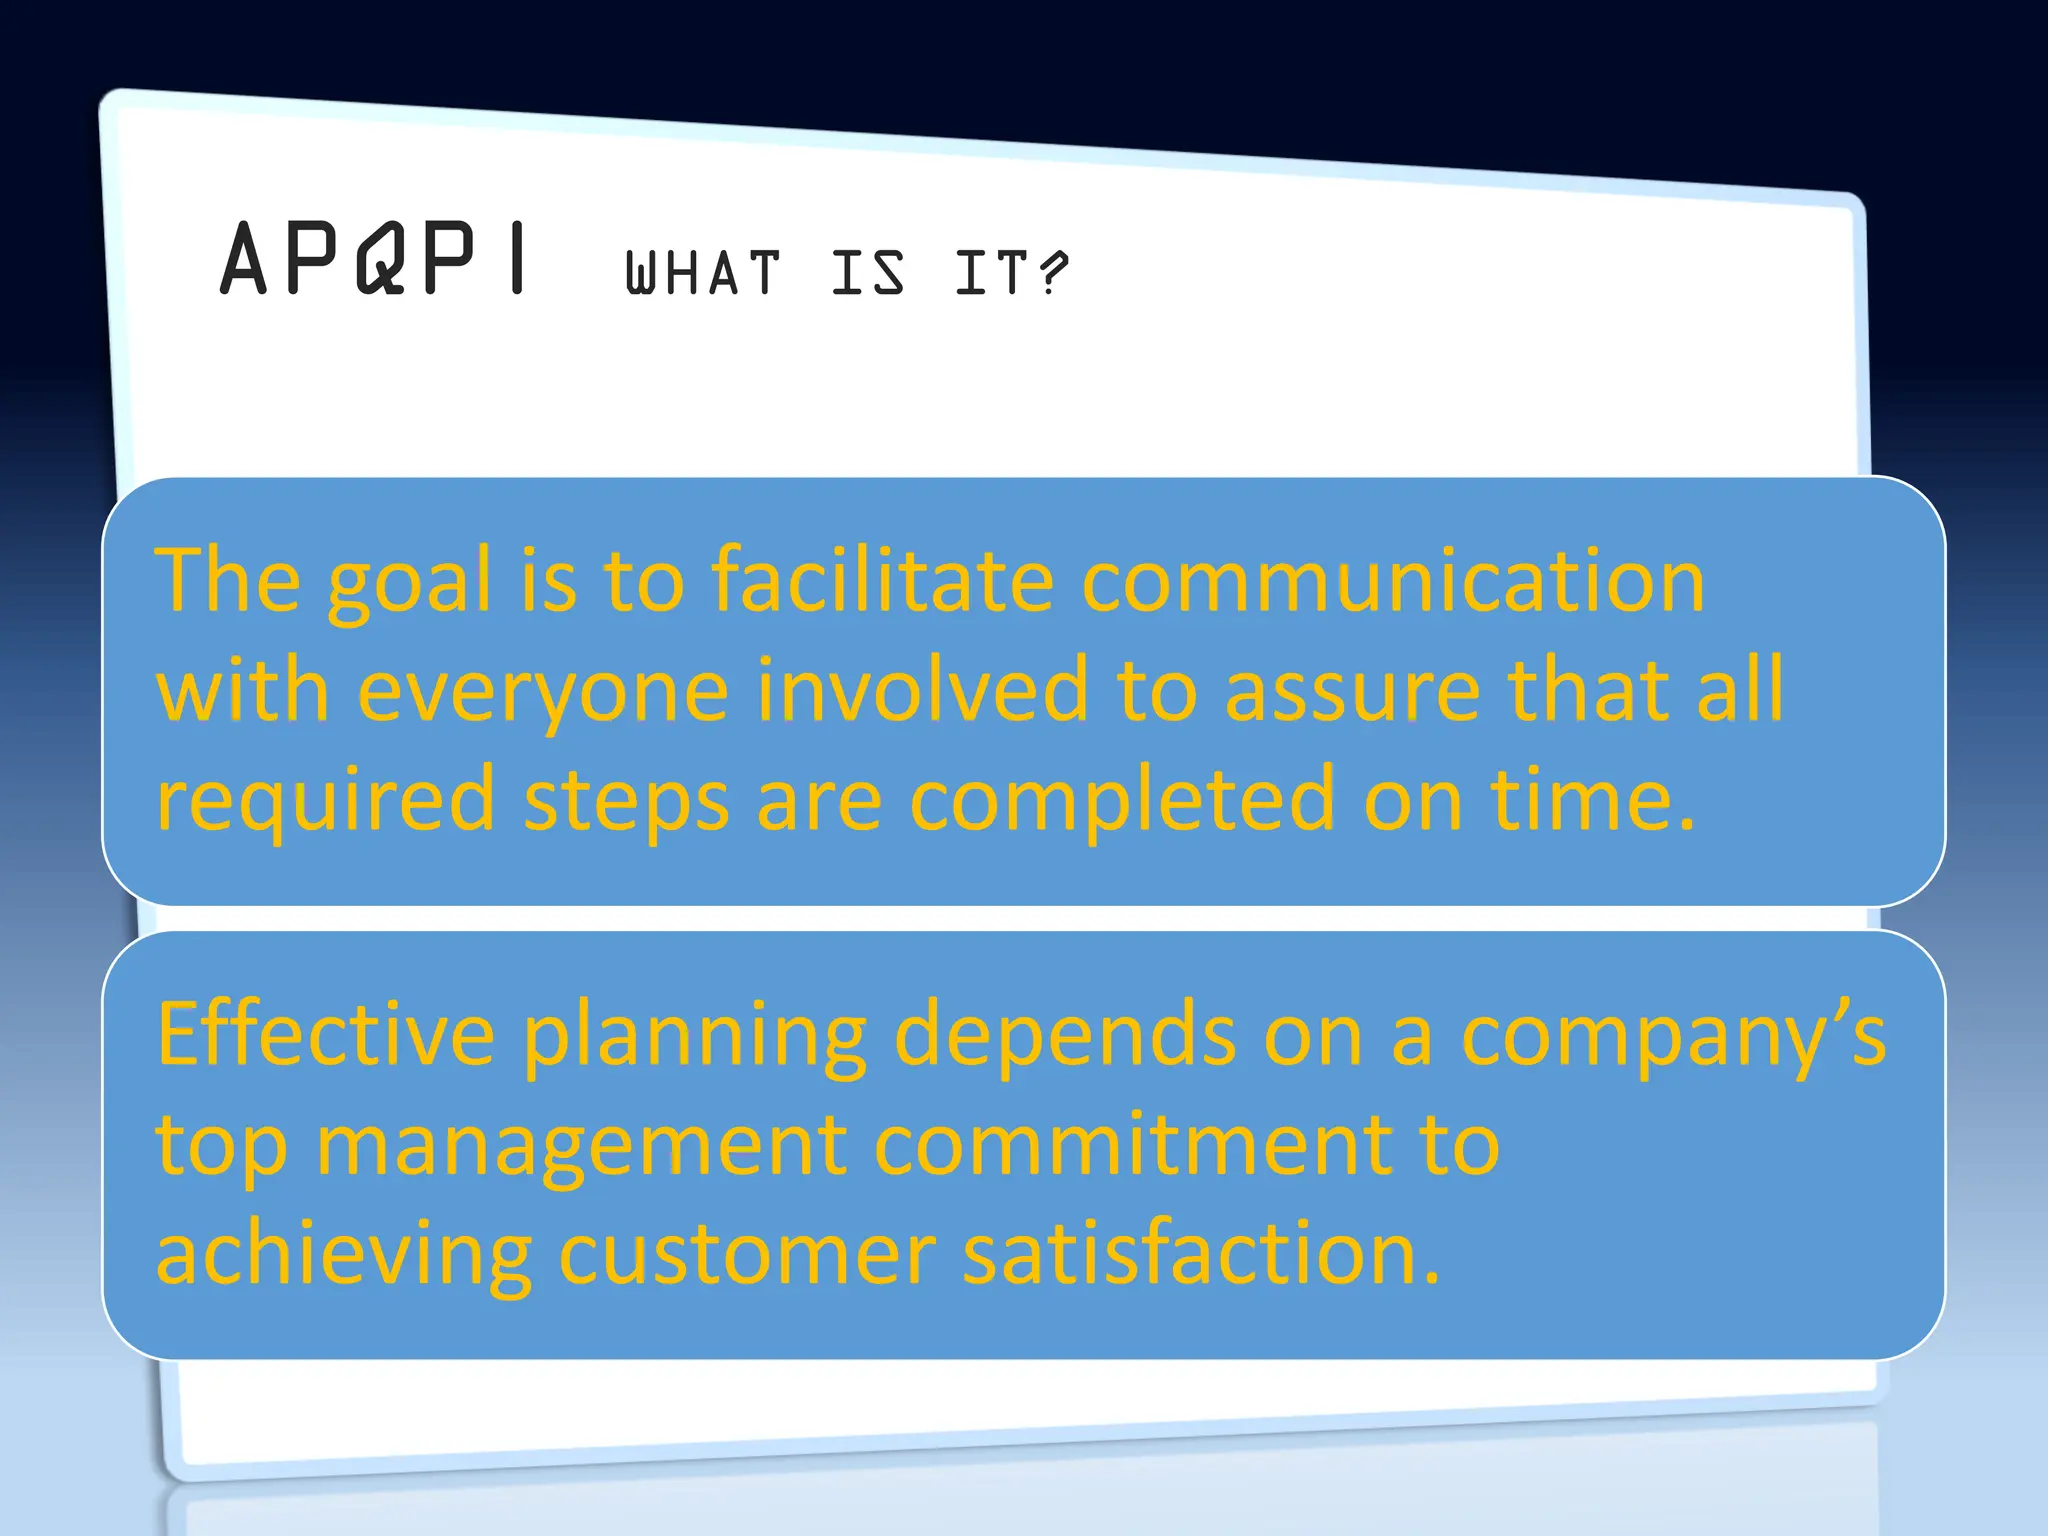
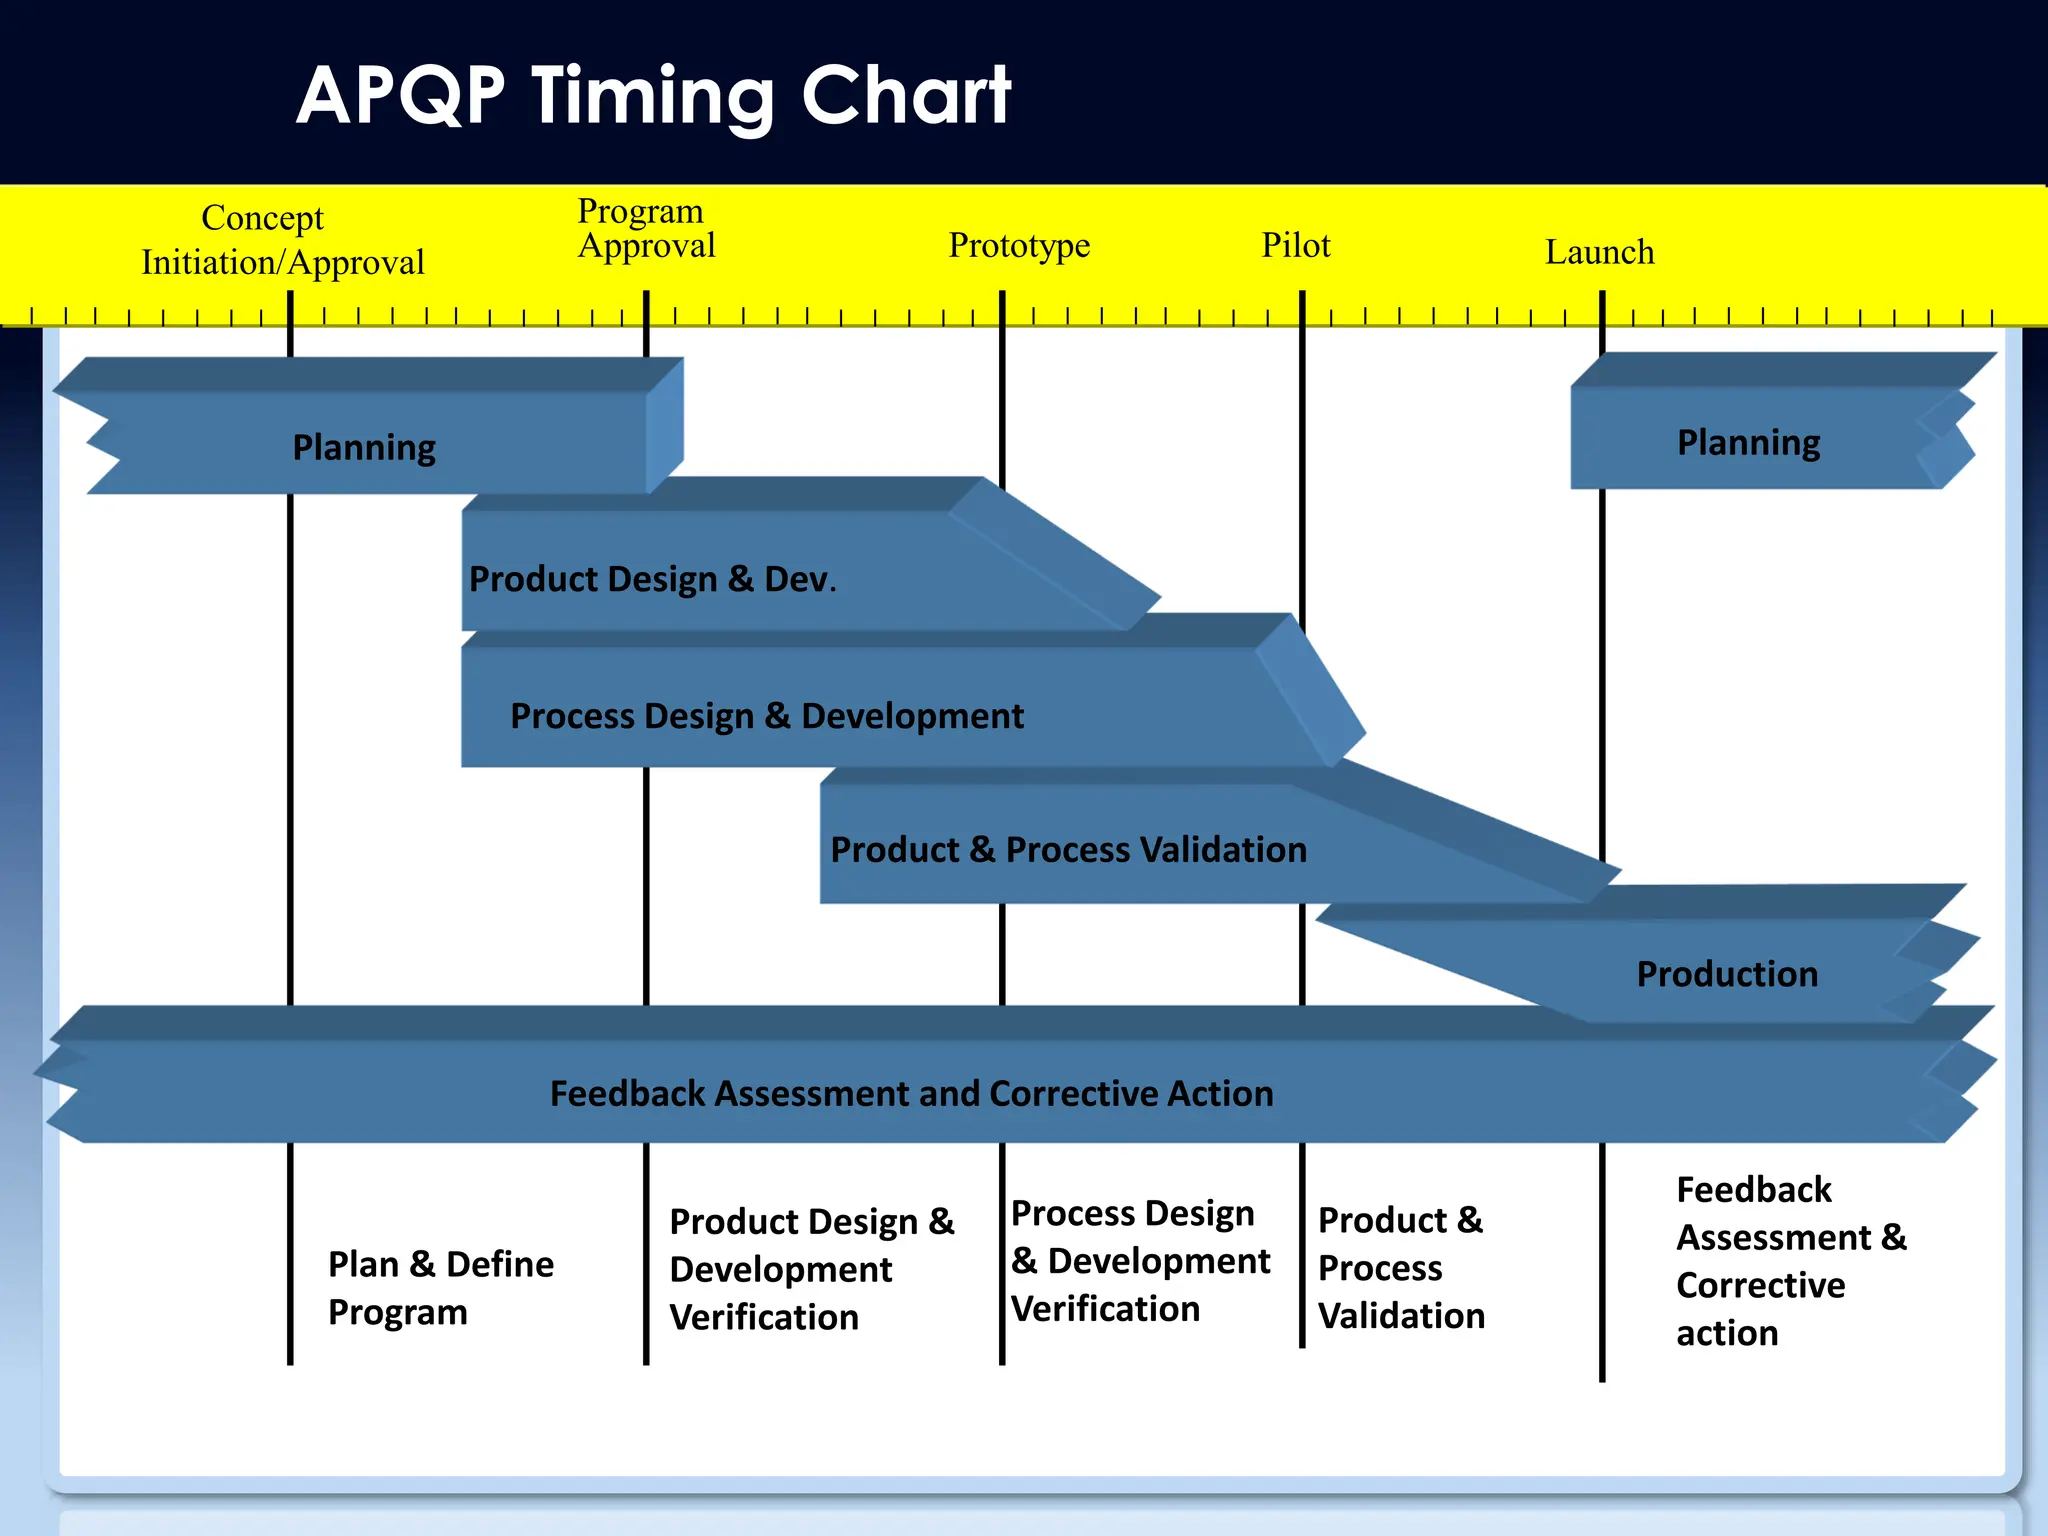
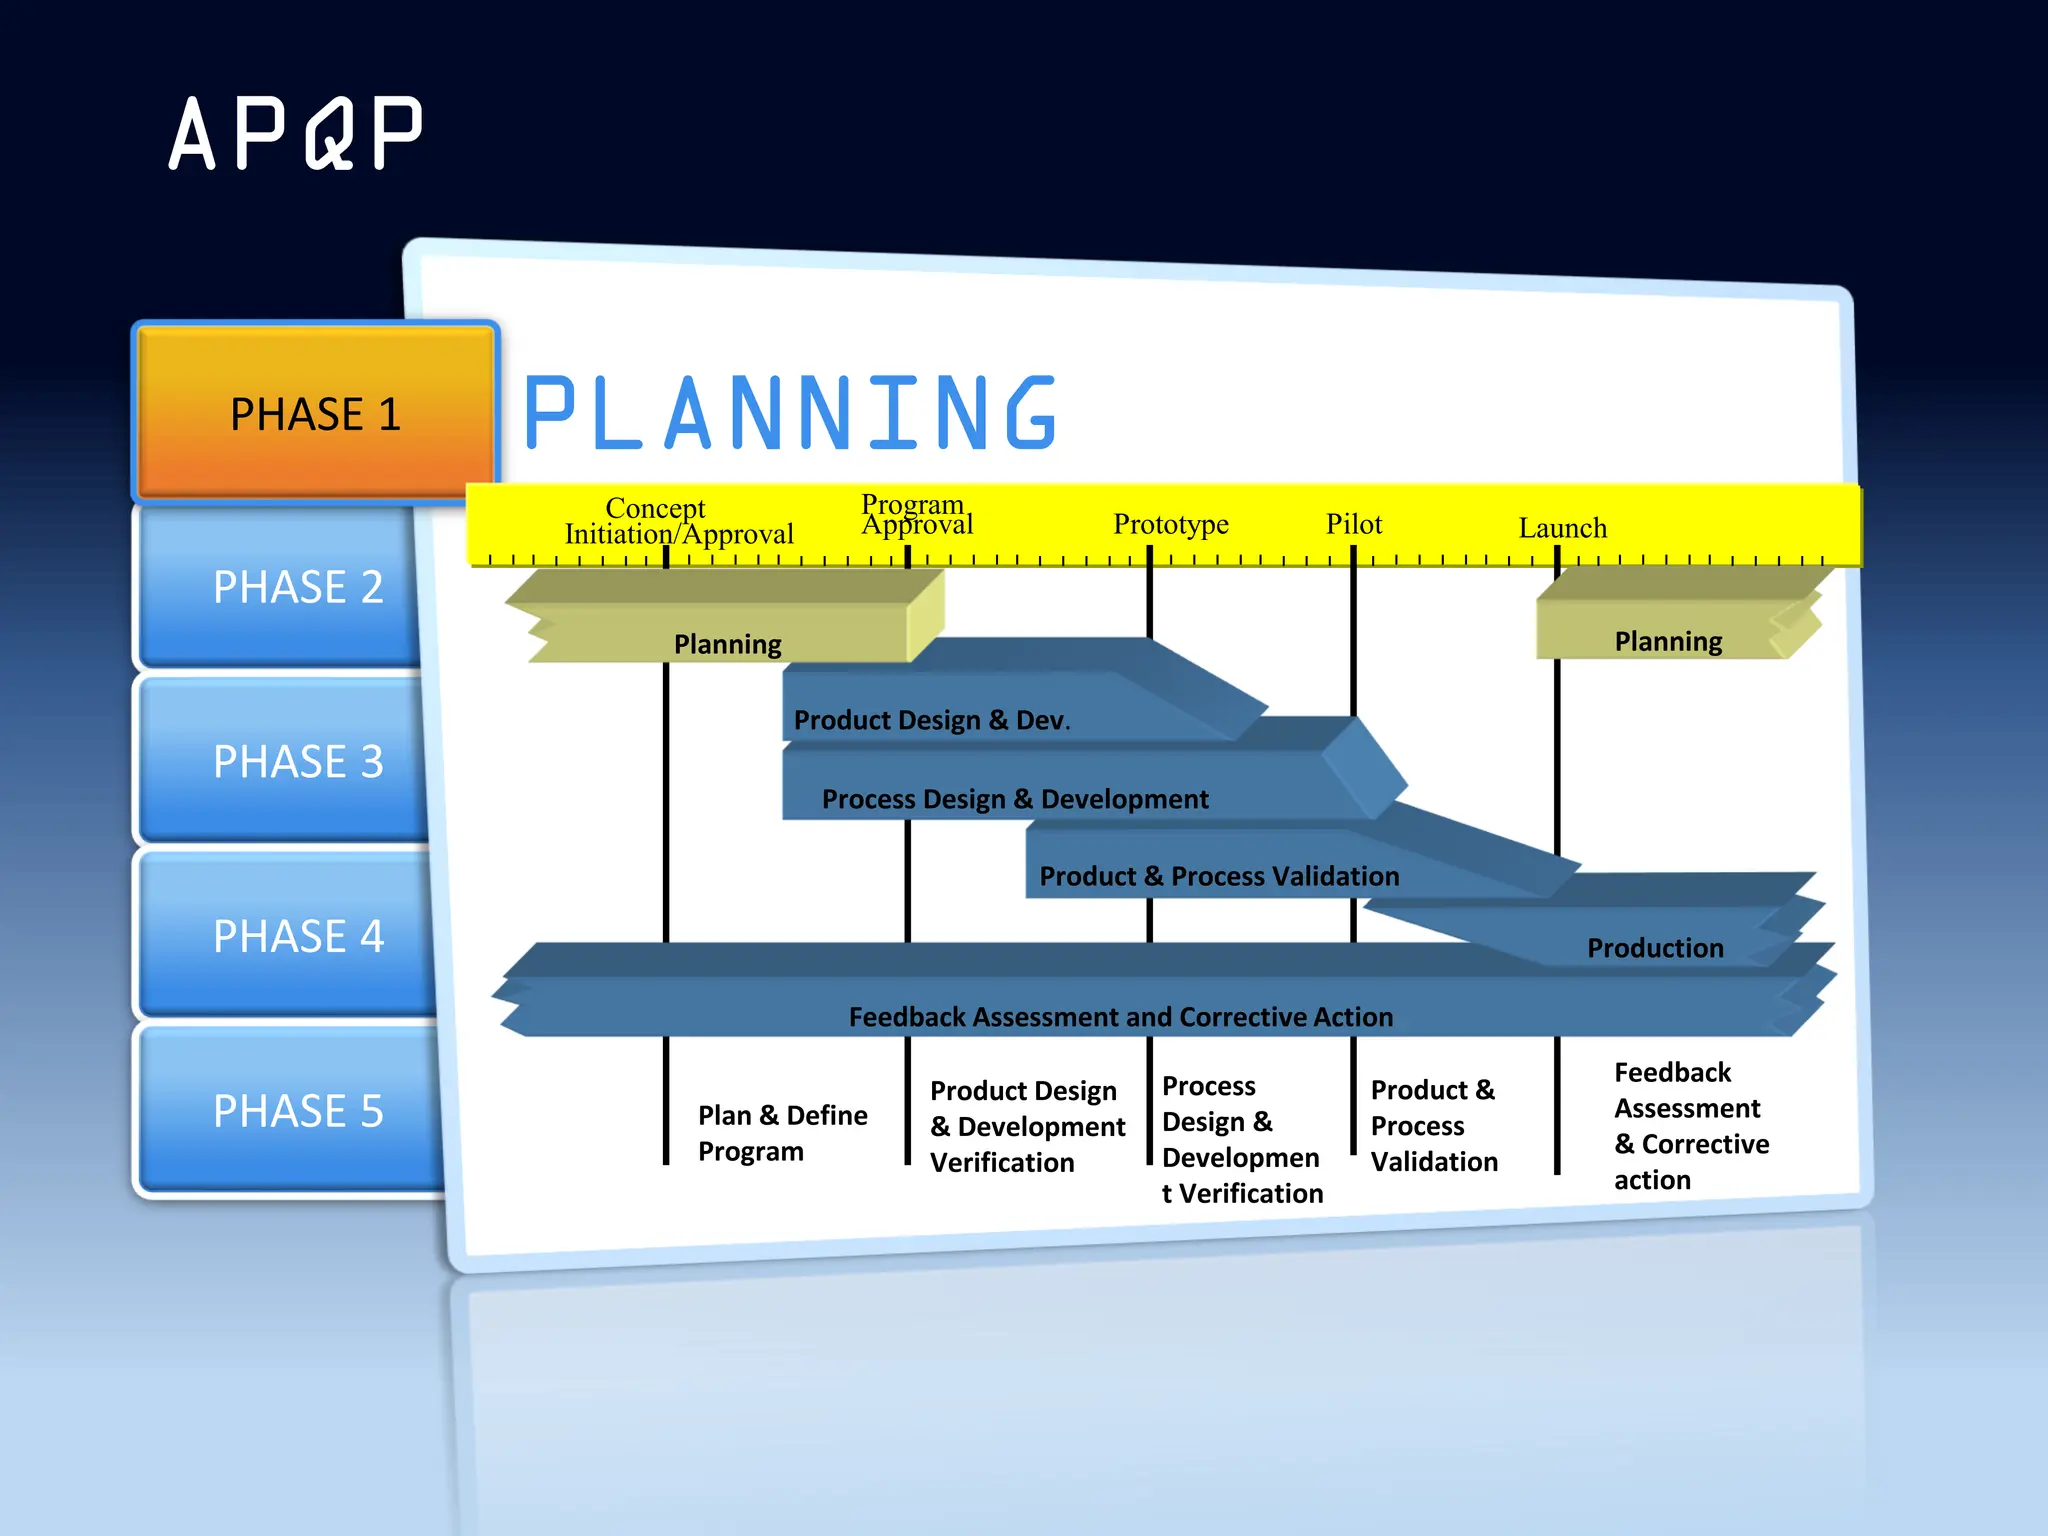
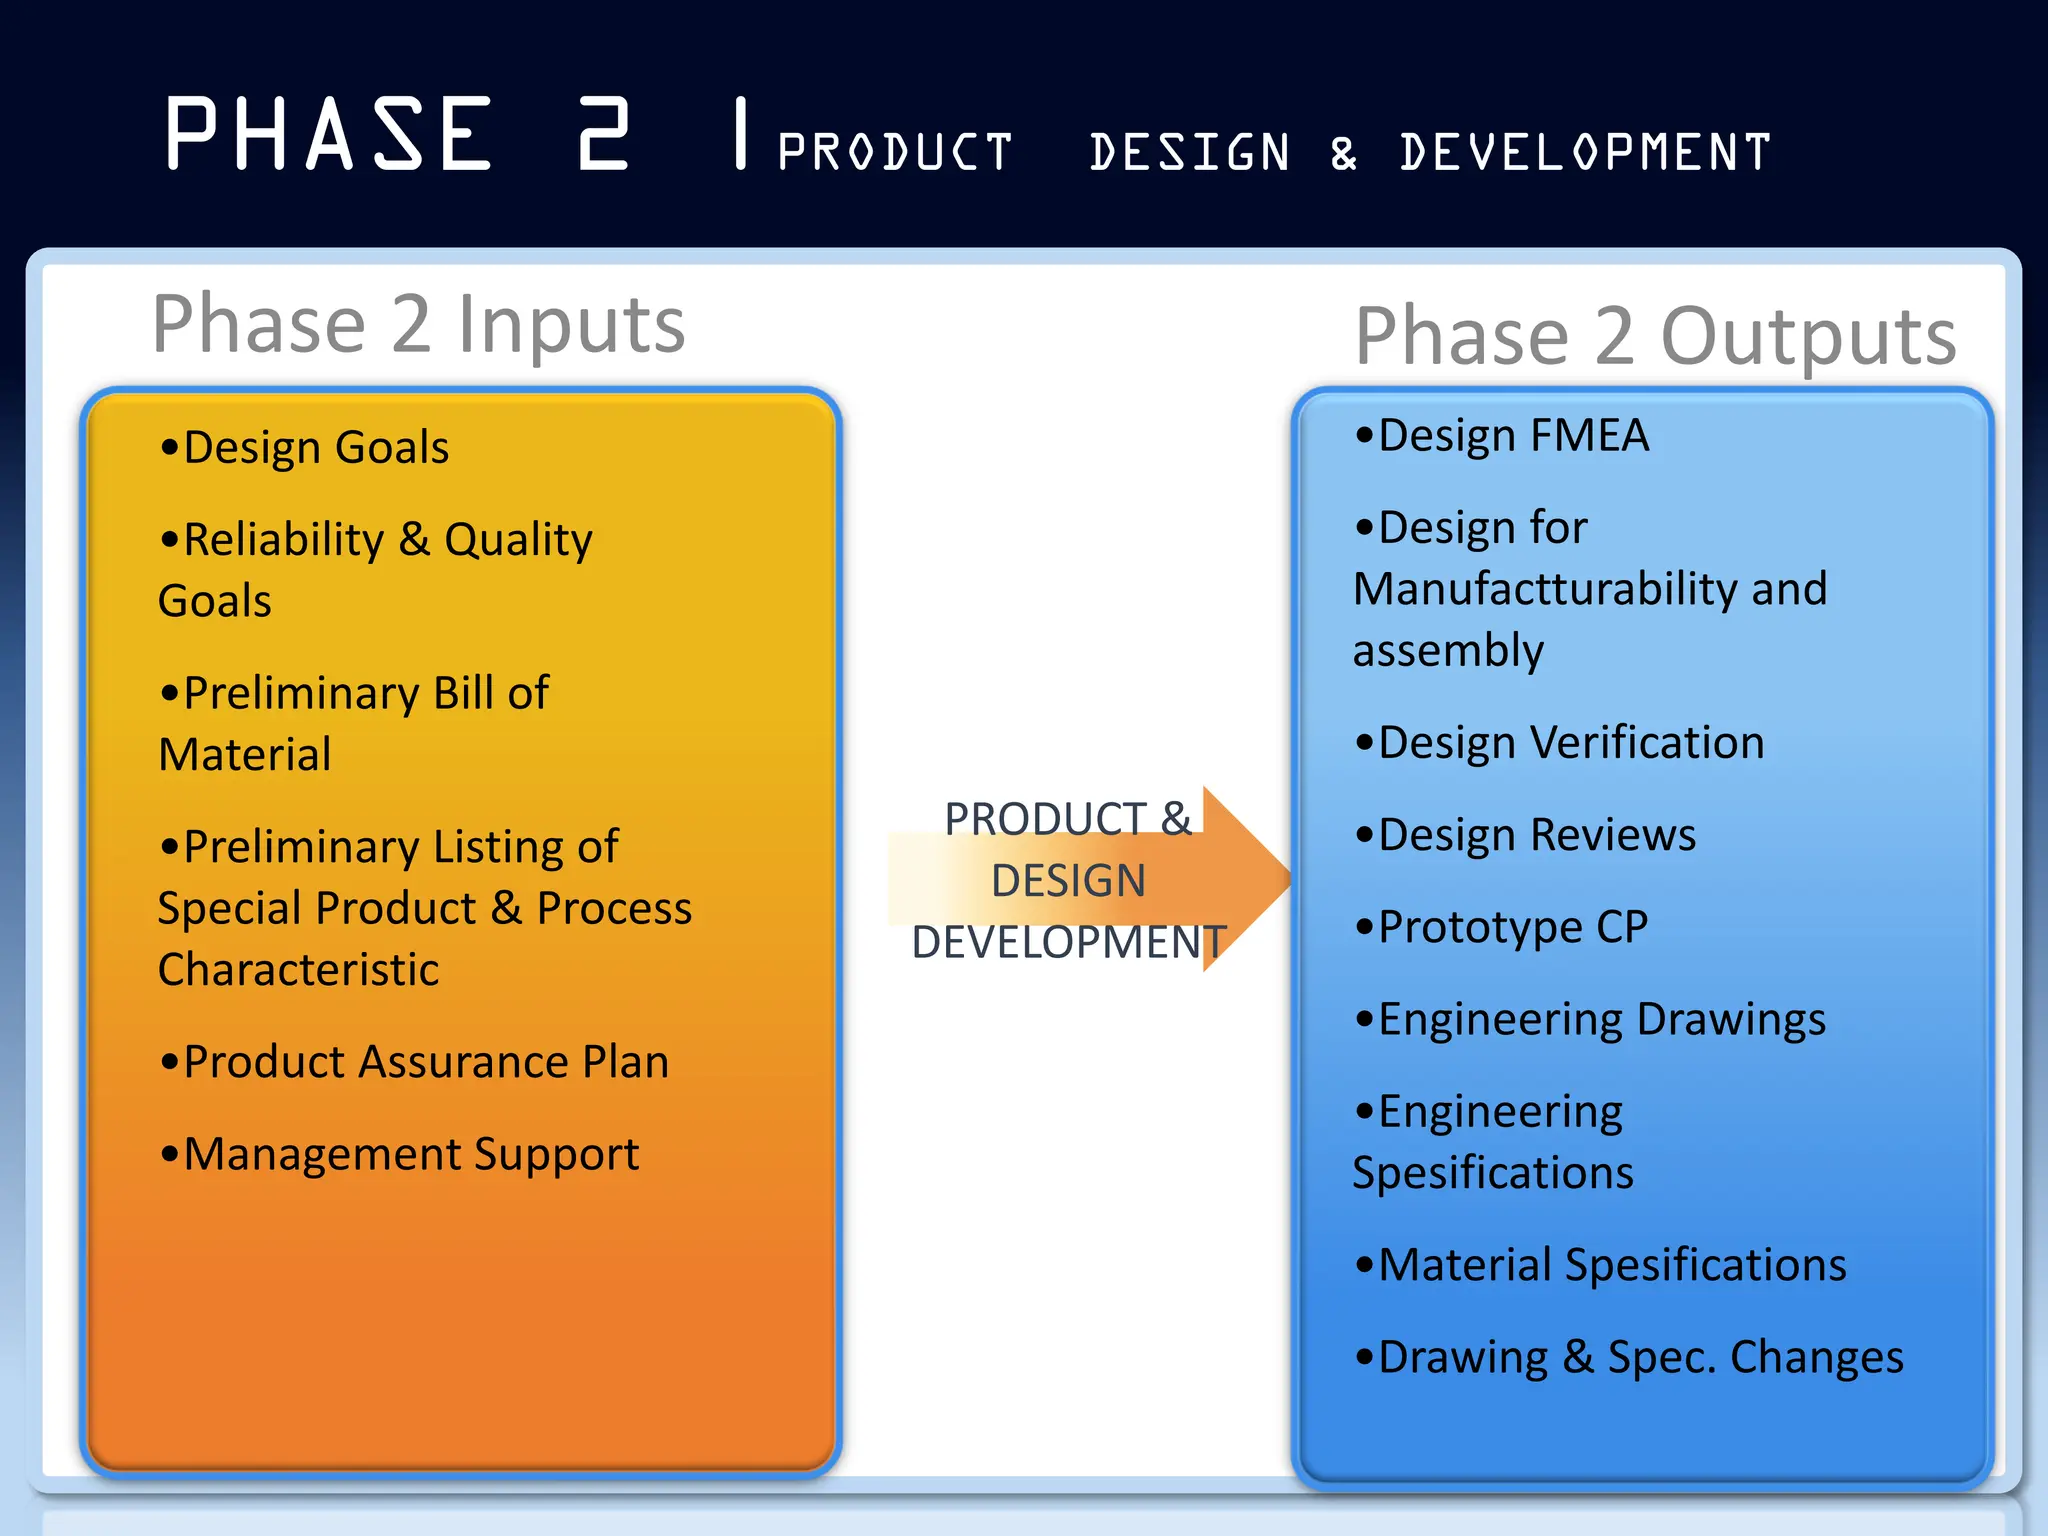
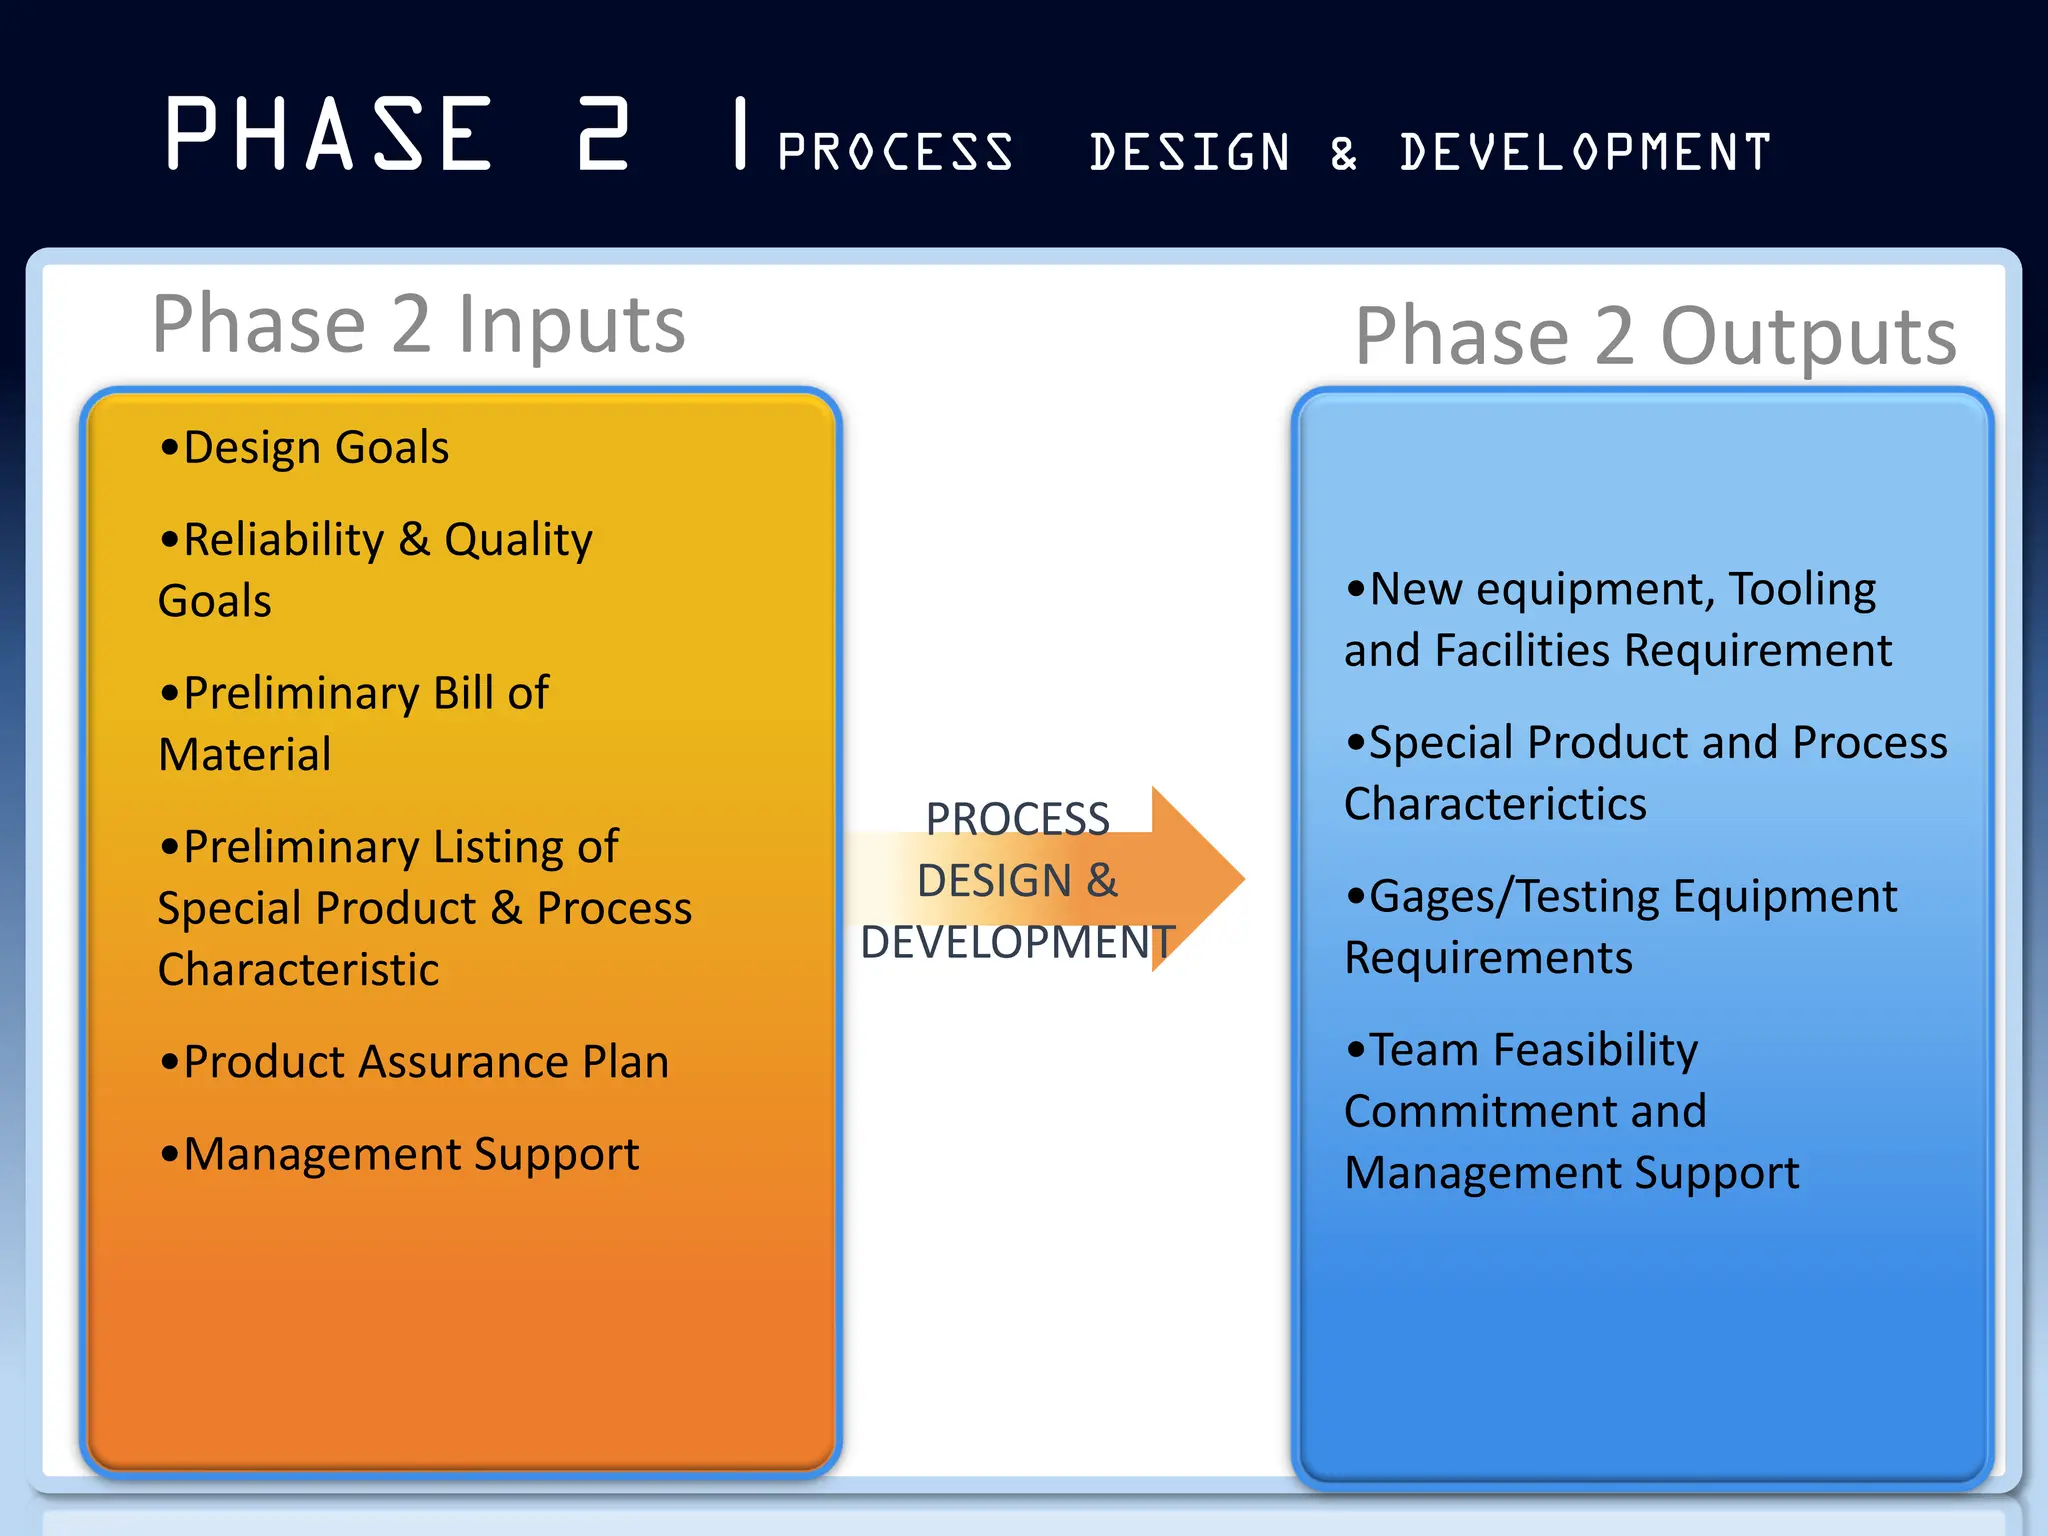
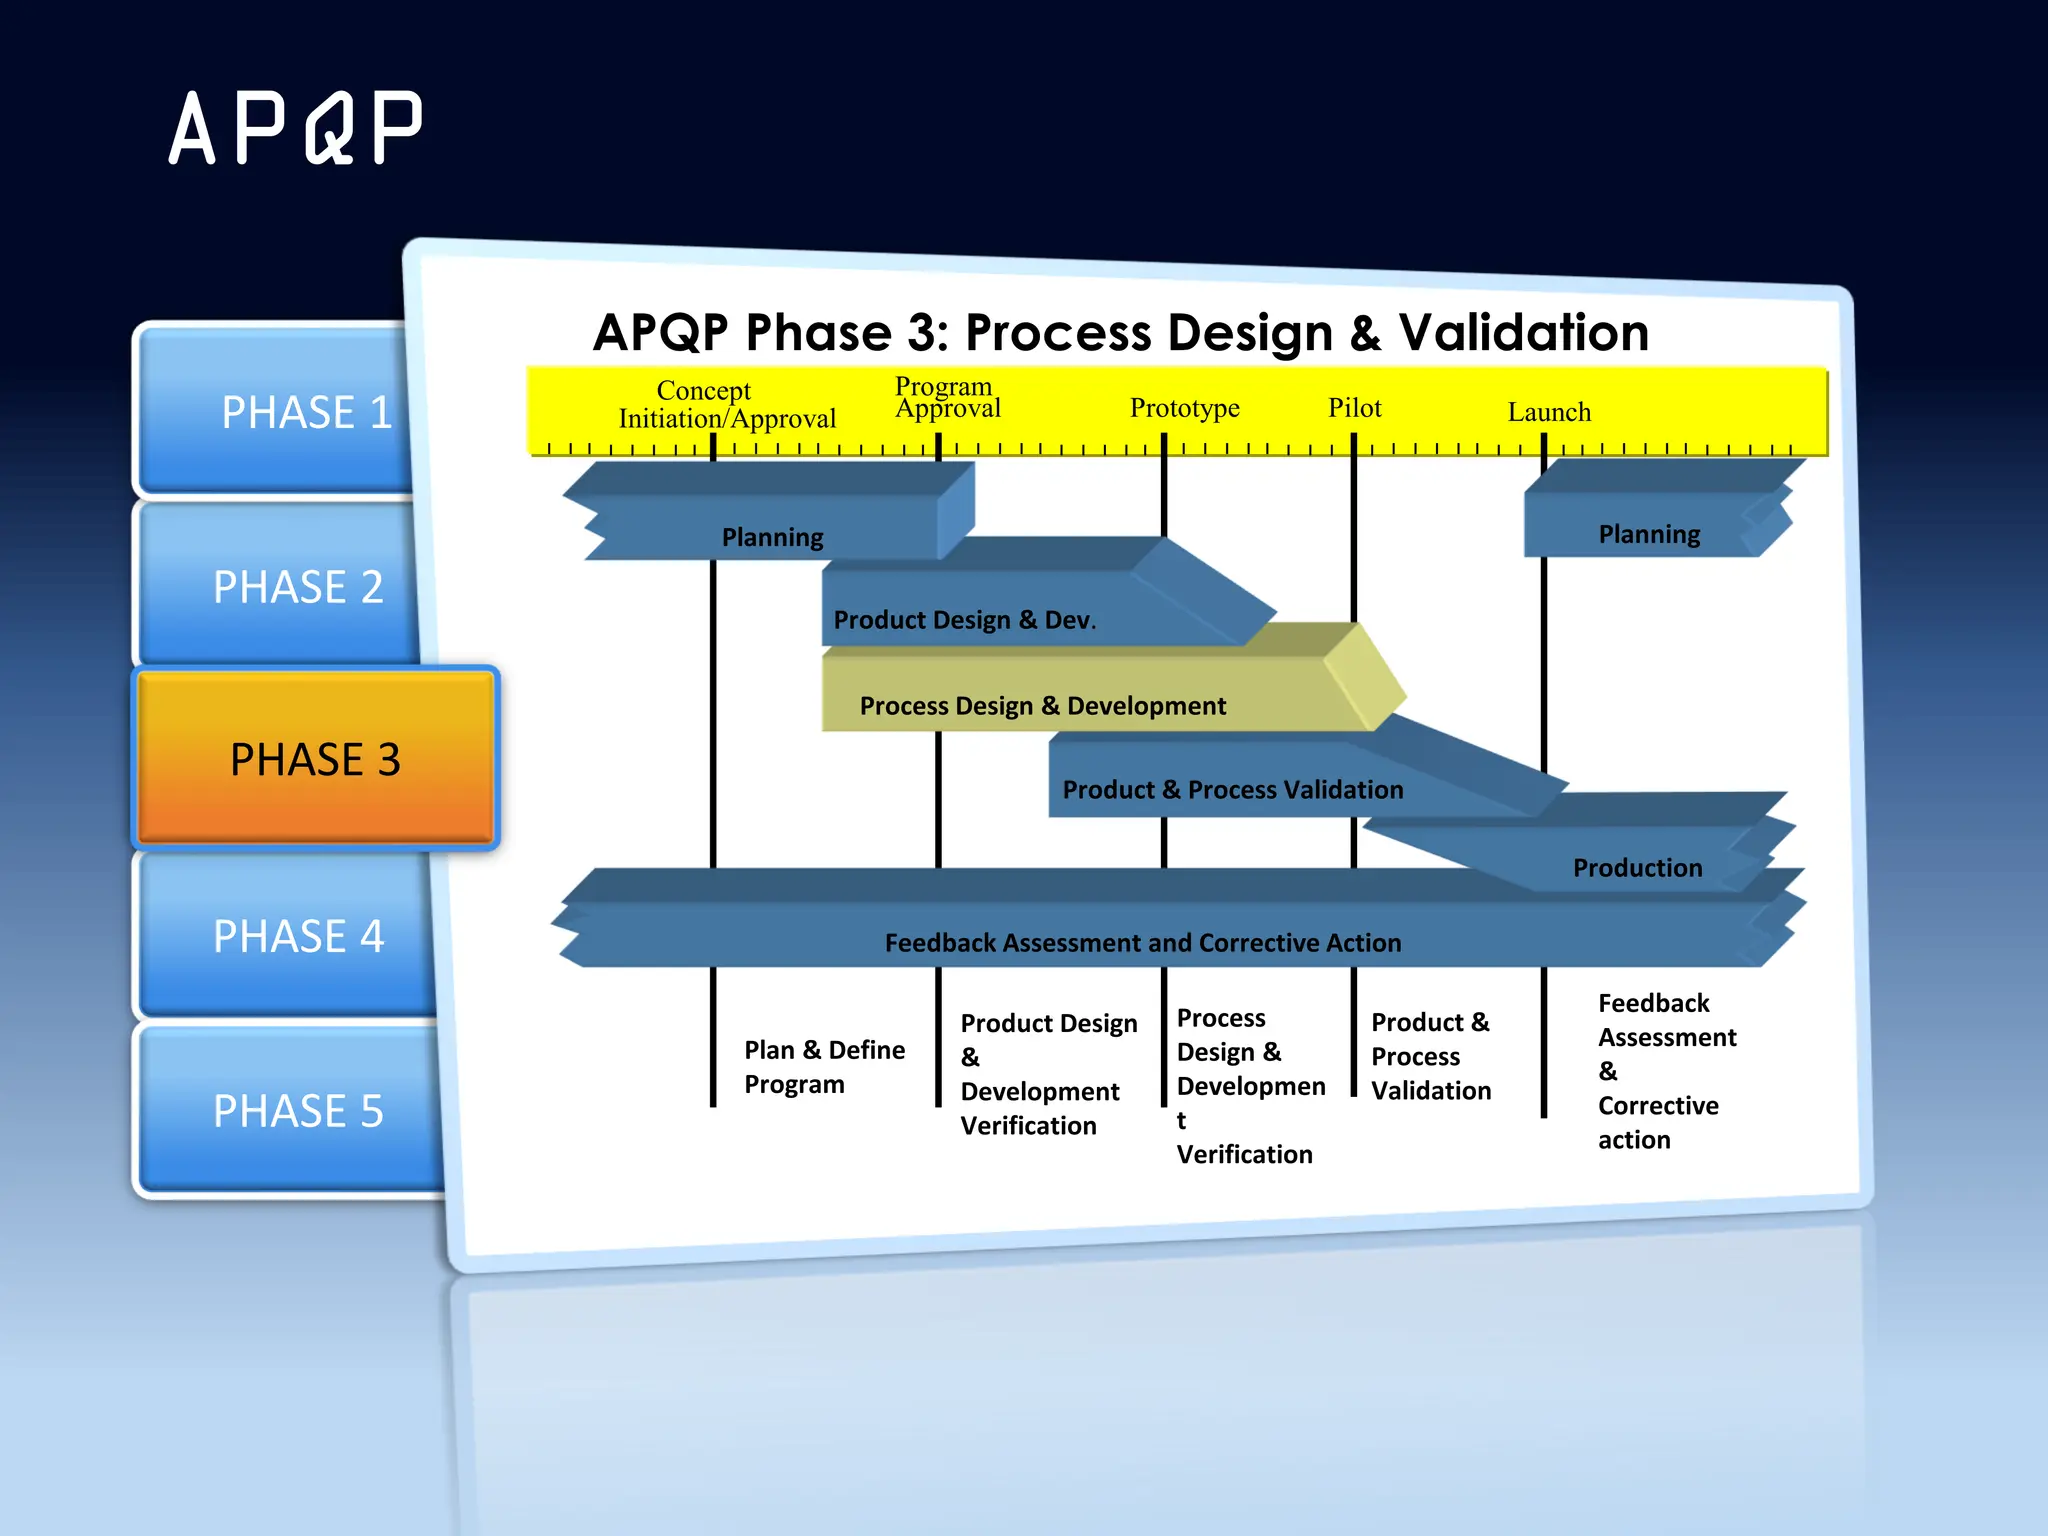
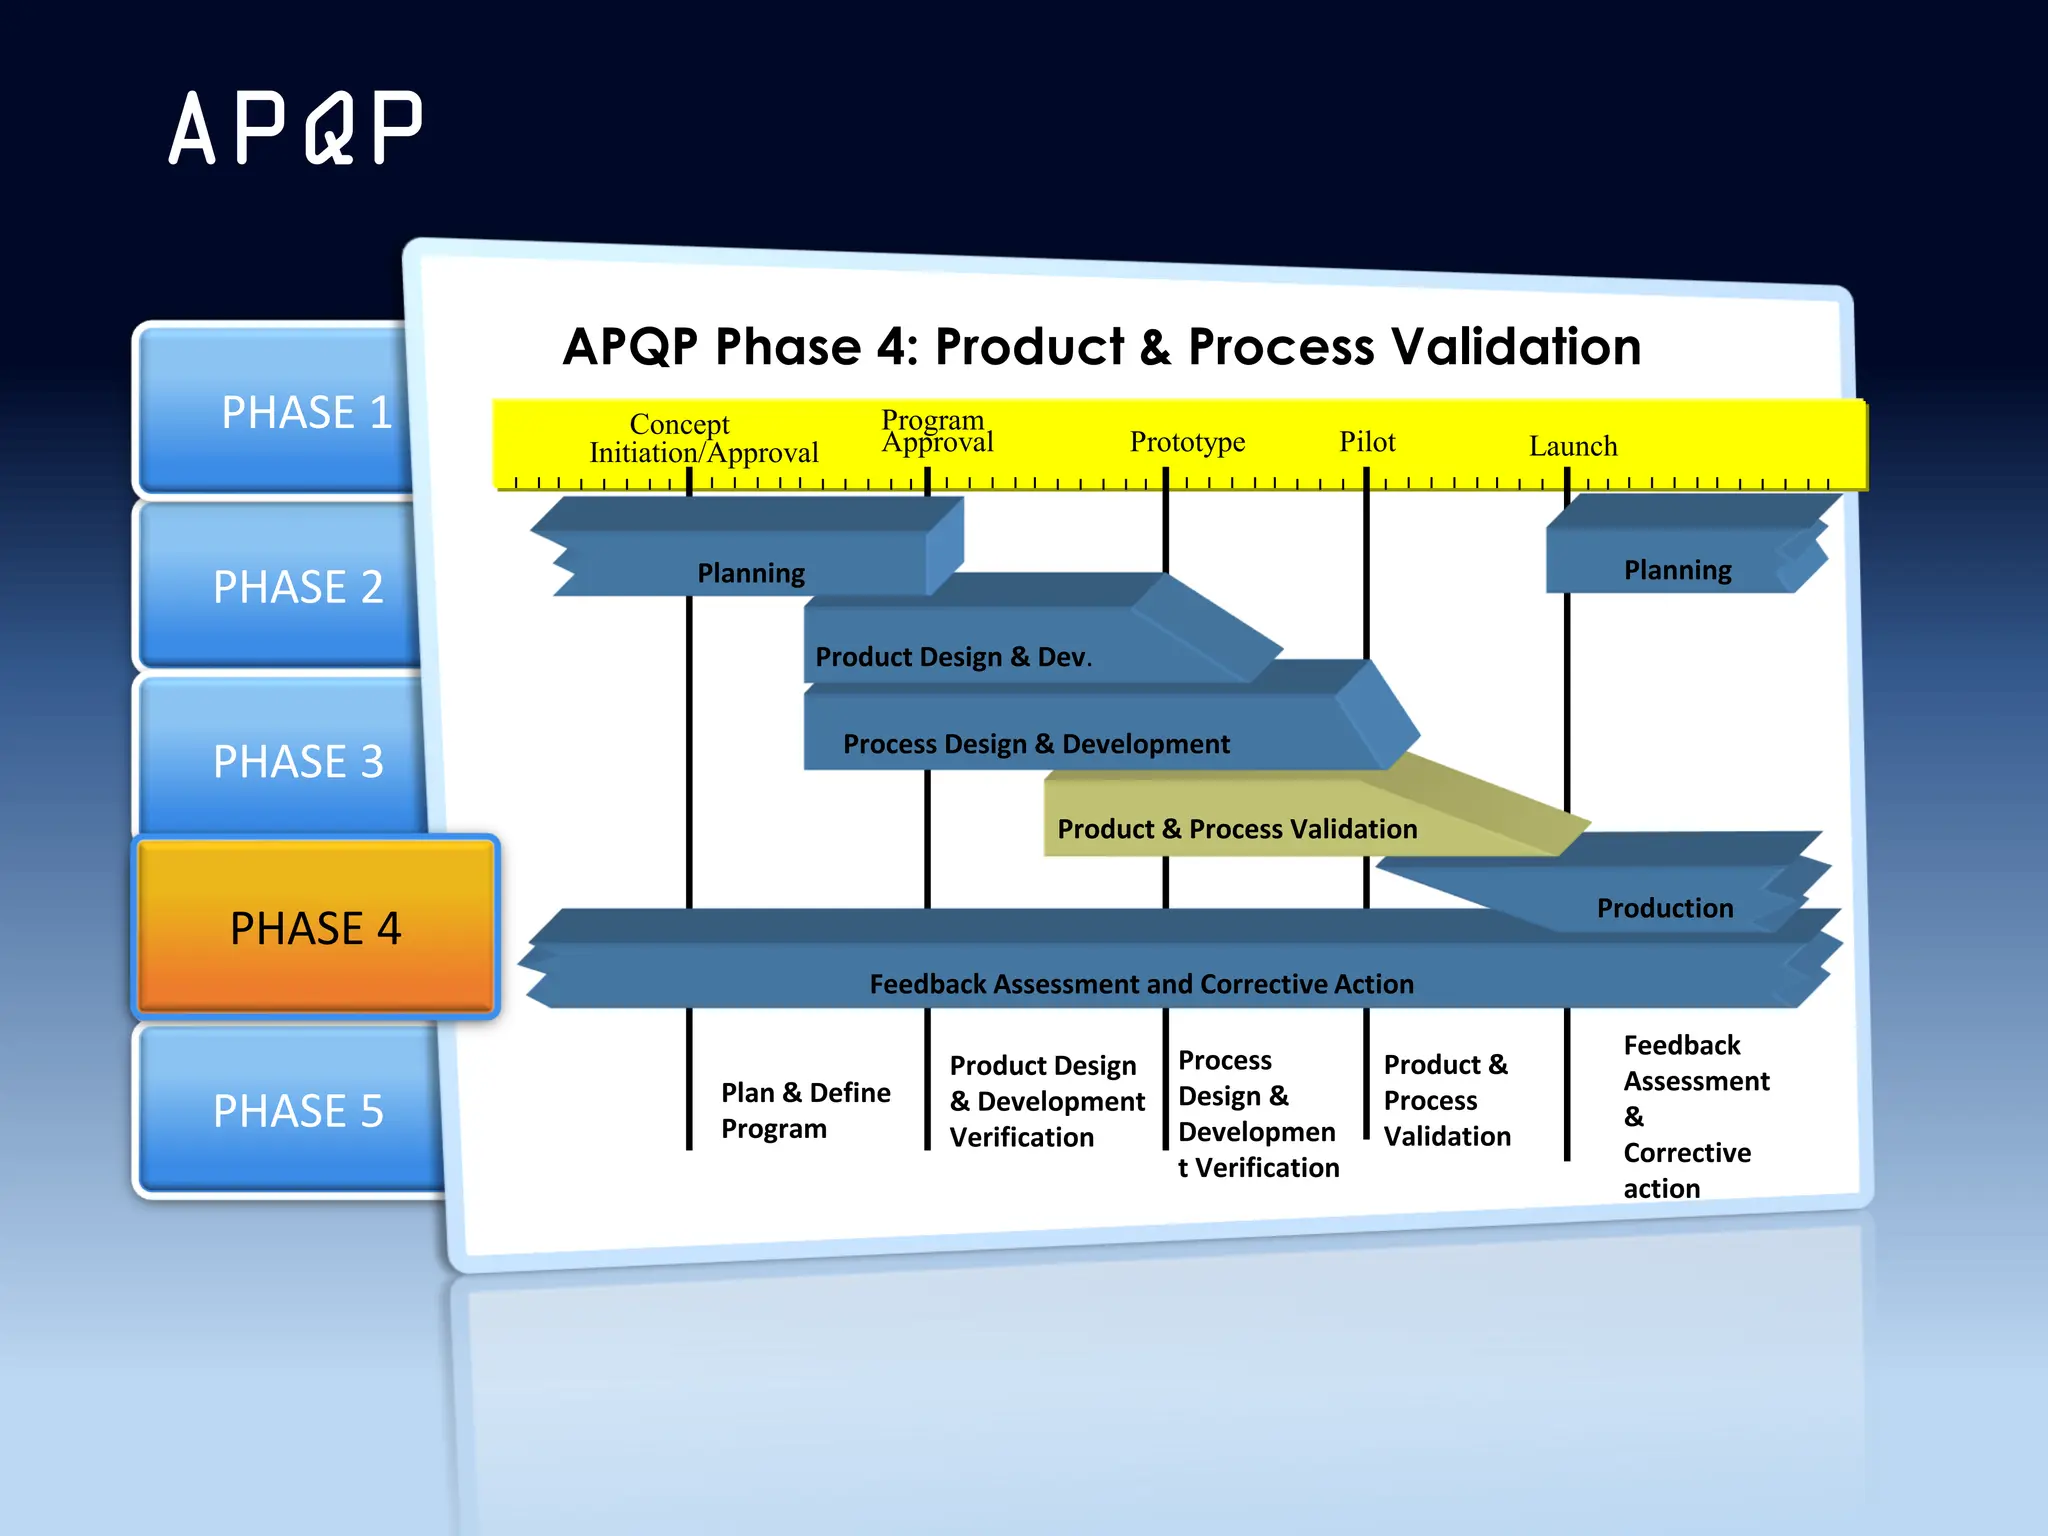
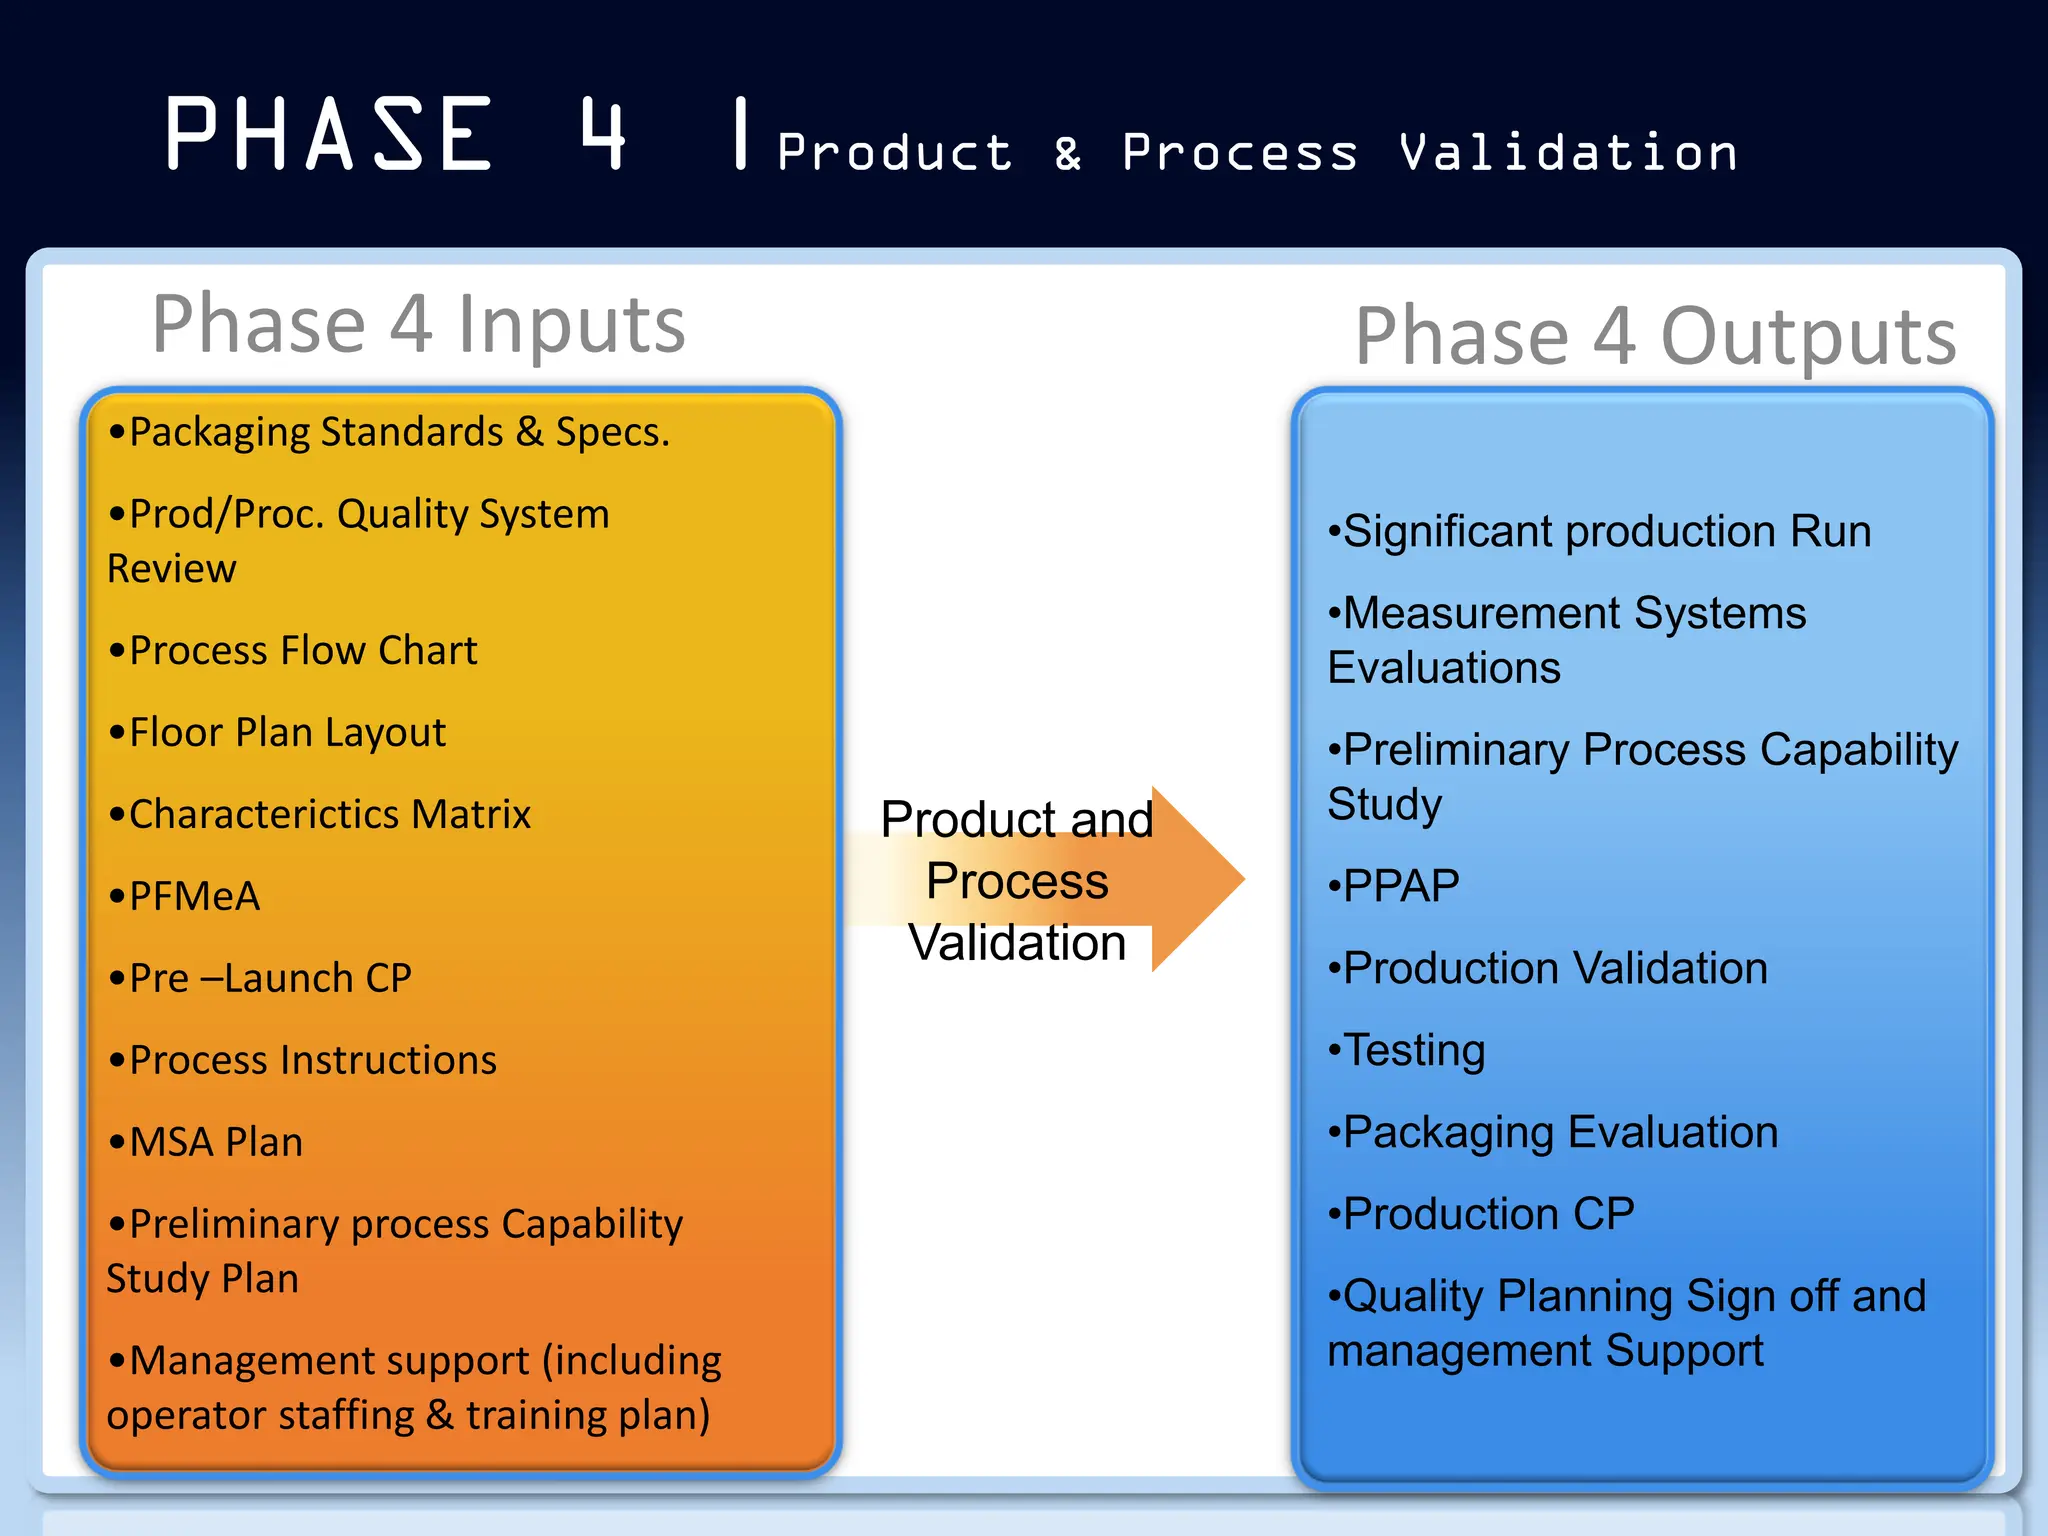
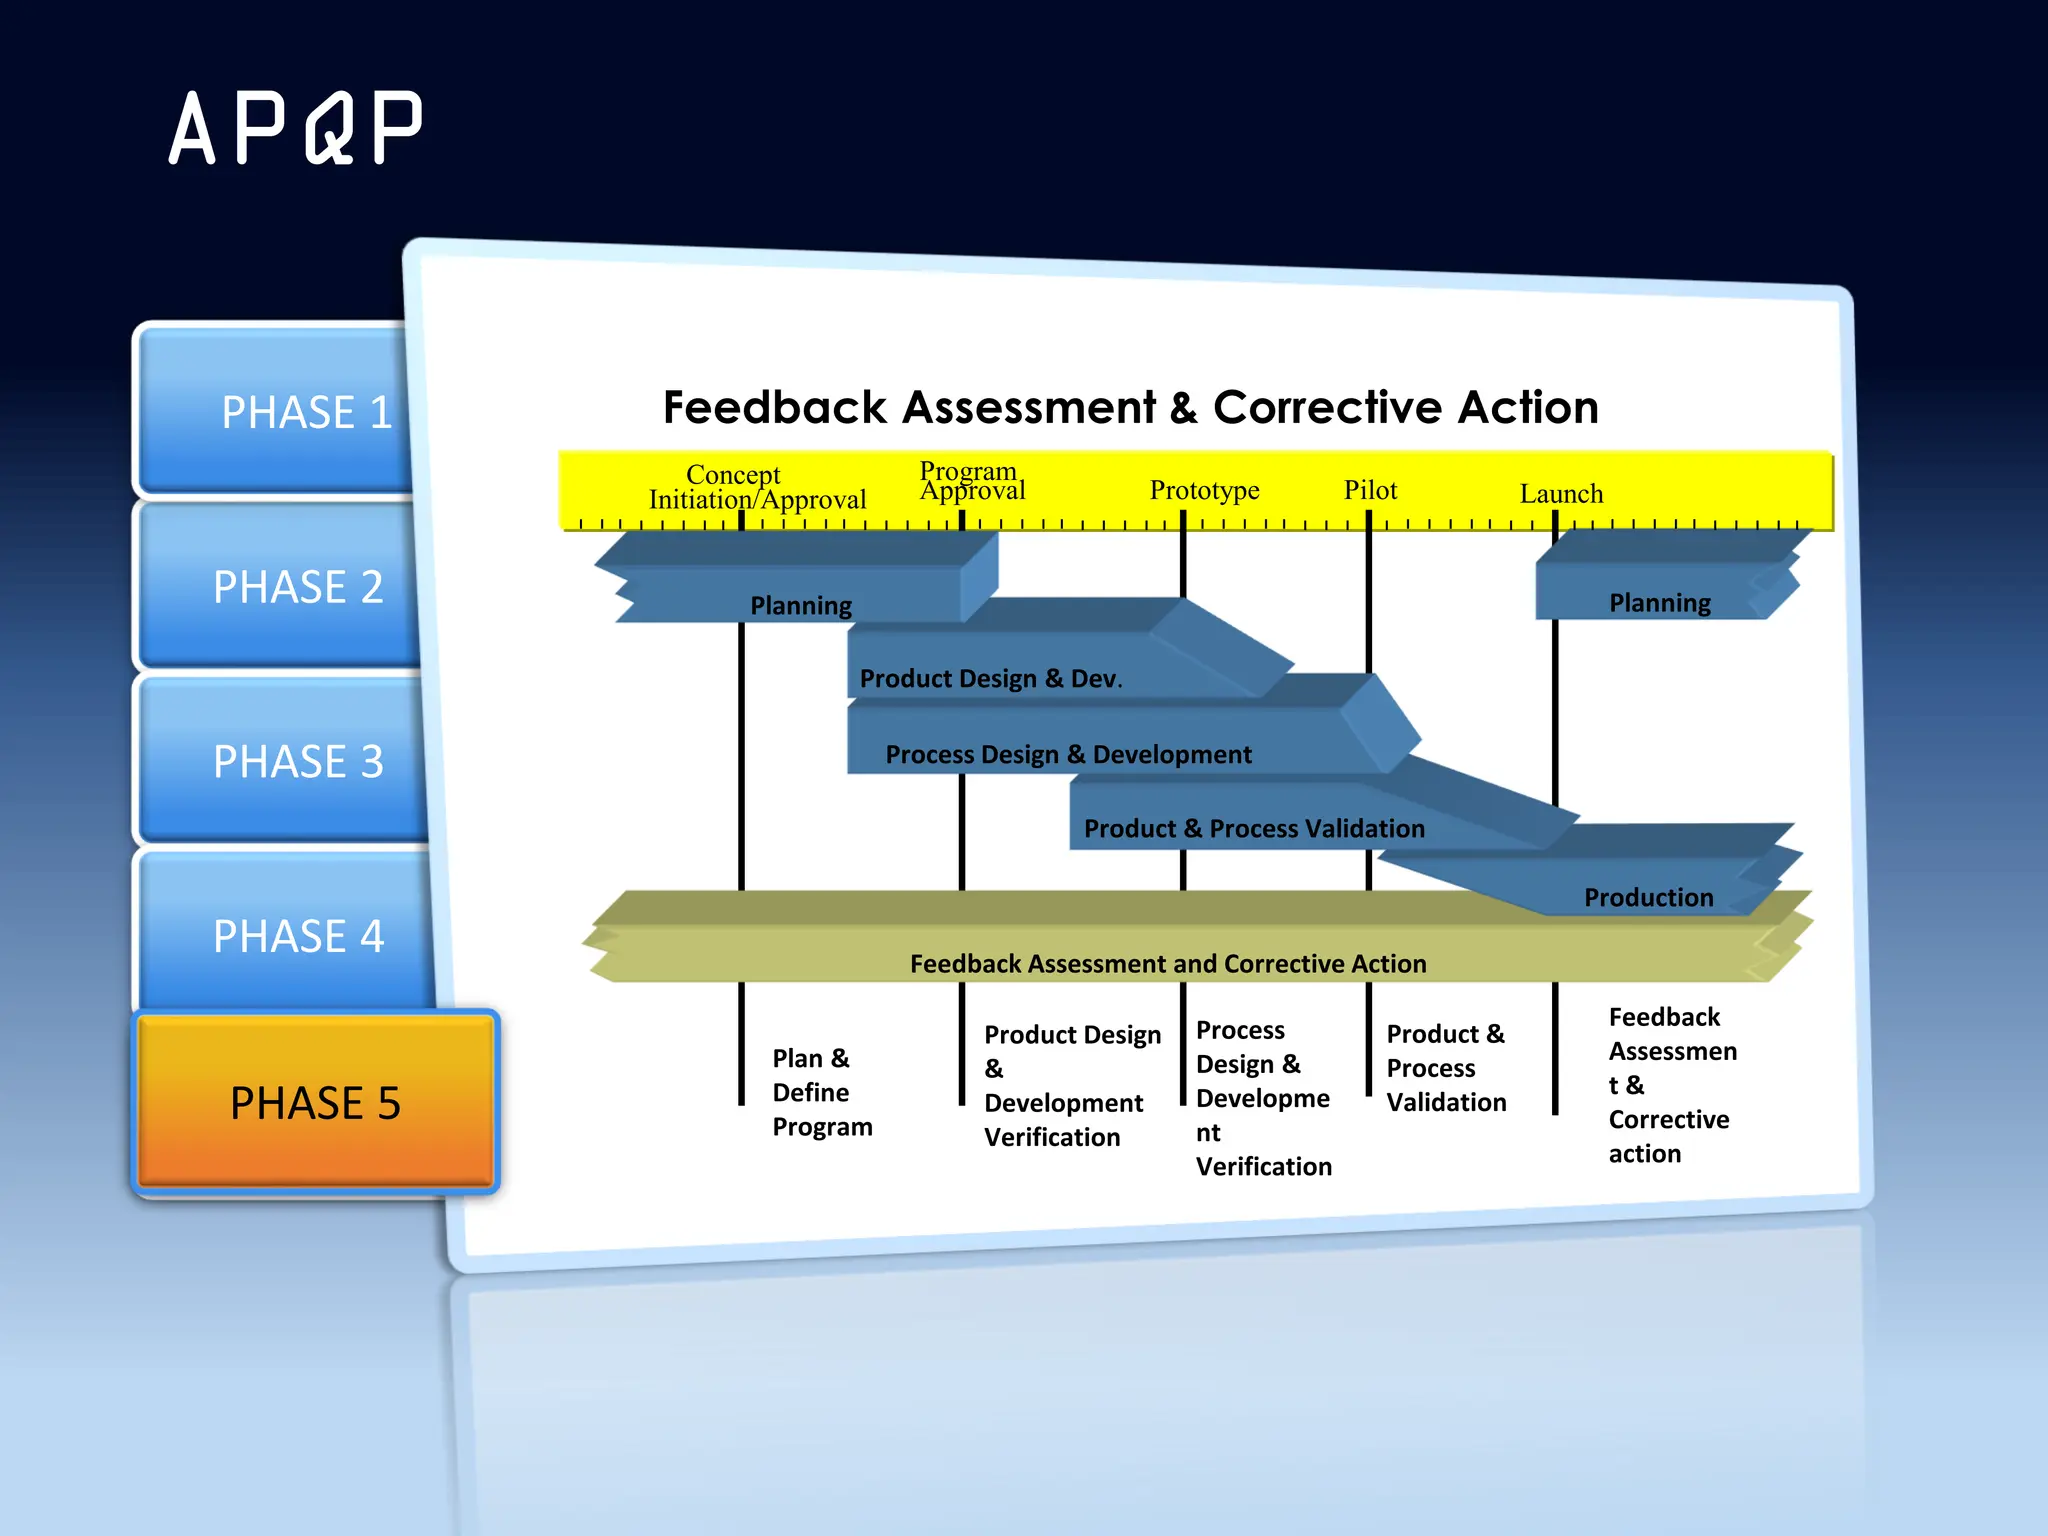
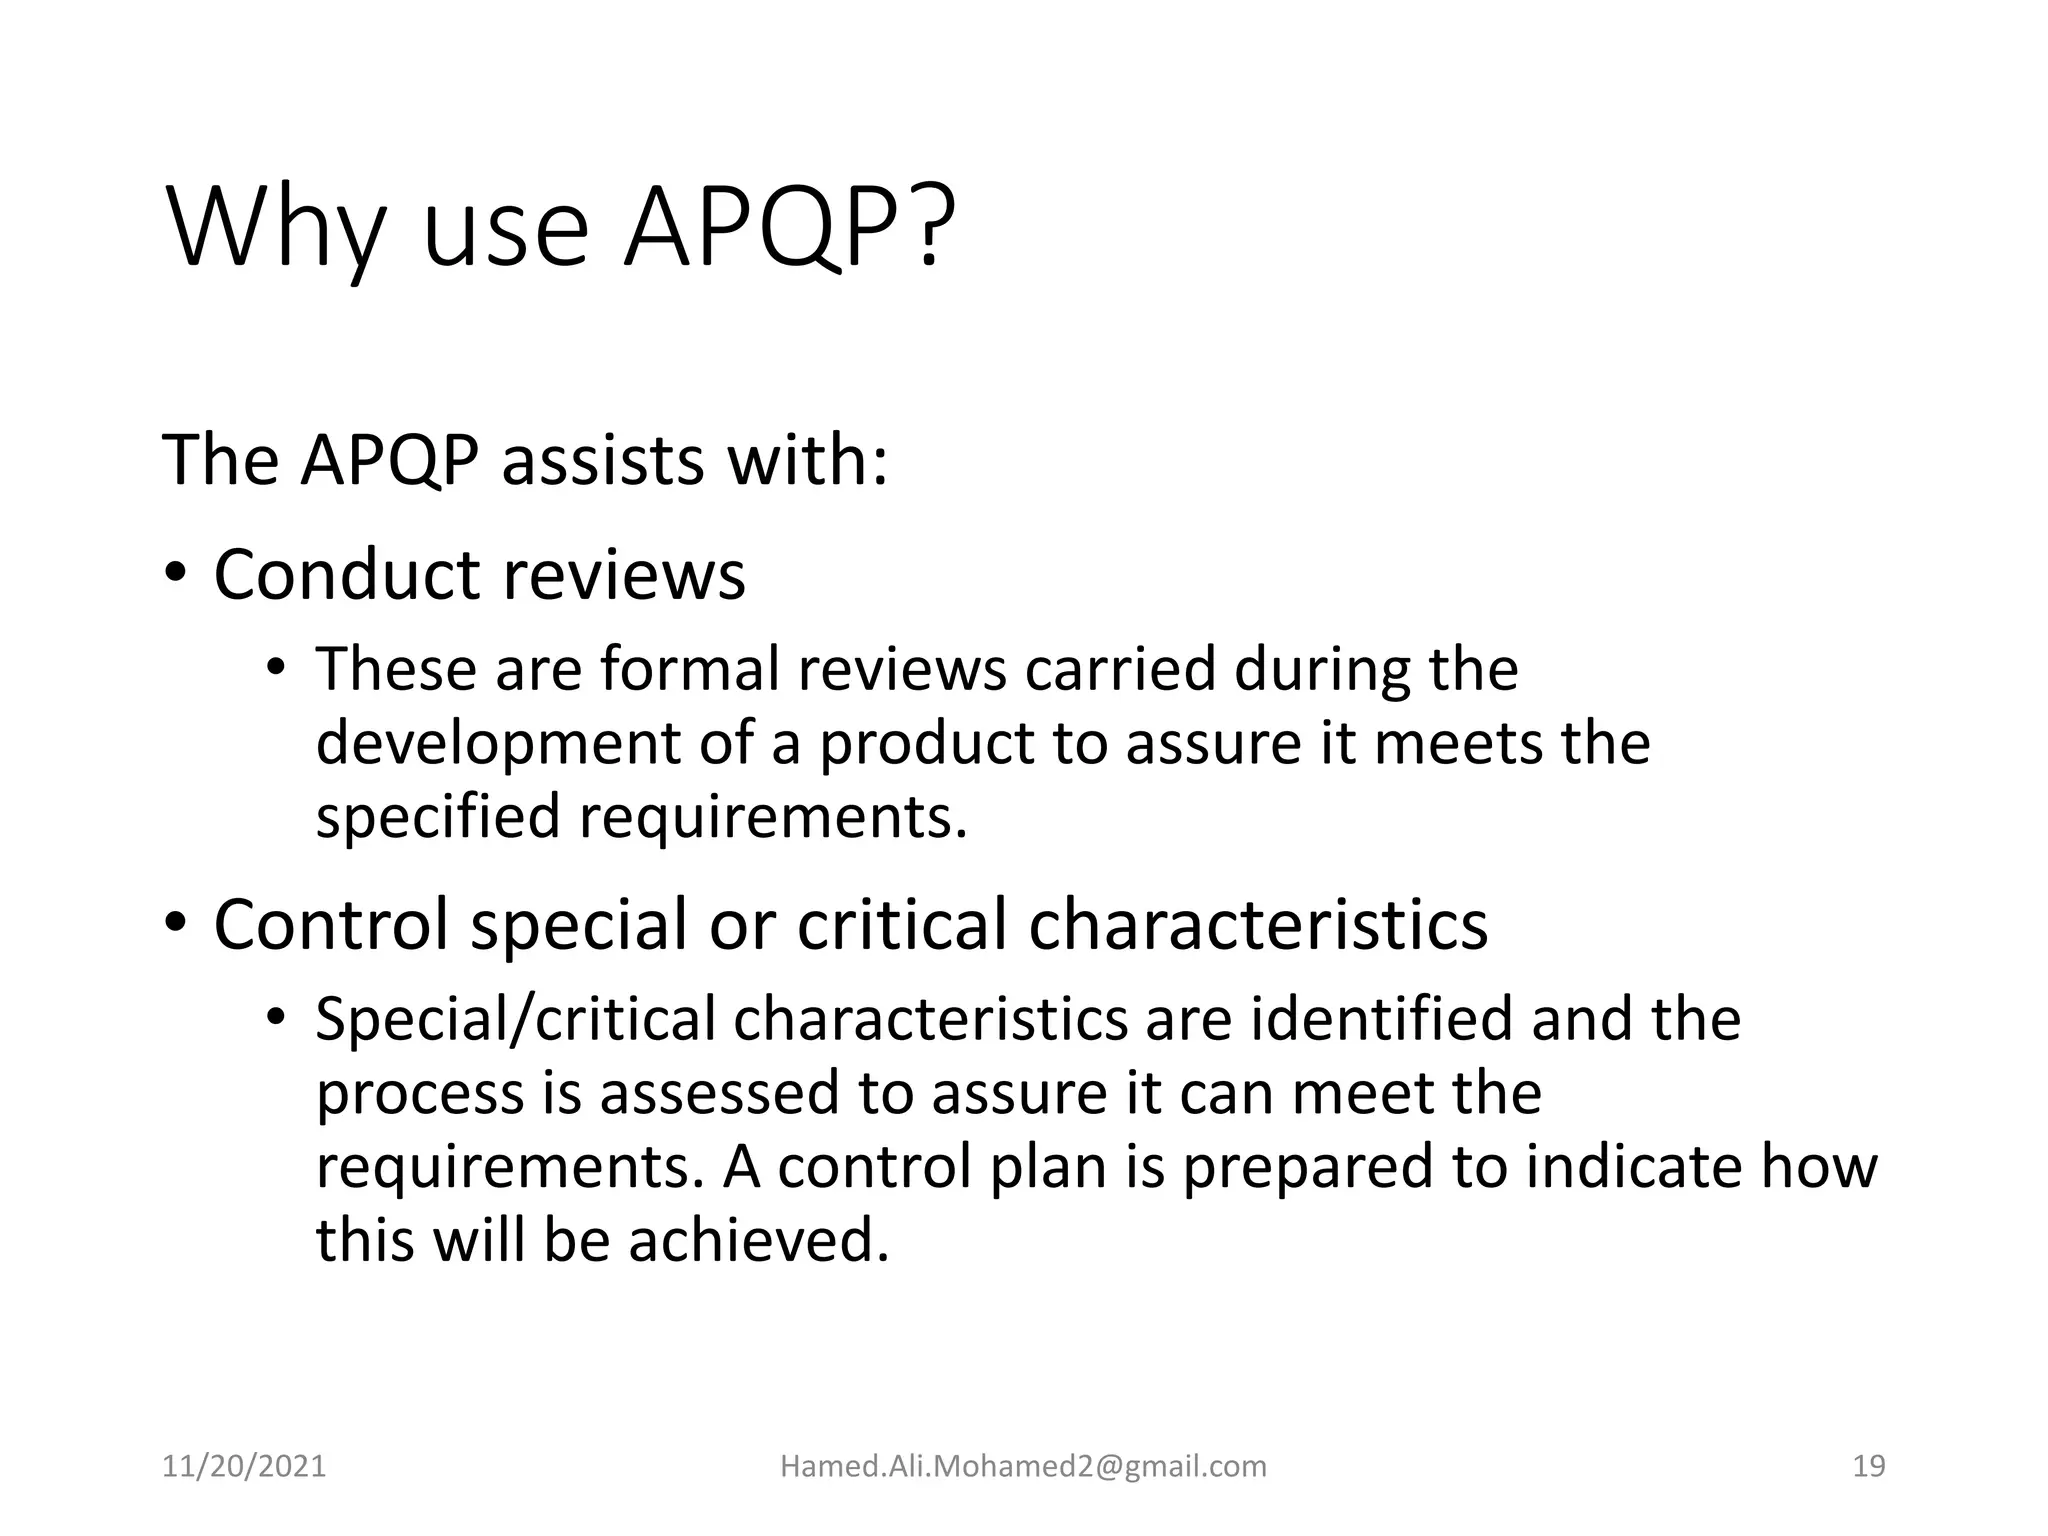
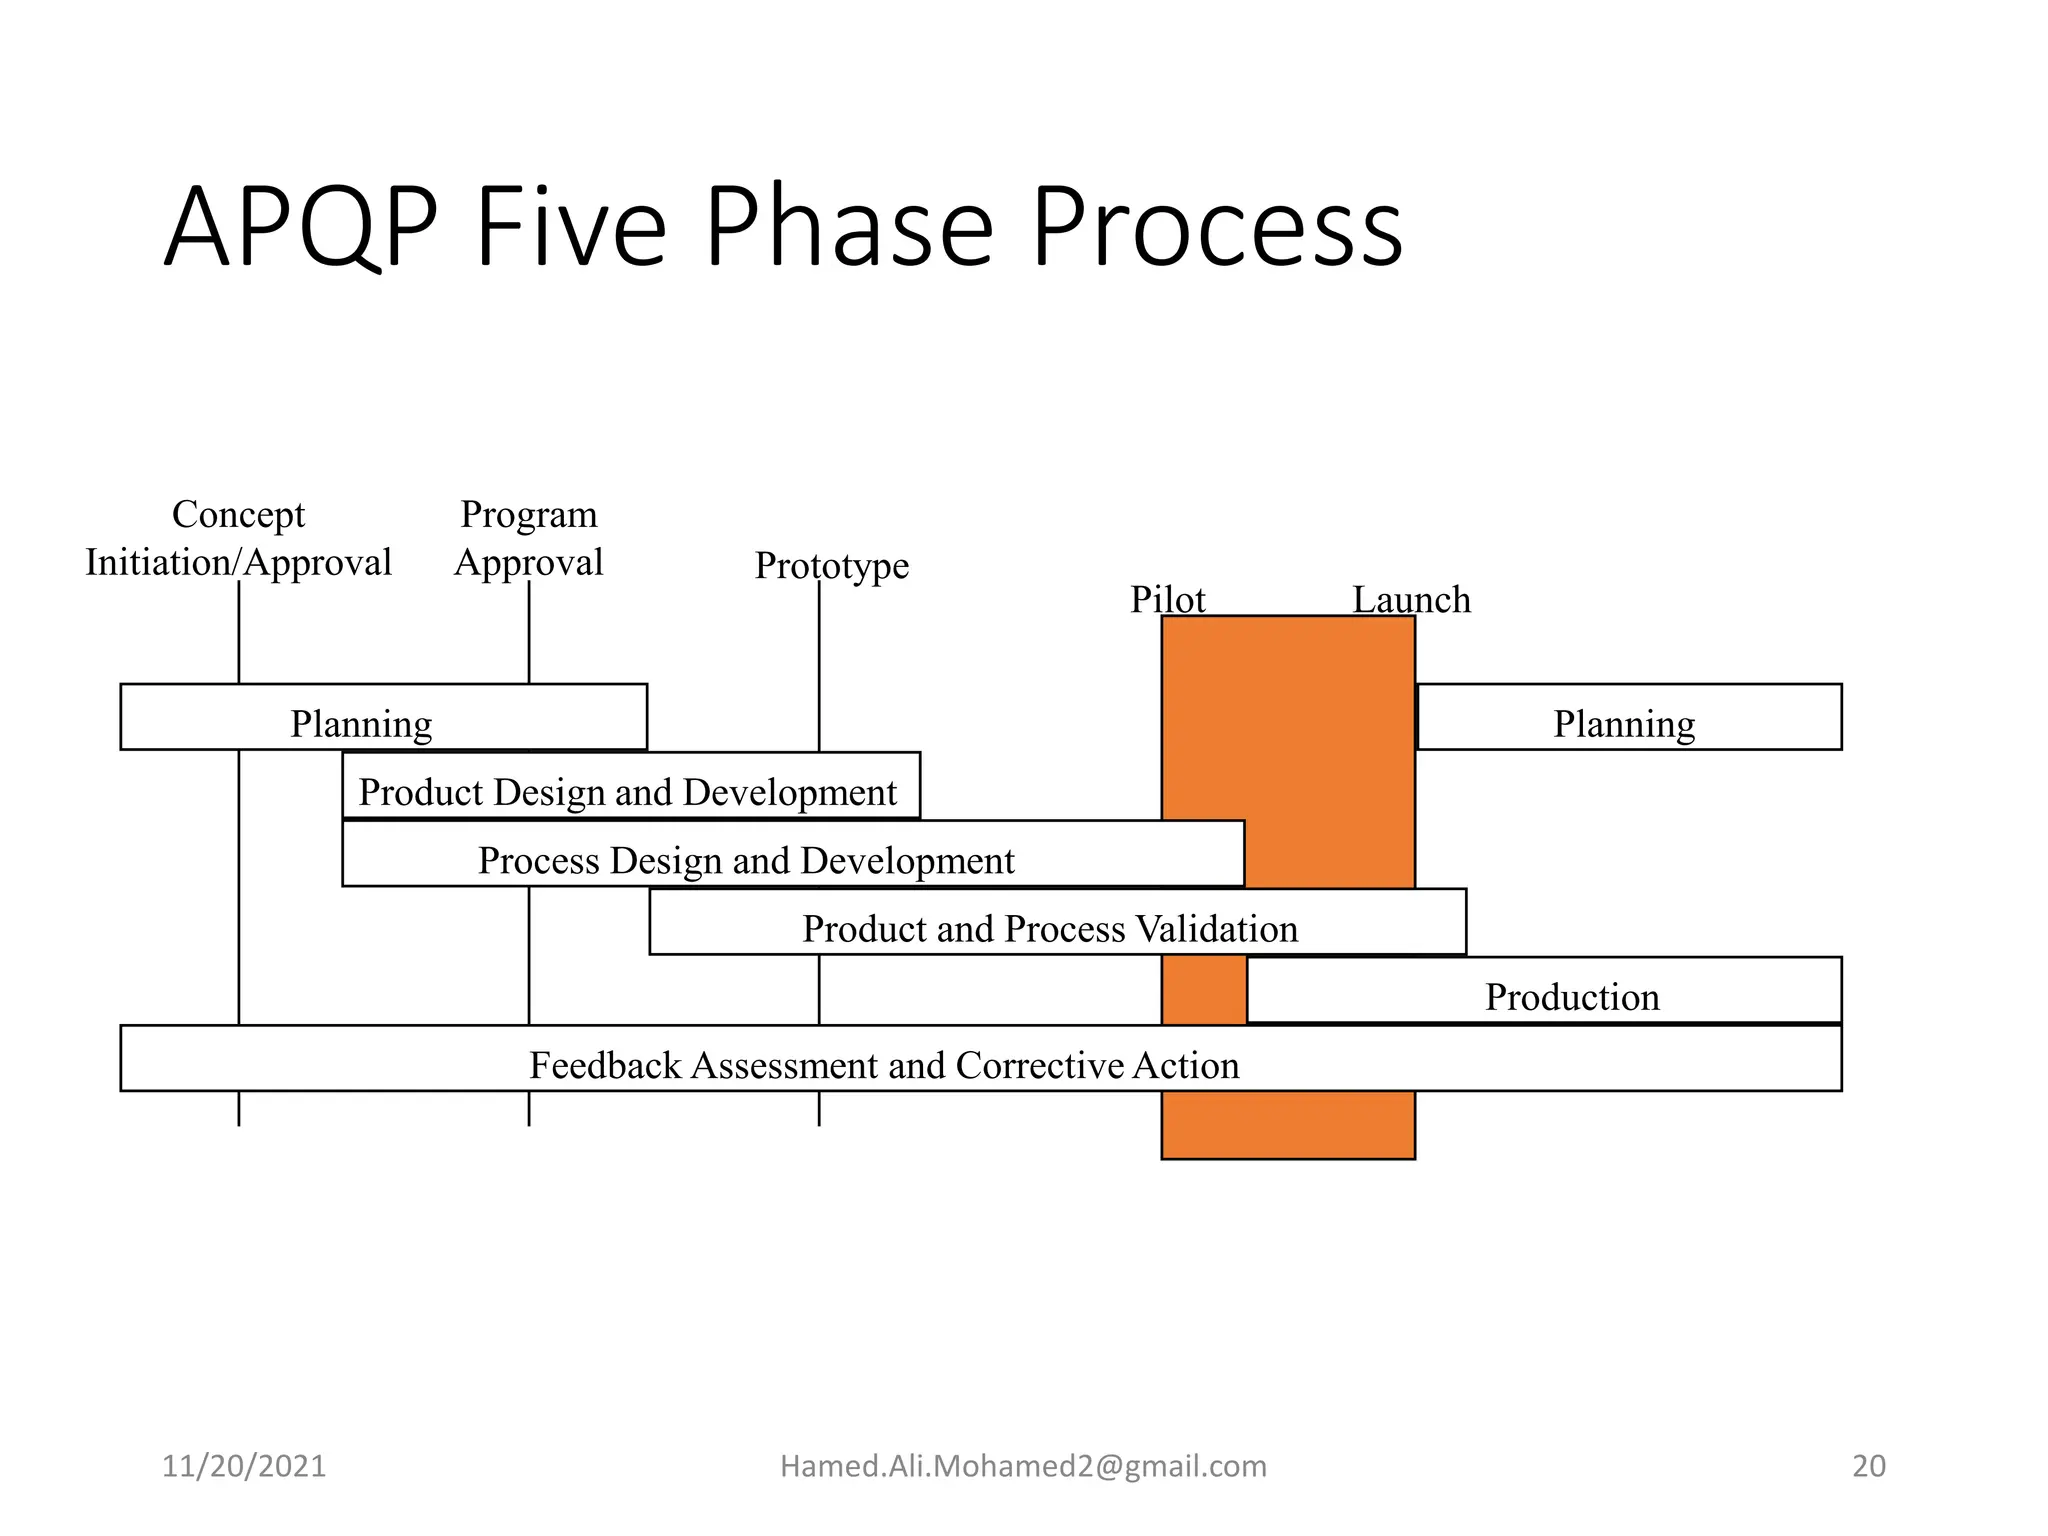
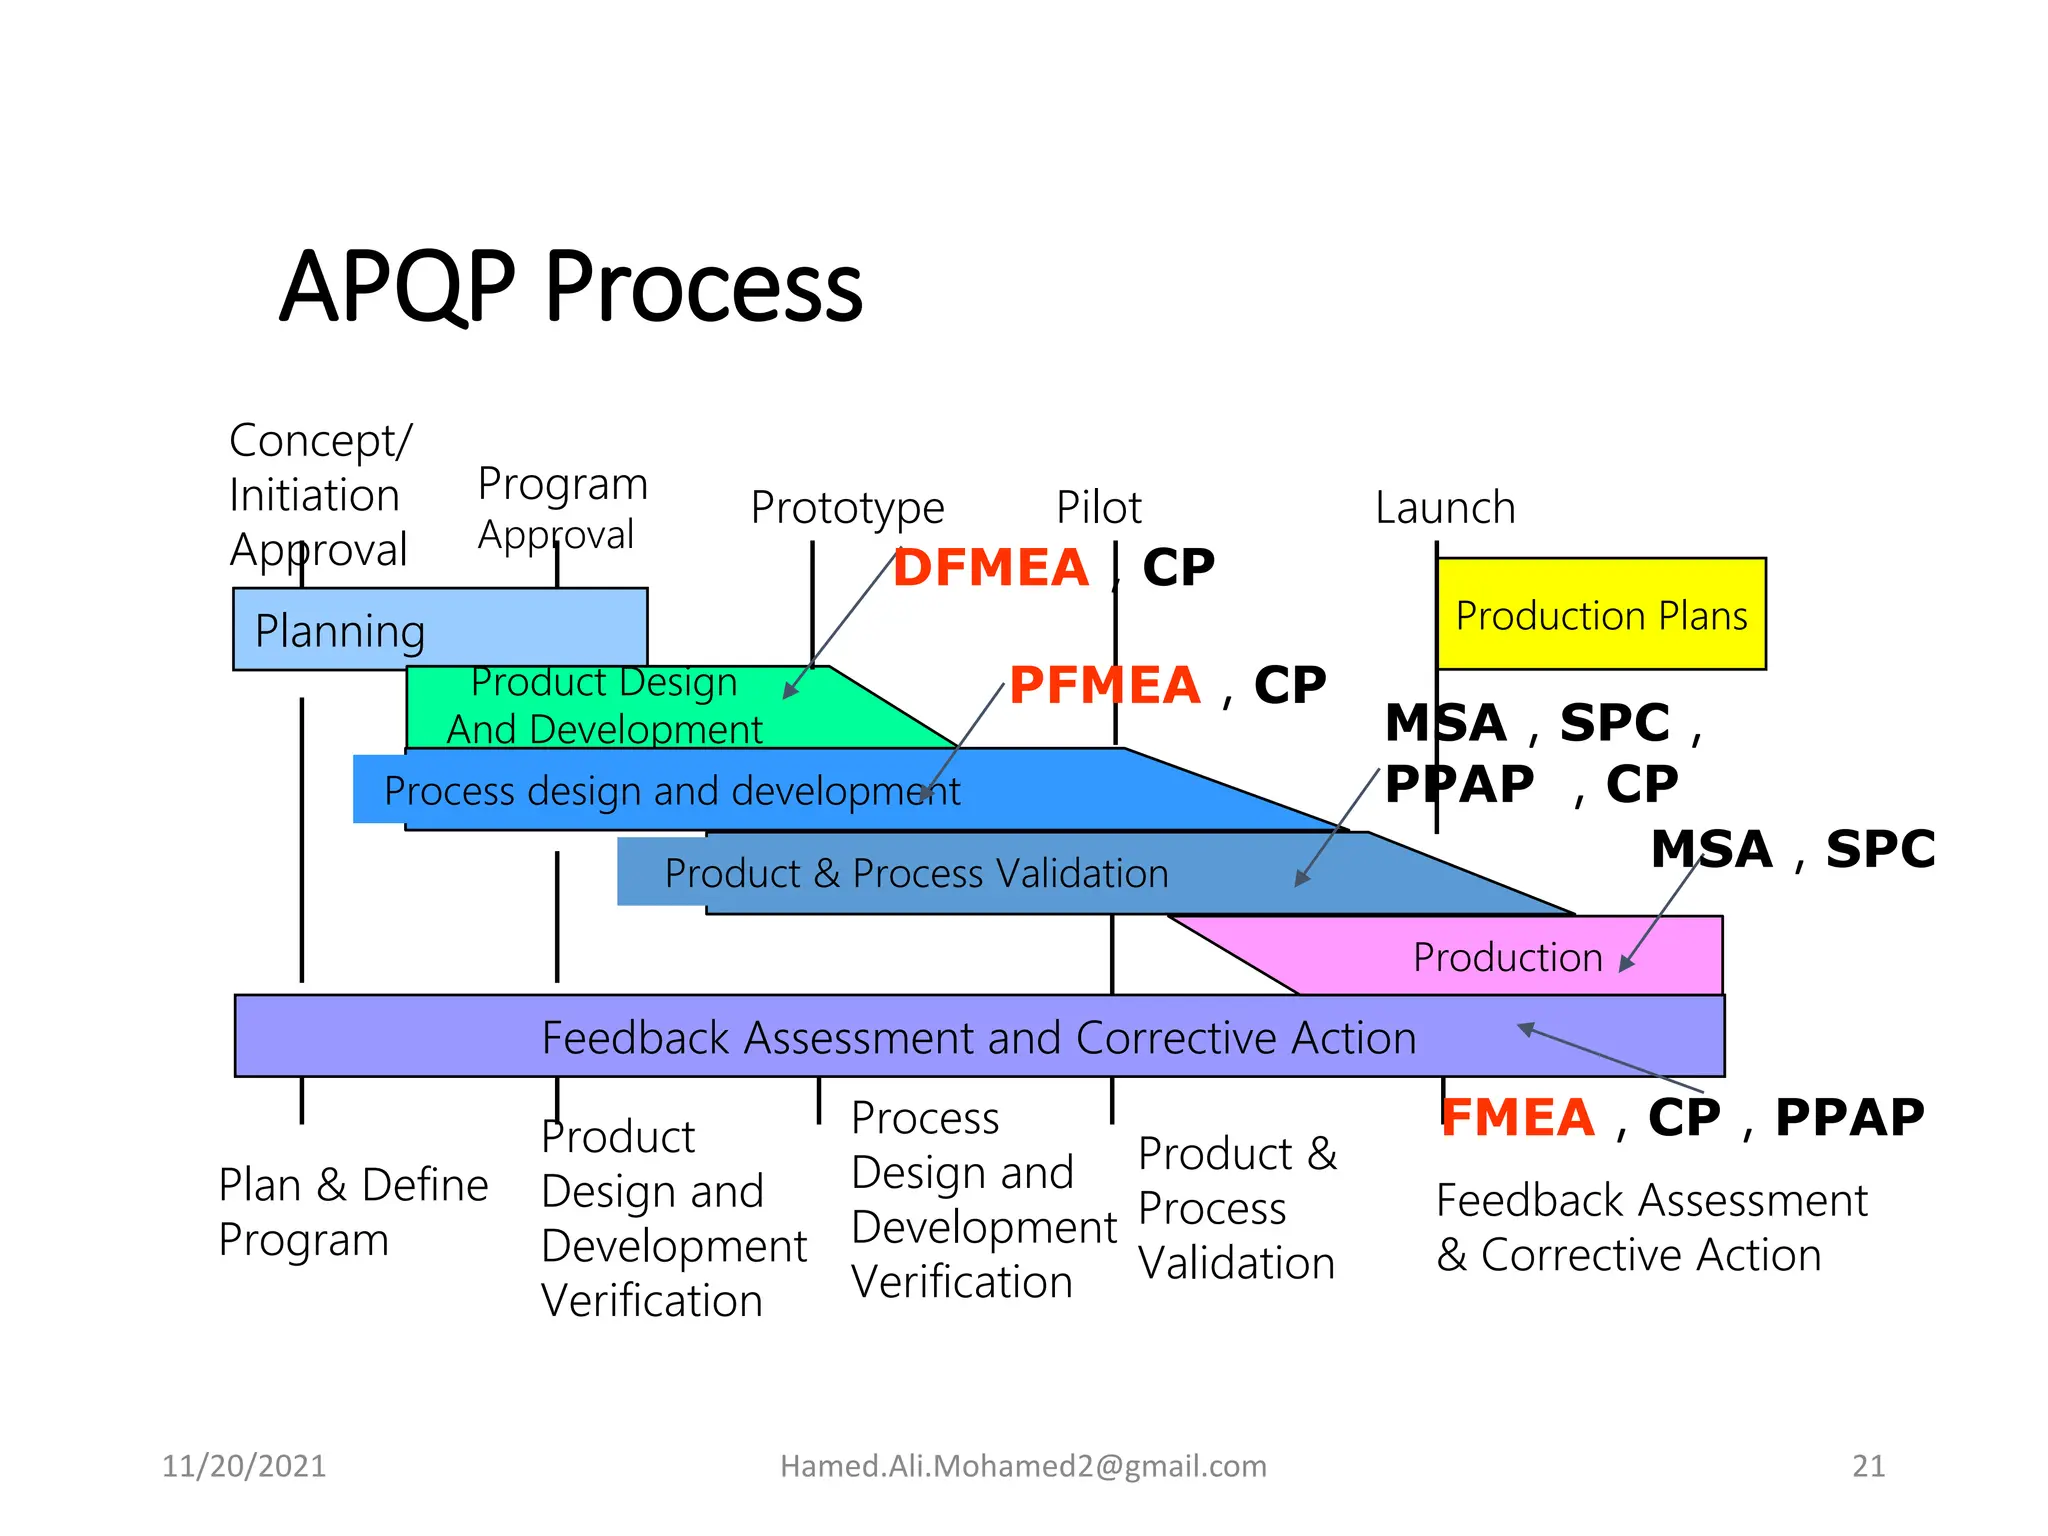
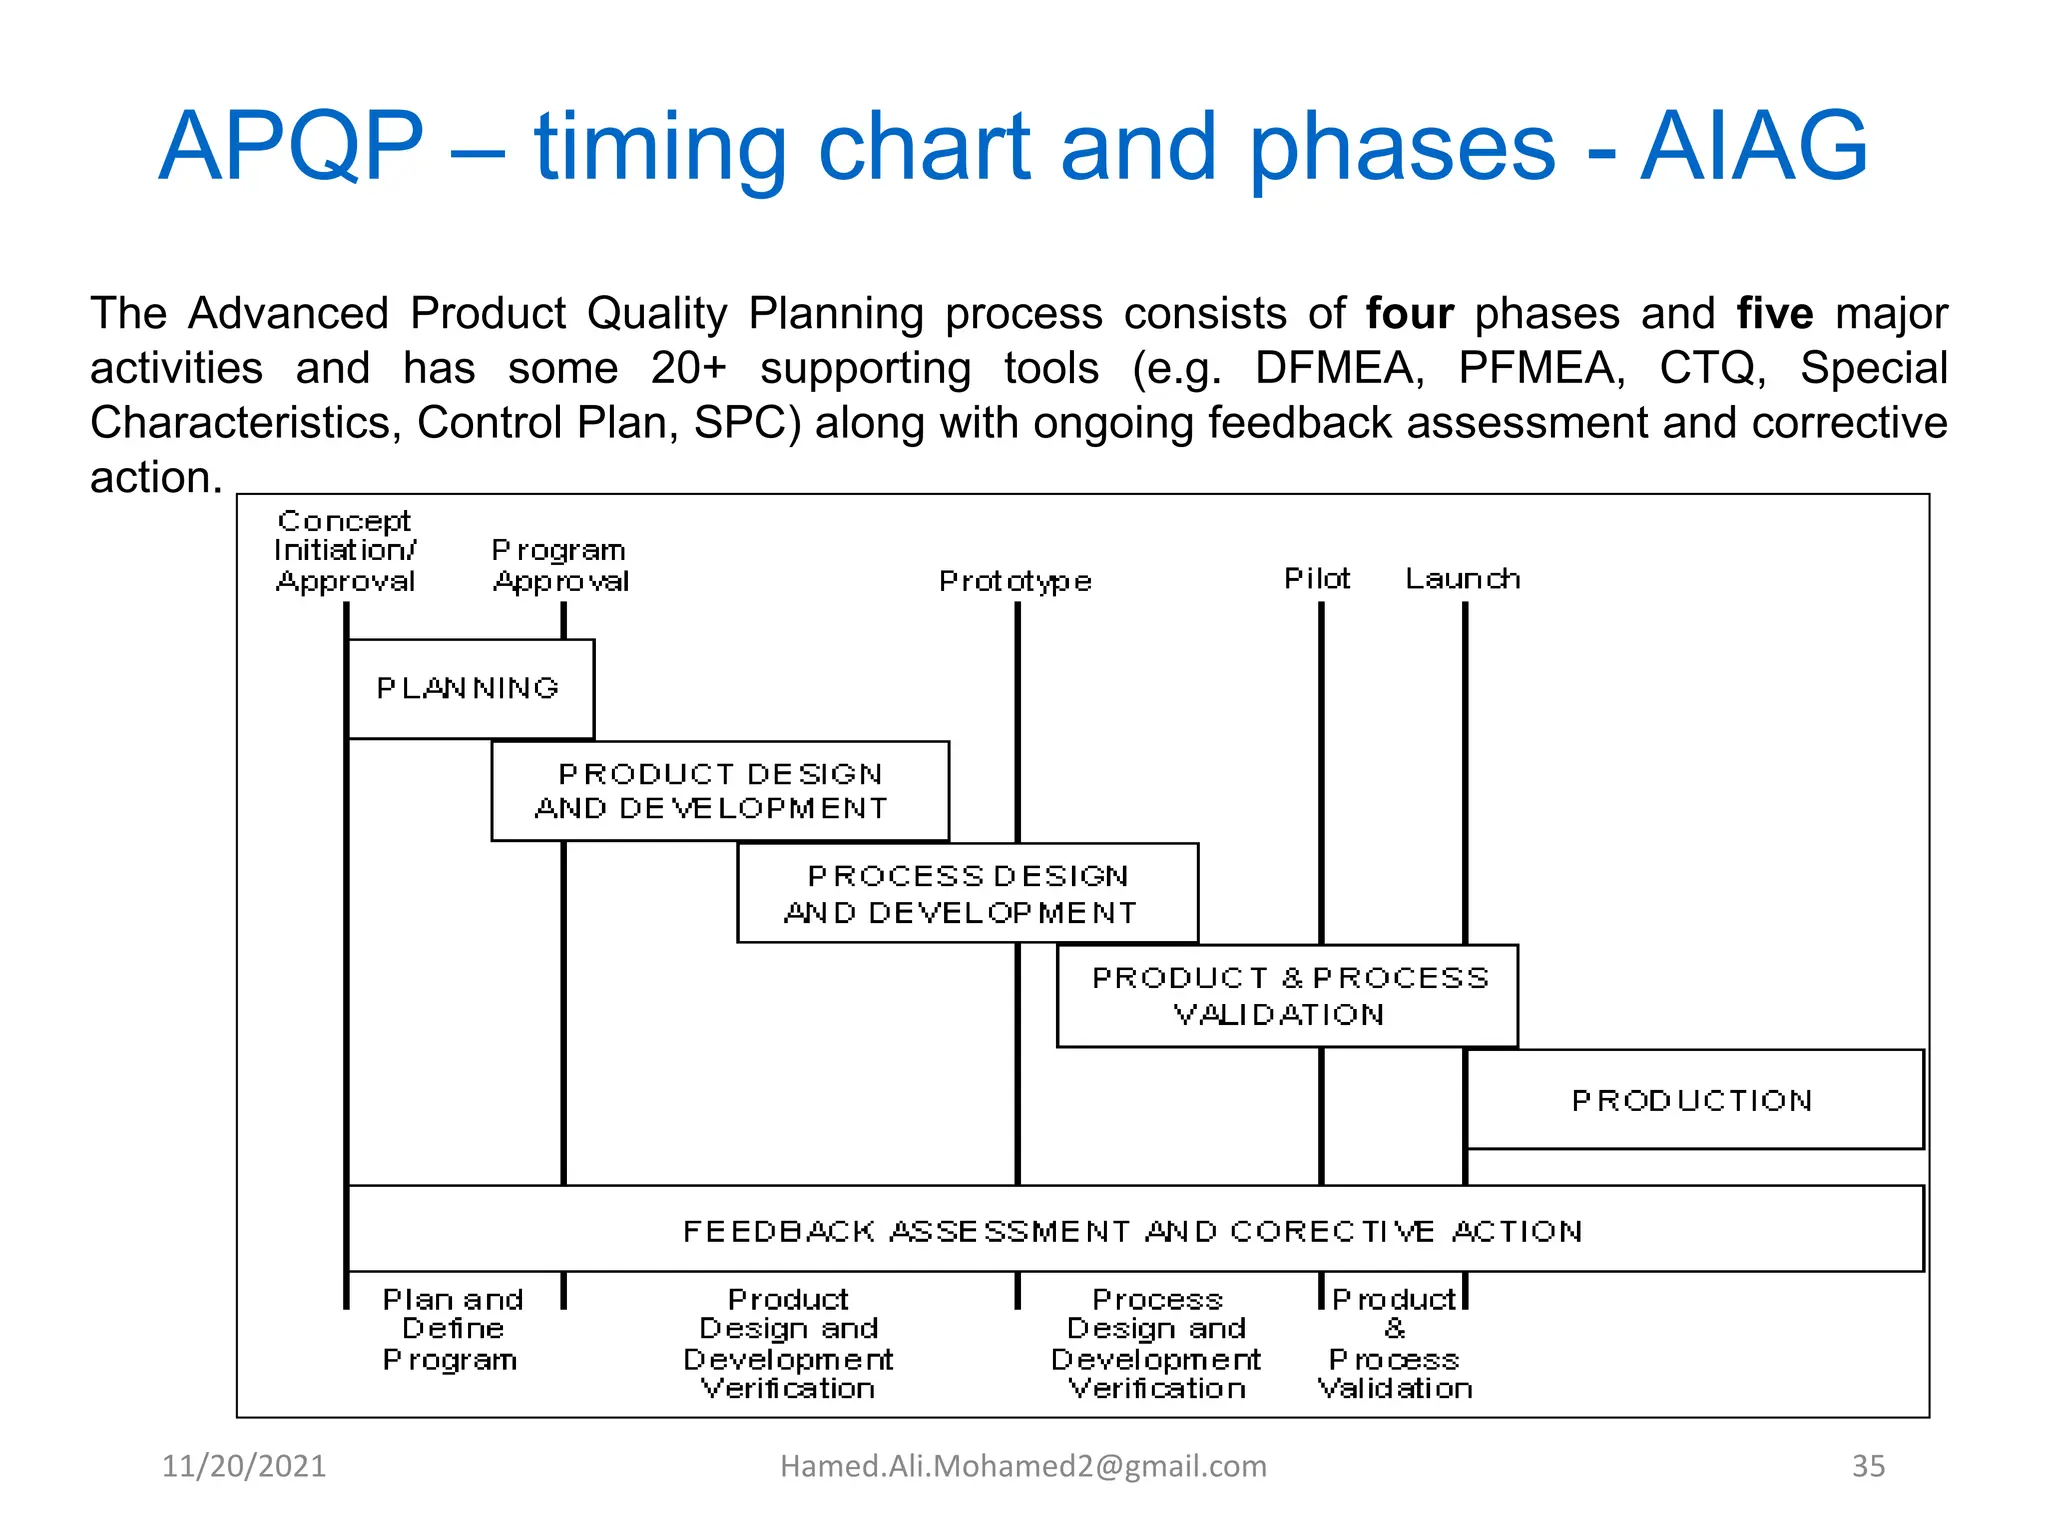
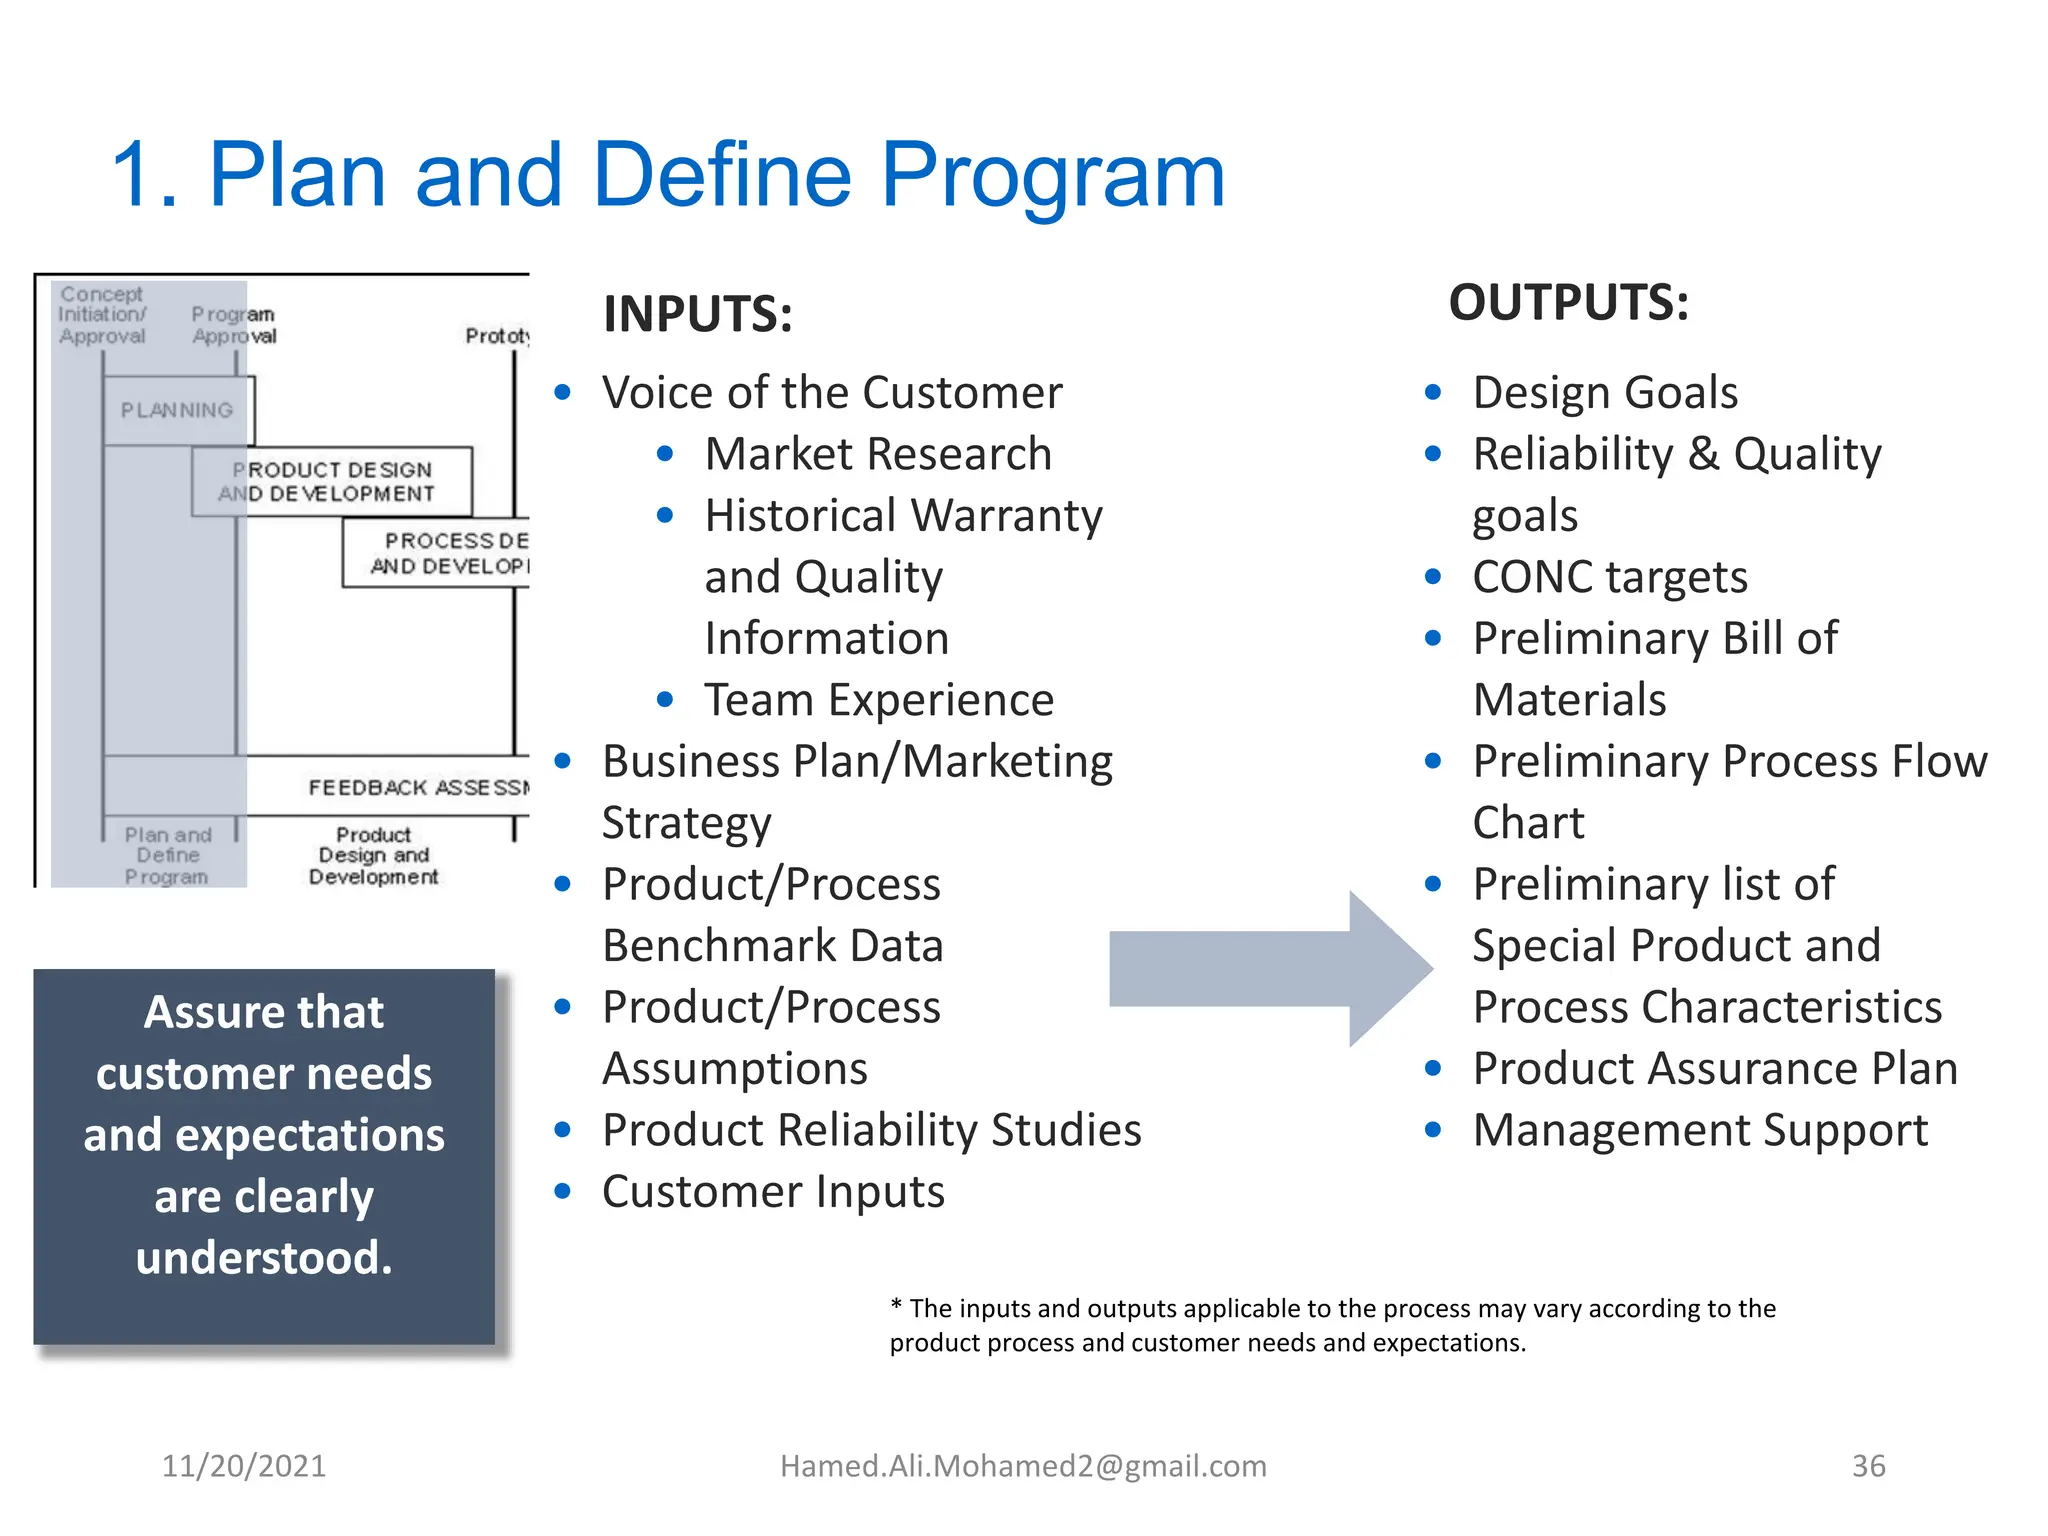
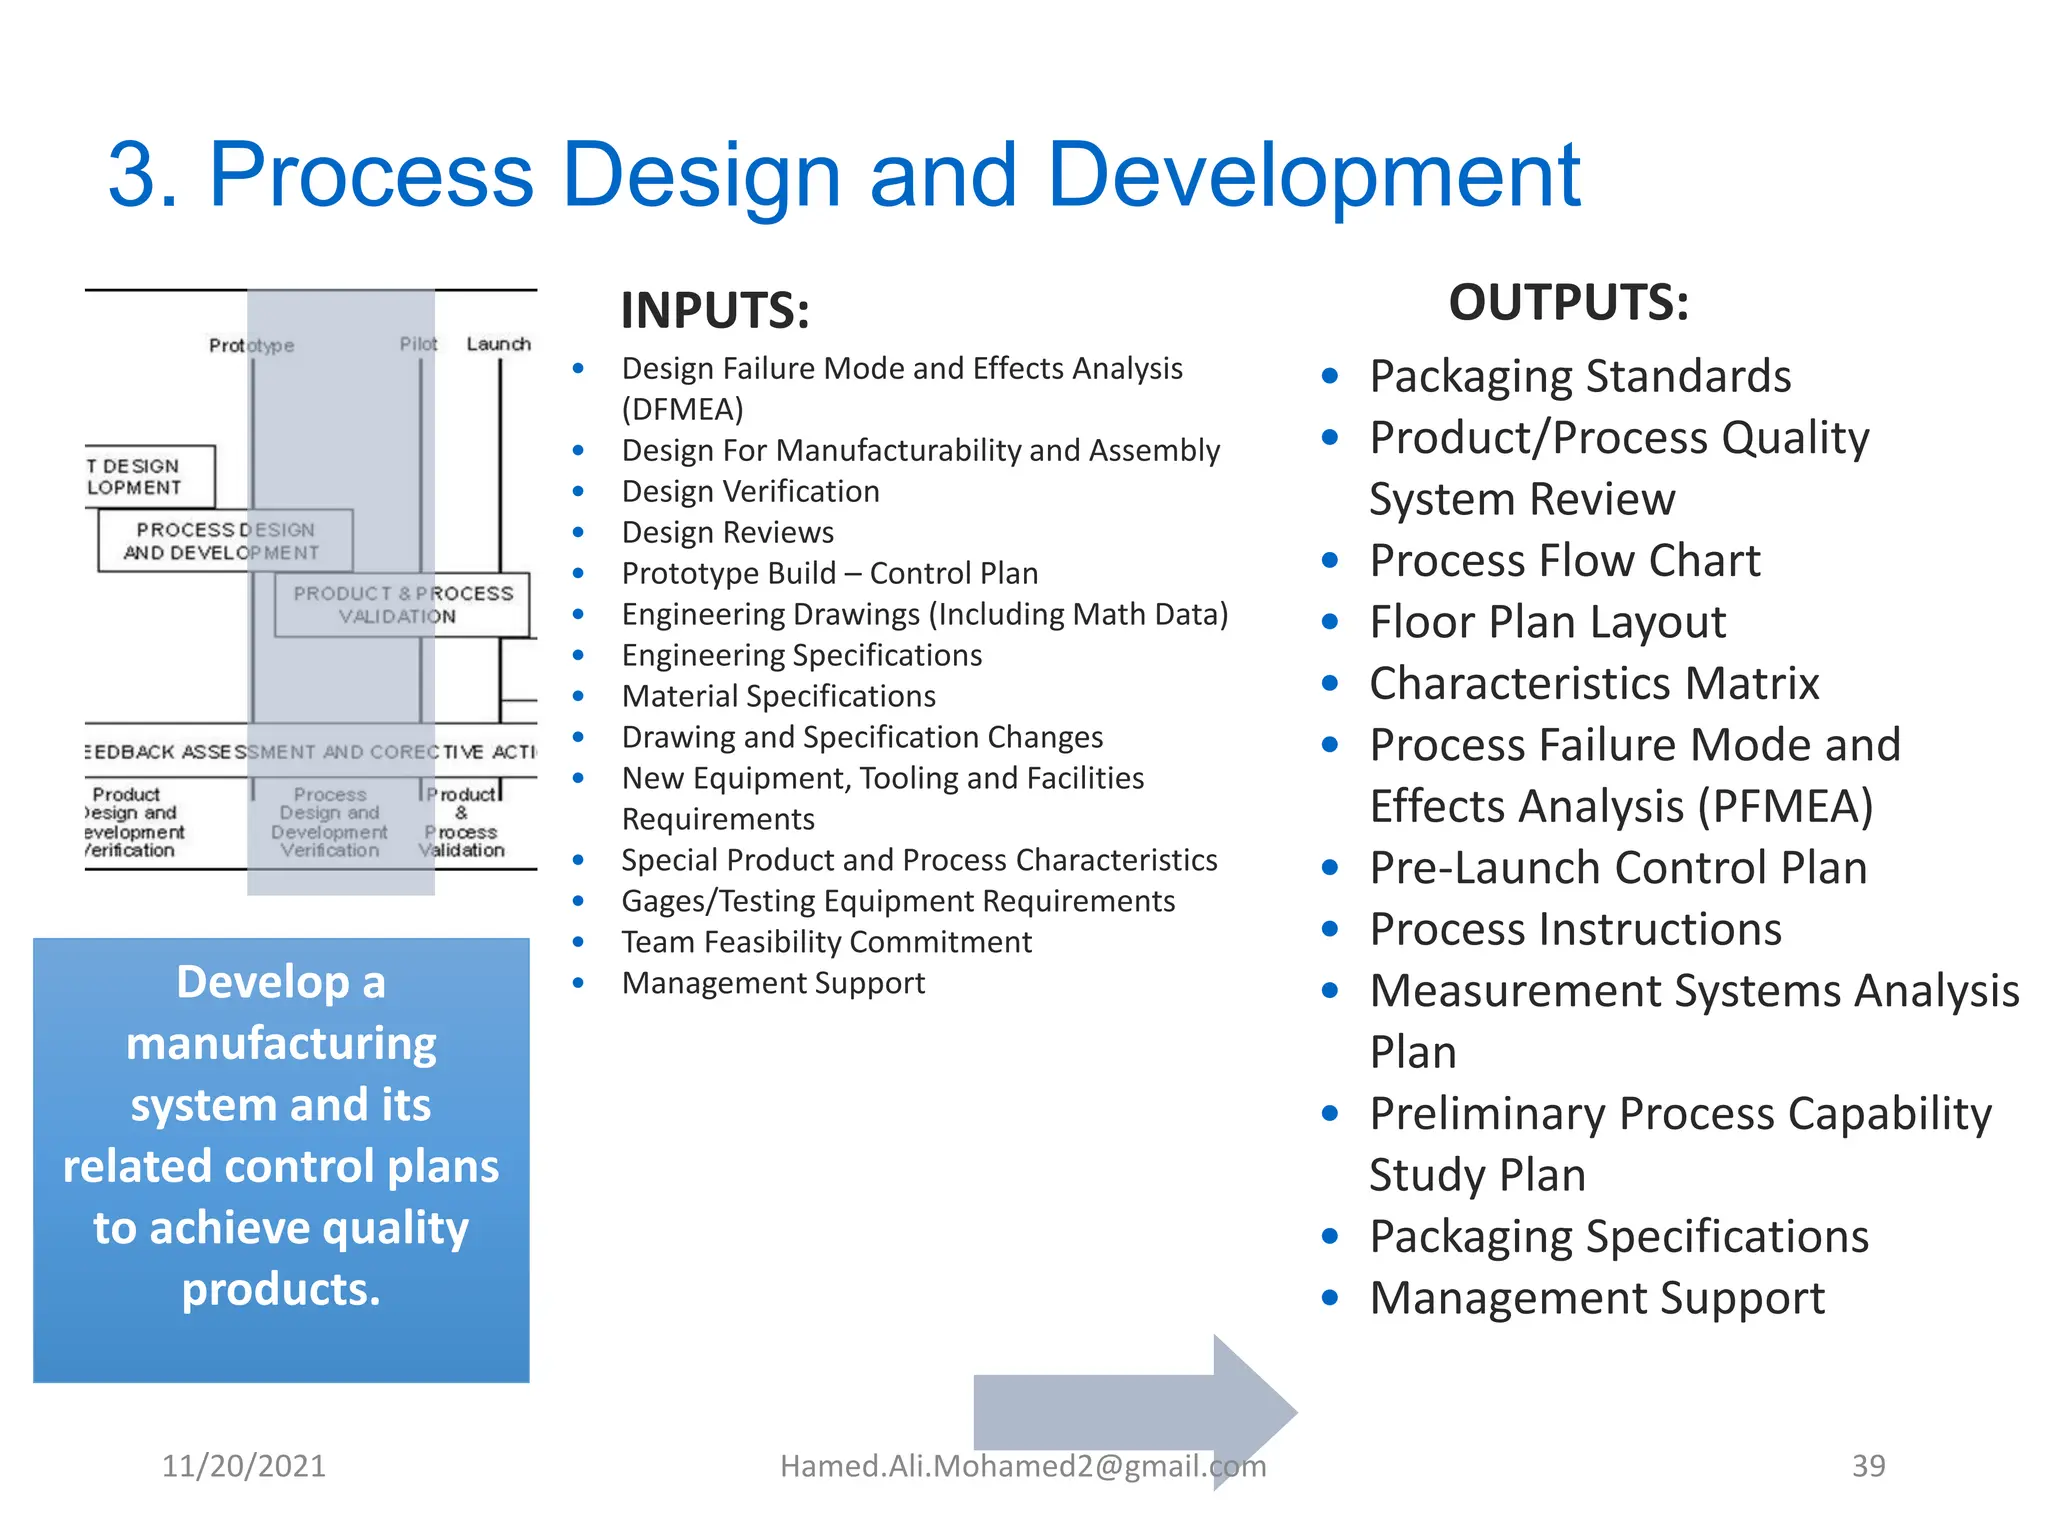
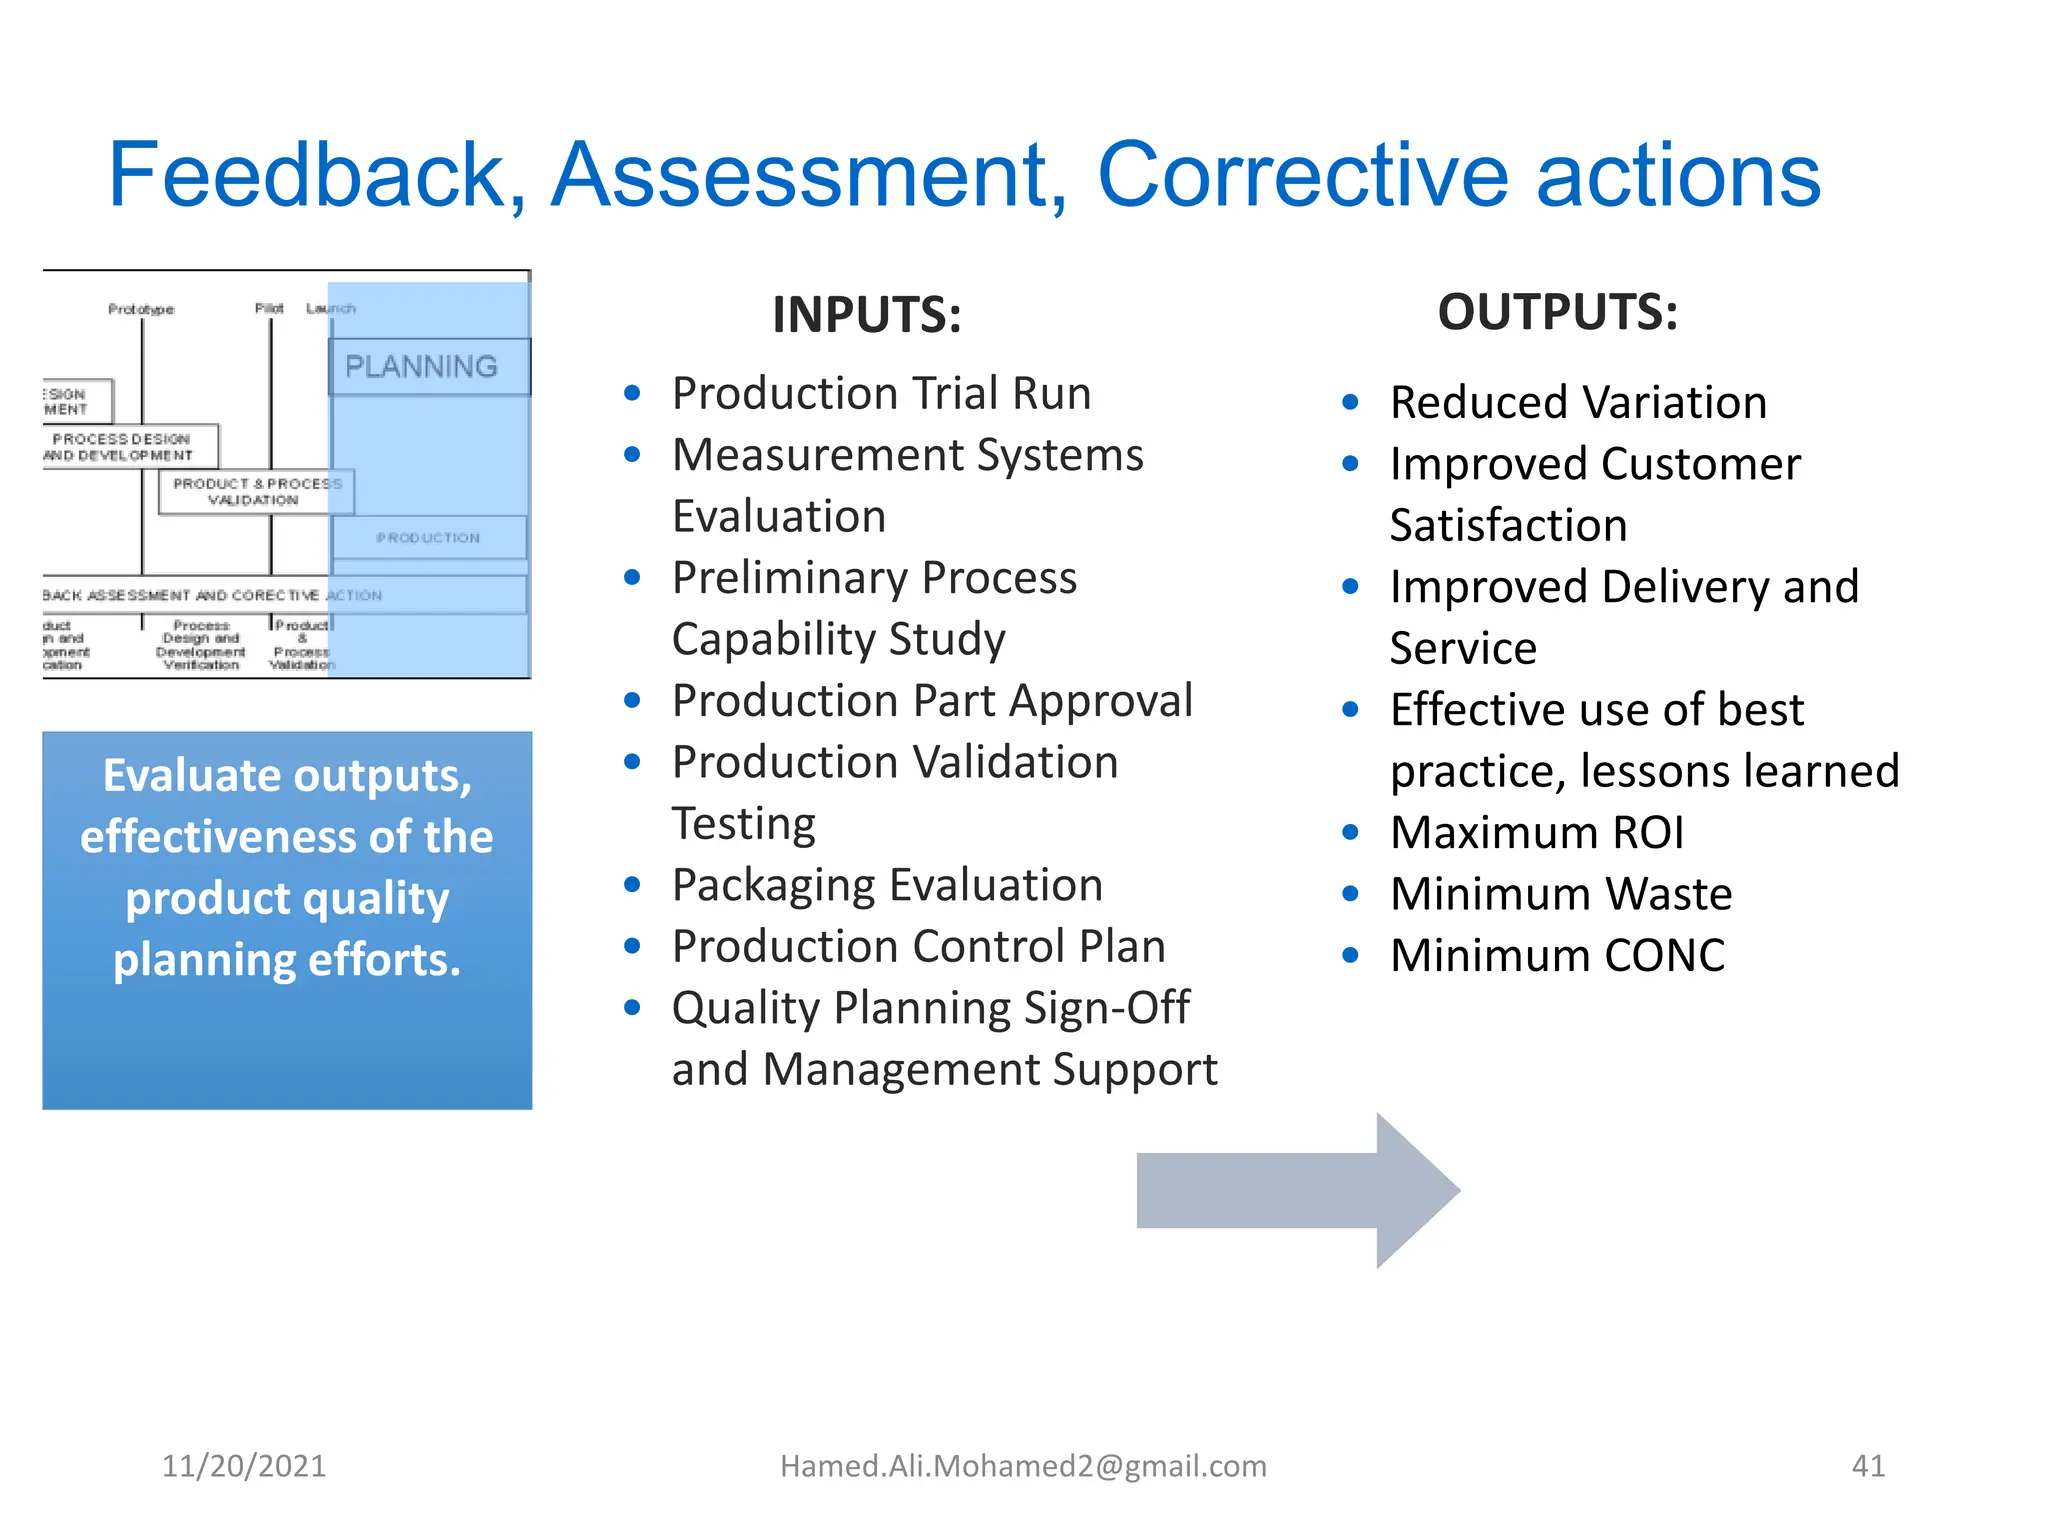
2. Advanced Product Quality
Planning Cycle
• Advanced Product Quality Planning
method to assure that a product satisfies
the customer (both internal and external)
• The goal of APQP is to:
• Plan before acting
• Anticipate and prevent issues
• Validate before moving forward
• Facilitate communication
What is APQP?
•Each Advanced Product Quality Plan is unique and is a living document
•Particular emphasis should be placed on identifying critical path activities and
ensuring those are fully resourced
11/20/2021 Hamed.Ali.Mohamed2@gmail.com 2
3. APQP| WHAT IS IT?
A structured methodology for the design and development
of new and modified products from concept through to
production
It provides a set of detailed requirements to be
undertaken at each stage in the APQP system
It involves the utilization of various techniques to be
employed to identify and resolve problems before going
into full production
4. The goal is to facilitate communication
with everyone involved to assure that all
required steps are completed on time.
Effective planning depends on a company’s
top management commitment to
achieving customer satisfaction.
APQP| WHAT IS IT?
5. Process Design & Development
Product Design & Dev.
APQP Timing Chart
Concept Program
Initiation/Approval Approval Prototype Pilot Launch
Planning
Product & Process Validation
Planning
Production
Feedback Assessment and Corrective Action
Plan & Define
Program
Product Design &
Development
Verification
Process Design
& Development
Verification
Product &
Process
Validation
Feedback
Assessment &
Corrective
action
6. PHASE 2
PHASE 3
PHASE 4
PHASE 1
PHASE 5
APQP
PLANNING
PHASE 1
Process Design & Development
Product Design & Dev.
Concept Program
Initiation/Approval Approval Prototype Pilot Launch
Planning
Product & Process Validation
Planning
Production
Feedback Assessment and Corrective Action
Plan & Define
Program
Product Design
& Development
Verification
Process
Design &
Developmen
t Verification
Product &
Process
Validation
Feedback
Assessment
& Corrective
action
7. PHASE 1 |PLANNING
Phase 1 Inputs Phase 1 Outputs
PLANNING
• Voice of the costumer
• Market Research
• Historical Warranty
and Quality
Information
• Team Experience
• Business Plan/MKT
Strategy
• Product/process
Assumptions
• Product Reliability Studies
• Cuctomer Inputs
•Design Goals
•Reliability & Quality Goals
•Preliminary Process Flow
Chart
•Preliminary Listing of
special Product & Process
Characteristics
•Product Assurance Plan
•Management Support
8. PHASE 3
PHASE 4
PHASE 1
PHASE 5
APQP
PHASE 2
Process Design & Development
Product Design & Dev.
APQP Phase 2: Product Design & Dev.
Concept Program
Initiation/Approval Approval Prototype Pilot Launch
Planning
Product & Process Validation
Planning
Production
Feedback Assessment and Corrective Action
Plan & Define
Program
Product Design
& Development
Verification
Process
Design &
Developmen
t Verification
Product &
Process
Validation
Feedback
Assessment
&
Corrective
action
9. PHASE 2 |PRODUCT DESIGN & DEVELOPMENT
Phase 2 Inputs Phase 2 Outputs
PRODUCT &
DESIGN
DEVELOPMENT
•Design Goals
•Reliability & Quality
Goals
•Preliminary Bill of
Material
•Preliminary Listing of
Special Product & Process
Characteristic
•Product Assurance Plan
•Management Support
•Design FMEA
•Design for
Manufactturability and
assembly
•Design Verification
•Design Reviews
•Prototype CP
•Engineering Drawings
•Engineering
Spesifications
•Material Spesifications
•Drawing & Spec. Changes
10. PHASE 2 |PROCESS DESIGN & DEVELOPMENT
Phase 2 Inputs Phase 2 Outputs
PROCESS
DESIGN &
DEVELOPMENT
•Design Goals
•Reliability & Quality
Goals
•Preliminary Bill of
Material
•Preliminary Listing of
Special Product & Process
Characteristic
•Product Assurance Plan
•Management Support
•New equipment, Tooling
and Facilities Requirement
•Special Product and Process
Characterictics
•Gages/Testing Equipment
Requirements
•Team Feasibility
Commitment and
Management Support
11. PHASE 2
PHASE 3
PHASE 4
PHASE 1
PHASE 5
APQP
PHASE 3
Process Design & Development
Product Design & Dev.
Concept Program
Initiation/Approval Approval Prototype Pilot Launch
Planning
Product & Process Validation
Planning
Production
Feedback Assessment and Corrective Action
Plan & Define
Program
Product Design
&
Development
Verification
Process
Design &
Developmen
t
Verification
Product &
Process
Validation
Feedback
Assessment
&
Corrective
action
APQP Phase 3: Process Design & Validation
12. PHASE 3 |PROCESS DESIGN & DEVELOPMENT
•Packaging Standards & Specs.
•Prod/Proc. Quality System Review
•Process Flow Chart
•Floor Plan Layout
•Characteristics Matrix
•PFMEA
•Pre-launch CP
•Process Instructions
•MSA Plan
•Preliminary Process Capability
Study Plan
•Management Support (including
operator staffing & training plan)
Phase 3 Outputs
Phase 2 Design
Outputs
Phase 2 APQP
Outputs
Process Design &
Development
Phase 3 Inputs
13. PHASE 2
PHASE 3
PHASE 4
PHASE 1
PHASE 5
APQP
PHASE 4
Process Design & Development
Product Design & Dev.
APQP Phase 4: Product & Process Validation
Concept Program
Initiation/Approval Approval Prototype Pilot Launch
Planning
Product & Process Validation
Planning
Production
Feedback Assessment and Corrective Action
Plan & Define
Program
Product Design
& Development
Verification
Process
Design &
Developmen
t Verification
Product &
Process
Validation
Feedback
Assessment
&
Corrective
action
14. PHASE 4 |Product & Process Validation
Phase 4 Inputs Phase 4 Outputs
Product and
Process
Validation
•Significant production Run
•Measurement Systems
Evaluations
•Preliminary Process Capability
Study
•PPAP
•Production Validation
•Testing
•Packaging Evaluation
•Production CP
•Quality Planning Sign off and
management Support
•Packaging Standards & Specs.
•Prod/Proc. Quality System
Review
•Process Flow Chart
•Floor Plan Layout
•Characterictics Matrix
•PFMeA
•Pre –Launch CP
•Process Instructions
•MSA Plan
•Preliminary process Capability
Study Plan
•Management support (including
operator staffing & training plan)
15. s
PHASE 2
PHASE 3
PHASE 4
PHASE 1
PHASE 5
APQP
PHASE 5
Process Design & Development
Product Design & Dev.
Feedback Assessment & Corrective Action
Concept Program
Initiation/Approval Approval Prototype Pilot Launch
Planning
Product & Process Validation
Planning
Production
Feedback Assessment and Corrective Action
Plan &
Define
Program
Product Design
&
Development
Verification
Process
Design &
Developme
nt
Verification
Product &
Process
Validation
Feedback
Assessmen
t &
Corrective
action
16. APQP Background
• Automotive industry challenges:
• Innovation, more complex product
• Reduce NPD times
• Complicated Supply chain
• Increasing customer and quality requirements
• Solution:
• Ford, GM, Chrysler APQP Task Force jointly developed in the
late 80’s to standardize their respective supplier quality
systems.
• Continuous Improvement:
• Many industries outside the Automotive industry have
embraced the AIAG APQP process to achieve similar benefits
11/20/2021 Hamed.Ali.Mohamed2@gmail.com 16
17. Objectives
Advanced product quality planning (APQP) is a
system used for designing a quality product that
meets the customers needs.
APQP can be applied to any industry.
Its purpose is to produce a quality plan which
supports the development of a product or service
that will satisfy the customer.
11/20/2021 Hamed.Ali.Mohamed2@gmail.com 17
18. Why use APQP?
The APQP assists with:
• Understanding the customer needs
• Determine customer needs and translate into product
characteristics and requirements.
• Proactive feedback and corrective action
• Provides other feedback for similar projects with the objective of
developing solutions for potential failures.
• Ensuring that the design is within your process capabilities
• This brings the processes under statistical control and
ensures that your manufacturing process can meet
customer requirements and quantities.
11/20/2021 Hamed.Ali.Mohamed2@gmail.com 18
19. Why use APQP?
The APQP assists with:
• Conduct reviews
• These are formal reviews carried during the
development of a product to assure it meets the
specified requirements.
• Control special or critical characteristics
• Special/critical characteristics are identified and the
process is assessed to assure it can meet the
requirements. A control plan is prepared to indicate how
this will be achieved.
11/20/2021 Hamed.Ali.Mohamed2@gmail.com 19
20. APQP Five Phase Process
Planning
Product Design and Development
Process Design and Development
Product and Process Validation
Production
Feedback Assessment and Corrective Action
Pilot Launch
Concept
Initiation/Approval
Program
Approval Prototype
Planning
11/20/2021 Hamed.Ali.Mohamed2@gmail.com 20
21. APQP Process
Planning
Product Design
And Development
Process design and development
Product & Process Validation
Feedback Assessment and Corrective Action
Production
Production Plans
Plan & Define
Program
Product
Design and
Development
Verification
Process
Design and
Development
Verification
Product &
Process
Validation
Feedback Assessment
& Corrective Action
Concept/
Initiation
Approval
Program
Approval
Prototype Pilot Launch
DFMEA,CP
PFMEA,CP
MSA,SPC,
PPAP ,CP
MSA,SPC
FMEA,CP,PPAP
11/20/2021 Hamed.Ali.Mohamed2@gmail.com 21
22. Phases 2 and 3
• Phase 2 - Design
• Objectives
• Develop design features
and characteristics
• Critically review
engineering requirements
• Assess potential
manufacturing problems
• Outputs by Design
Responsibility Activity
• Outputs by Advanced
Product Quality Planning
Team
• Phase 3 - Process
• Objectives
• Develop a comprehensive and
effective manufacturing
system
• Ensure that the manufacturing
systems meet customer
requirements
• Outputs
11/20/2021 Hamed.Ali.Mohamed2@gmail.com 22
23. Links Between the Tools
Contract Review
Program Plan
DFMEA
DVP&R and Team Feasibility
Commitment
Produce Process
Flow Diagrams
Conduct Process
FMEA
Develop
Control Plan
Work Instruction
Development
Product and
Process Validation
Ensure Continuous
Improvement
Phase I
Phase II
Phase II
Phase III
Phase III
Phase III
Phase III
Phase IV
Phase V
Determine Customer Expectations and Plan for Quality
Identify Key Characteristics
Determine Risk and Feasibility
Associate Characteristics with Process Steps and Identify Key Characteristics
Expose Sources of Variation and Finalize Key Characteristics
Determine Methods to Improve Process and Control Variation
Implement Control Plan and Standardize the Process
Ensure Customer Expectations are Met
Exercise Management Oversight
11/20/2021 Hamed.Ali.Mohamed2@gmail.com 23
24. How a PFMEA Works
• Where does the data for the PFMEA come from?
• What types of people are a part of the PFMEA
team?
• What types of activities should we spend a lot of
time on?
11/20/2021 Hamed.Ali.Mohamed2@gmail.com 24
25. Link Between the Documents
Process Flow
Operation Number
Product/Process
Characteristic
Incoming Sources
of Variation
PFMEA Control Plan
Variation Class
Work Instructions
11/20/2021 Hamed.Ali.Mohamed2@gmail.com 25
26. APQP Links to PFMEA
Work Instructions
PFMEA
Change in detection
Change in occurence
Change in severity
Control Plan
Design Change Other Action
or
or
or
or
11/20/2021 Hamed.Ali.Mohamed2@gmail.com 26
27. APQP Links to Control Plan
First/Last Piece
Mistake Proofing
Control Plan
Yearly Layout
P/M Checklist
Quality Checklist
11/20/2021 Hamed.Ali.Mohamed2@gmail.com 27
28. PFMEAs/Control Plans and 8-Ds During APQP
• PFMEAs should be driven by real data, including 8-Ds
(internal and external), warranty and returned pat analysis
• PFMEAs should be completed by process experts and should
be a driver of the control plans and work instructions
• Work instructions (Post control log, process parameter logs,
preventive maintenance, etc.) implement the control plan in
the process
• When there is a quality problem there is an opportunity to
improve the control plan and the work instructions
11/20/2021 Hamed.Ali.Mohamed2@gmail.com 28
29. Quality Problems
Update Control Plan and Plant Work Instructions
Corrective Action
Revisit PFMEA
Cause known?
Cause known?
Conduct D.O.E.
Cause known?
Conduct Disciplined Problem Solving
Customer Problem
Quality Problem Occurs
yes
no
no
yes
no
yes
n
o
yes
Hamed.Ali.Mohamed2@gmail.com 29
30. Cause unknown
• Use PFMEA
Note: When a customer problem occurs, follow customer prescribed methodology
11/20/2021 Hamed.Ali.Mohamed2@gmail.com 30
31. When to use 8-D
• When the cause is unknown
• When you need to get input from several parties
• When customers dictate use
Note: We use voting techniques, X to Y variable testing, and IS/IS Not to determine the root cause.
However, you still may not know what the root cause is?
11/20/2021 Hamed.Ali.Mohamed2@gmail.com 31
32. When to use Designed Experiments or
Regression
• After using 8-D, the cause is still unknown
• Designed experiments between cause and effect
voted by team could identify the vital few root
causes
• Semi-conductor companies collect product and
process information that could be used to identify
root cause using regression
11/20/2021 Hamed.Ali.Mohamed2@gmail.com 32
33. QS-9000 Semi-Conductor Supplement
• Conduct containment in 24 hours, electrical
verification in 48 hours and root cause and
corrective identification in ten days
• Complete returned product analysis
• Analyze the product in a qualified laboratory
• Make sure the corrective actions are effective
• Use the knowledge gained in similar processes and
products
11/20/2021 Hamed.Ali.Mohamed2@gmail.com 33
34. Update the PFMEA & Control
Plans
Process
Flow
PFMEA Control
Plan
Work
Instruction
Scrap, Rework Data
Warranty & Assembly Plant Data
After the 8-D is completed, the PMEA and the control plan should be revised and updated as
applicable
11/20/2021 Hamed.Ali.Mohamed2@gmail.com 34
35. The Advanced Product Quality Planning process consists of four phases and five major
activities and has some 20+ supporting tools (e.g. DFMEA, PFMEA, CTQ, Special
Characteristics, Control Plan, SPC) along with ongoing feedback assessment and corrective
action.
APQP – timing chart and phases - AIAG
11/20/2021 Hamed.Ali.Mohamed2@gmail.com 35
36. 1. Plan and Define Program
• Voice of the Customer
• Market Research
• Historical Warranty
and Quality
Information
• Team Experience
• Business Plan/Marketing
Strategy
• Product/Process
Benchmark Data
• Product/Process
Assumptions
• Product Reliability Studies
• Customer Inputs
INPUTS:
• Design Goals
• Reliability & Quality
goals
• CONC targets
• Preliminary Bill of
Materials
• Preliminary Process Flow
Chart
• Preliminary list of
Special Product and
Process Characteristics
• Product Assurance Plan
• Management Support
OUTPUTS:
Assure that
customer needs
and expectations
are clearly
understood.
* The inputs and outputs applicable to the process may vary according to the
product process and customer needs and expectations.
11/20/2021 Hamed.Ali.Mohamed2@gmail.com 36
37. 2. Product Design and Development - 1
• Design Failure Mode and Effects
Analysis (DFMEA)
• Design For Manufacturability and
Assembly
• Design Verification
• Design Reviews
• Prototype Build – Control plan
• Engineering Drawings (Including
Math Data)
• Engineering Specifications
• Material Specifications
• Drawing and Specification Changes
INPUTS:
• Design Goals
• Reliability & Quality
goals
• Preliminary Bill of
Materials
• Preliminary Process Flow
Chart
• Preliminary list of
Special Product and
Process Characteristics
• Product Assurance Plan
OUTPUTS:
Develop design into a
near final form.
Prototype and
feasibility studies –
volumes, schedule,
manufacturing.
Cont. next slide
11/20/2021 Hamed.Ali.Mohamed2@gmail.com 37
38. 2. Product Design and Development - 2
• New Equipment, Tooling and
Facilities Requirements
• Special Product and Process
Characteristics
• Gages/Testing Equipment
Requirements
• Team Feasibility Commitment
• Management Support
INPUTS:
• Design Goals
• Reliability & Quality
goals
• Preliminary Bill of
Materials
• Preliminary Process Flow
Chart
• Preliminary list of
Special Product and
Process Characteristics
• Product Assurance Plan
OUTPUTS:
Develop design into a
near final form.
Prototype and
feasibility studies –
volumes, schedule,
manufacturing.
11/20/2021 Hamed.Ali.Mohamed2@gmail.com 38
39. 3. Process Design and Development
• Packaging Standards
• Product/Process Quality
System Review
• Process Flow Chart
• Floor Plan Layout
• Characteristics Matrix
• Process Failure Mode and
Effects Analysis (PFMEA)
• Pre-Launch Control Plan
• Process Instructions
• Measurement Systems Analysis
Plan
• Preliminary Process Capability
Study Plan
• Packaging Specifications
• Management Support
INPUTS: OUTPUTS:
Develop a
manufacturing
system and its
related control plans
to achieve quality
products.
• Design Failure Mode and Effects Analysis
(DFMEA)
• Design For Manufacturability and Assembly
• Design Verification
• Design Reviews
• Prototype Build – Control Plan
• Engineering Drawings (Including Math Data)
• Engineering Specifications
• Material Specifications
• Drawing and Specification Changes
• New Equipment, Tooling and Facilities
Requirements
• Special Product and Process Characteristics
• Gages/Testing Equipment Requirements
• Team Feasibility Commitment
• Management Support
11/20/2021 Hamed.Ali.Mohamed2@gmail.com 39
40. 4. Product and Process Validation
• Measurement Systems
Evaluation
• Significant Production Run
• Preliminary Process Capability
Study
• Production Part Approval
• Production Validation Testing
• Packaging Evaluation
• Production Control Plan
• Quality Planning Sign-Off -
formal
• Management Support
INPUTS: OUTPUTS:
Validate manufacturing
process through production
trial run.
Validate that the control plan
and process flow chart are
effective and that the
product meets customer
expectation.
• Packaging Standards
• Product/Process Quality
System Review
• Process Flow Chart
• Floor Plan Layout
• Characteristics Matrix
• Process Failure Mode and
Effects Analysis (PFMEA)
• Pre-Launch Control Plan
• Process Instructions
• Measurement Systems Analysis
Plan
• Preliminary Process Capability
Study Plan
• Packaging Specifications
• Management Support
11/20/2021 Hamed.Ali.Mohamed2@gmail.com 40
41. Feedback, Assessment, Corrective actions
INPUTS: OUTPUTS:
Evaluate outputs,
effectiveness of the
product quality
planning efforts.
• Production Trial Run
• Measurement Systems
Evaluation
• Preliminary Process
Capability Study
• Production Part Approval
• Production Validation
Testing
• Packaging Evaluation
• Production Control Plan
• Quality Planning Sign-Off
and Management Support
• Reduced Variation
• Improved Customer
Satisfaction
• Improved Delivery and
Service
• Effective use of best
practice, lessons learned
• Maximum ROI
• Minimum Waste
• Minimum CONC
11/20/2021 Hamed.Ali.Mohamed2@gmail.com 41
42. Application to Different Mfg.
Environments
• High Volume
• APQP plans and activities are organized by part number and
are very specific to the part
• Low Volume
• APQP plans may be specific to part families with activities
focused on the parent part
• More limited validation would be done on child parts
• Family part differences should be understood and higher risk
differences incorporated into APQP plans
• Engineer to Order (ETO)
• APQP plans may use a part family approach for standardized
elements
• Consider a manufacturing process focus for non-standard
elements
• Create FMEAs and Control Plans for manufacturing processes
rather than parts
11/20/2021 Hamed.Ali.Mohamed2@gmail.com 42
43. • Design Quality
• DFMEA / PFMEA /
DFM/A
• Manufacturing Quality
• Control Plans
• Process Flows
• Measurement
System Analysis
• Capability Analysis
• Process Validation
• Run at rate
• Supplier Qualification &
Quality Requirements
• Product Qualification
• 1st Article Inspection
• PPAP
• Tooling & Gauges
• Testing
What we do:
APQP Summary:
• Defect Free Launches
• Reduced Warranty
Claims
• Zero Spills
• Customer Satisfaction
• Robust Products
• Greater Supplier
Control
• Reduced supplier cost
How we do it:
APQP
What we get:
Leadership Engagement is Critical
UP
FRONT
DETAILED
QUALITY
PLANNING
11/20/2021 Hamed.Ali.Mohamed2@gmail.com 43
44. CONC
APQP Benefits:
Development Production
Prevention through APQP
Current state
Time
$$
Total
Cost
of
Quality
Redesign
Re-qualifications
Escape Investigations
Manufacturing process functions that are clearly planned,
validated, documented and communicated that result in:
• Robust and reliable designs
• Reduced process variation
• Enhanced confidence in supplier’s
capabilities
• Better controlled process changes
• Defect free launches
• Improved Customer satisfaction
• Improved Delivery and Service
• Maximum ROI
• Minimum Waste
• Minimum Cost of Non-conformance
11/20/2021 Hamed.Ali.Mohamed2@gmail.com 44
45. Key Take Aways:
• APQP is cross-functional planning and execution to
produce product that fully meets the customer’s
expectations the first time
• AIAG APQP phases are Planning, Product Design,
Process Design, Validation, Production
• Phase approach ensures activities are completed in
the appropriate order
• Can be applied to different manufacturing
environments – High Volume, Low Volume, ETO
• It’s cross-functional –
Marketing/Design/Manufacturing/SCM/Quality
11/20/2021 Hamed.Ali.Mohamed2@gmail.com 45
47. What is a First Article Inspection?
• A First Article Inspection (FAI) requires that all
dimensions for a part be checked and verified prior
to full production and receipt of part into the
customer facility.
• All dimensions, (except reference dimensions),
characteristics, and specifications, as noted on the
design record and process control plan, are to be
listed on the FAI Report with the actual dimension
results recorded.
11/20/2021 Hamed.Ali.Mohamed2@gmail.com 47
48. What is PPAP?
• Production Part Approval Process
• Standard used to formally reduce risks prior to product
or service release, in a team oriented manner using
well established tools and techniques
• Initially developed by AIAG (Auto Industry Action
Group) in 1993 with input from the Big 3 - Ford,
Chrysler, and GM
• AIAG’s 4th edition effective June 1, 2006 is the most
recent version
• PPAP has now spread to many different industries
beyond automotive
11/20/2021 Hamed.Ali.Mohamed2@gmail.com 48
49. Production Run
• PPAP data must be submitted from a production
run using:
• Production equipment and tooling
• Production employees
• Production rate
• Production process
All data shall reflect the actual production
process that will be used at start-up!
11/20/2021 Hamed.Ali.Mohamed2@gmail.com 49
50. Purpose of PPAP
• Provide evidence that all customer engineering
design record and specification requirements are
properly understood by the organization
• To demonstrate that the manufacturing process has
the potential to produce product that consistently
meets all requirements during an actual production
run at the quoted production rate
11/20/2021 Hamed.Ali.Mohamed2@gmail.com 50
51. What’s the Difference in PPAP vs. FAI?
• FAI gives confidence regarding the sample.
• In addition, PPAP gives confidence in future
product.
11/20/2021 Hamed.Ali.Mohamed2@gmail.com 51
52. When is PPAP Required?
• New part
• Engineering change(s)
• Durable Tooling: transfer, replacement, refurbishment,
or additional
• Tooling inactive > one year
• Correction of discrepancy
• Change to optional construction or material
• Sub-supplier or material source change
• Change in part processing
• Parts produced at a new or additional location
PPAP is required with any significant
change to product or process!
11/20/2021 Hamed.Ali.Mohamed2@gmail.com 52
53. Benefits of PPAP Submissions
• Helps to maintain design integrity
• Identifies issues early for resolution
• Reduces warranty charges and prevents cost of
poor quality
• Assists with managing supplier changes
• Prevents use of unapproved and nonconforming
parts
• Identifies suppliers that need more development
• Improves the overall quality of the product &
customer satisfaction
11/20/2021 Hamed.Ali.Mohamed2@gmail.com 53
54. Level 1
Production Warrant and Appearance Approval
Report (if applicable) submitted to Eaton
Level 2
Production Warrant, product samples, and
dimensional results submitted to Eaton
Level 3
Production Warrant, product samples, and
complete supporting data submitted to Eaton
Level 4
Production Warrant and other requirements
as defined by Eaton
Level 5
Production Warrant, product samples and
complete supporting data (a review will be
conducted at the supplier's manufacturing
location)
PPAP Submission Levels
55. PPAP Submission Requirements
Requirement Level 1 Level 2 Level 3 Level 4 Level 5
1.Design Record R S S * R
2.Engineering Change Documents, if any R S S * R
3.Customer Engineering approval, if required R R S * R
4.Design FMEA R R S * R
5.Process Flow Diagrams R R S * R
6.Process FMEA R R S * R
7.Control Plan R R S * R
8.Measurement System Analysis studies R R S * R
9.Dimensional Results R S S * R
10.Material, Performance Test Results R S S * R
11.Initial Process Studies R R S * R
12.Qualified Laboratory Documentation R S S * R
13.Appearance Approval Report (AAR), if applicable S S S * R
14.Sample Product R S S * R
15.Master Sample R R R * R
16.Checking Aids R R R * R
17.Records of Compliance With Customer Specific Requirements R R S * R
18.Part Submission Warrant S S S S R
19.Bulk Material Checklist S S S S R
S = The organization shall submit to the customer and retain a copy of records or documentation items at appropriate
locations
R = The organization shall retain at appropriate locations and make available to the customer upon request
* = The organization shall retain at the appropriate location and submit to the customer upon request
Note: For each level, full APQP is
required. The PPAP level simply
indicates which elements you
submit, and which you retain at
your site.
Any customer specific requests fall
under Element # 17
11/20/2021 Hamed.Ali.Mohamed2@gmail.com 55
56. PPAP Element 17: Eaton
Requirements
• Depending on the specific Eaton business, Eaton may
require:
• APQP Kickoff - team
• APQP Timeline Template
• Action Item Log
• Production Feasibility Agreement (PFA)
• Gage Plan
• Dimensional Correlation Matrix
• Pass Through Characteristics (PTC)
• Safe Launch Control Plan
• AS 9102 Forms (Aerospace Industry)
• Ramp Up & Down Plan
• Packaging Specification Data Sheet
• Submit Bar Code Label Packaging Approval
• PPAP Interim Recovery Worksheet
• Capacity R@R Worksheet
• Production Readiness Review (PRR)
11/20/2021 Hamed.Ali.Mohamed2@gmail.com 56
57. PPAP Status
• Approved
• The part meets all Eaton requirements
• Supplier is authorized to ship production quantities of
the part
• Interim Approval
• Permits shipment of part on a limited time or piece
quantity basis
• Rejected
• The part does not meet Eaton requirements, based on
the production lot from which it was taken and/or
accompanying documentation
Production quantities shall
not be shipped before Eaton
Approval
11/20/2021 Hamed.Ali.Mohamed2@gmail.com 57
58. Eaton PPAP Process
• Eaton determines PPAP level based on component risk
• Submission requirements are increased for higher risk
components
• Eaton communicates requirements to supplier (RFQ,
APQP Kick-off Meeting, and/or PPAP request – PPAP
Workbook, etc.)
• Eaton provides a standard PPAP workbook with all
necessary tools
• Supplier can use their own templates and tools if they meet
the AIAG requirements
• Supplier conducts APQP per AIAG requirements (Use
PPAP workbook forms as necessary)
11/20/2021 Hamed.Ali.Mohamed2@gmail.com 58
59. Adapting PPAP for High Mix/Low
Volume and Engineer to Order
Manufacturing
• Group parts into part families
• Which parts use the same manufacturing process flow?
• Which parts have 90%+ features in common?
• Design and validate processes based on part
families
• Look at individual processes – use planning and
prevention tools such as PFMEA, Control Plan by
process
11/20/2021 Hamed.Ali.Mohamed2@gmail.com 59
60. PPAP Element #1: Design Record
• Includes:
• Component drawings
• Assembly drawings
• Bill of Materials
• Referenced engineering specifications
• Material specifications
• Performance or test specifications
• Ensures manufacturer has the complete design record
at the correct revision levels
• This requirement may be satisfied by attaching the
“ballooned” design record to the Production Feasibility
Agreement (PFA) – located in the PPAP Workbook
• Some Eaton businesses may use an alternate approach
11/20/2021 Hamed.Ali.Mohamed2@gmail.com 60
61. PPAP Element #2:
Authorized Engineering Change
Documents
• The supplier shall provide authorized change
documents for those changes not yet recorded in
the design record, but incorporated in the product,
part or tooling, such as:
• ECNs (must be approved, not pending)
• Specification changes
• Supplier change requests
• Sub-assembly drawings
• Life or reliability testing requirements
11/20/2021 Hamed.Ali.Mohamed2@gmail.com 61
62. PPAP Element #3:
Customer Engineering Approval
• Written statement from Customer Engineering
approving the parts
• Example: supplier designed components in which we
require additional information for validation of
designs…for structural integrity
• The engineering design requires approval
• Other elements of the PPAP validate the manufacturing
process
11/20/2021 Hamed.Ali.Mohamed2@gmail.com 62
63. PPAP Element #4: Design Failure
Mode and Effects Analysis (DFMEA)
• Provide potential cause and effect relationships for the basic
design of the product
• Helps to plan design needs for:
• Materials selection
• Tolerance stack-up
• Software
• Interfaces
• DVP&R (life cycle tests)
• Employs R.P.N rating system
• High R.P.N’s and Severity> 8 need recommended Corrective Actions
(CA)
• PROLaunch element
• Initial DFMEA in Phase 2
• Complete DFMEA in Phase 3
• May be “Family” based
11/20/2021 Hamed.Ali.Mohamed2@gmail.com 63
64. Difference between DFMEA and
PFMEA
• DFMEA does not reference manufacturing controls
• Design controls include:
• Tolerance stack-up analysis
• Simulation
• Finite Element Analysis
• Testing
• Recommended actions should be Design actions
• Re-design
• Testing
• Analysis
11/20/2021 Hamed.Ali.Mohamed2@gmail.com 64
65. DFMEA Common Pitfalls
• One time document
• Must be continuously reviewed and updated
• What if the latest change or revision has a significant impact?
• Not submitted or reviewed with supplier
• The After Thought
• Completed after drawing and production release
• Doesn’t help to direct the design effort
• Does not consider all potential failure modes
• Critical and/or Special Characteristics not identified
• Only considers full assembly
• Not completed to correct level – component, sub assembly,
assembly, product
• Family based DFMEA not all inclusive
• Not reviewed for specific/ custom application/ designs
11/20/2021 Hamed.Ali.Mohamed2@gmail.com 65
66. “Good” DFMEA Example
Potential
Failure
Mode(s)
Potential Failure
Effects
Class
S
E
V
Potential
Causes
O
C
C
Current
Controls
Prevent
Current Controls
Detect
D
E
T
R
P
N
Impeller
Failure
Low Flow at High
Speeds & High Flows
8 Impeller Fracture 2
Impeller stress analysis,
thermal limits, vibration
analysis
6 96
Relief Valve
Open
Reduced Overall
Efficiency due to
Internal Leakage
8
Relief Valve Stuck
due to
Contamination
3
Relief valve force margin,
relief valve clearances,
sharp edges
5 120
Housing
Fracture
Reduced Overall
Efficiency due to
Internal Leakage
4
Housing Fracture
due to Vibration
3
Analyze housing vibration
modes in conjunction with
vibration requirements
6 72
Actions Recommended
Action
Owner
Target
Date
Actions
Taken
N
e
w
S
E
V
N
e
w
O
C
C
N
e
w
D
E
T
N
e
w
R
P
N
Perform Stack Up Analysis
with Transient / Steady State
Thermal Effects
Joe Smith 11-May-14
Stackups
complete
8 2 2 32
Perform Cartridge Static Load
& Deflection Analysis
Jan Doe 11-Aug-14
Analysis
complete
8 2 2 32
Perform Thermal Stack
Analysis and Thermal Shock
Test
Joe Smith 12-Sep-14
Thermal
analysis
complete
4 3 3 36
11/20/2021 Hamed.Ali.Mohamed2@gmail.com 66
67. Progress Check: DFMEA
• In which APQP phase would you first create a DFMEA?
• APQP: Phase 2 – Product Design
• Which of the following activities should be done before
the DFMEA?
• Create PFMEA
• Customer CTQs identified
• Suppliers Selected
• Gage Plan Created
• Which FMEA risks need recommended actions?
• Any over 100 RPN
• Higher risks - by RPN, Severity or Occurrence
• What is the impact of creating a PFMEA without a
DFMEA?
• May not properly understand the severity of failure effects
After
After
After
11/20/2021 Hamed.Ali.Mohamed2@gmail.com 67
68. PPAP Element #5: Process Flow
Diagram(s)
• Step by Step designation of the process flow
required to produce the referenced product which
meets all customer requirements
• Provide linkage to PFMEA and Control Plan
• Traditional block diagram
• May employ “Family” based diagrams
• Should cover all steps from Receiving to Shipping
(for additional details reference Advance Product Quality Planning and Control
Plan AIAG Manual)
11/20/2021 Hamed.Ali.Mohamed2@gmail.com 68
69. Process Flow Diagrams
PROCESS / INSPECTION FLOWCHART
Product Program Issue Date ECL ECL
Supplier Name ORGANIZATION Part Name NAME
Supplier Location CITY STATE Part Number NUMBER
Legend:
Operation Transportation Inspection Delay Storage
Operation or Event Description of Evaluation
Operation or Event and Analysis Methods
STEP
The process flow diagram
utilizes these symbols to
clearly identify each step
in the process
11/20/2021 Hamed.Ali.Mohamed2@gmail.com 69
70. Preparing the Process Map
• Team Effort:
• Engineers
• Operators
• Supervisors
• Maintenance
• Supply Chain
• Possible Inputs to Mapping:
• Engineering specifications
• Lead time requirements
• Target manufacturing costs
• Operator experience
• Observation
• Brainstorming
11/20/2021 Hamed.Ali.Mohamed2@gmail.com 70
71. Process Flow Diagrams
• Reviewers Checklist
Process Flow must include all phases of the process
• Receiving
• Storage/ material handling
• Manufacturing
• Offline inspections and checks
• Assembly
• Testing
• Shipping
Should include abnormal handling processes
• Scrap
• Rework
• Extended Life Testing
May also include Transportation
11/20/2021 Hamed.Ali.Mohamed2@gmail.com 71
72. Process Map and APQP
• During which APQP phase would you first create a
process map?
APQP: Phase 1 – Planning
• Why not wait until later in the process?
• A basic understanding of the process assists in cost
estimating/ quoting
• Need to know process steps to understand what
equipment/tooling/gages may be required
• Why would volumes and lead-times be important
to know?
• Volumes and lead-times might influence the
manufacturing processes you select (i.e. automated
processes for high volume)
11/20/2021 Hamed.Ali.Mohamed2@gmail.com 72
73. PPAP Element #6: Process FMEA
(PFMEA)
• What is It?
• A tool used to identify and prioritize
risk areas and their mitigation plans.
• Objective or Purpose
• Identifies potential failure modes,
causes, and effects. Inputs come
from the process flow diagram.
• Identifies key inputs which affect
quality, reliability and safety of a
product or process.
• When to Use It
• New product launches
• After completion of the process flow
diagram.
• Prior to tooling for production
• When troubleshooting production
issues
• When planning and closing
preventive and corrective actions
The PFMEA should be completed
using a cross-functional team!
IMPORTANT!
Item: Process Responsibility
Model Year(s)/Program(s) Key Date
Core Team:
Process Step
Requirements
ORGANIZATION
RPN
POTENTIAL
FAILURE MODE AND EFFECTS ANALYSIS
(PROCESS FMEA)
APPLICATION
Detection
Current
Process
Controls
Prevention
Current
Process
Controls
Detection
/ Function
Severity
Classification
Occurrence
Potential
Failure
Mode
Potential
Effect(s)
of Failure
Potential
Causes(s)
of Failure
74. FMEA Origins
• Initially developed by the
US Military as Failure
Mode Effects and
Criticality Analysis
(FMECA)
• Widely adopted by NASA
during the 1960s to
prevent errors on the
Apollo program
• Brought over to the
automotive industry by
Ford after issues with
Pinto fuel tanks
Apollo 1 Failure
Ford Pinto
75. Prevent Detect
What is the process
step or input being
evaluated?
In what way(s) could
the step or input fail to
meet the specificed
requirements?
Consider:
(A) No Function
(B)
Partial/Over/Degraded
Function
(C) Intermittent
Function
(D) Unintended
Function.
What is the impact
on the output
variables (customer
requirements)
or internal
requirements?
What are the effects
of the failure on the
function as perceived
by internal and
external customers?
How
severe
is
the
effect
to
the
customer?
See
SEV
table.
Classify
any
special
product
or
process
characteristics
needing
additional
controls.
What causes the input
to go wrong?
What could cause the
failure, in terms of
something that can be
corrected or controlled?
How
often
does
the
cause
of
the
failure
mode
occur?
See
OCC
table.
What are the existing
process controls to
prevent the cause of
failure or failure mode
from occurring or
reduce the rate of
occurrence?
Should include an
SOP number.
What are the existing
process controls to
detect the cause of
failure or failure mode
and lead to corrective
action(s)?
Should include an
SOP number.
How
well
can
you
detect
the
cause
of
failure
mode?
See
DET
table.
Assemble Hardware Kit
Wrong and/or missing
parts/labeling (B)
Customer unable to
install product
8
Operator places wrong
hardware and/or label
with kit
3
Work Instructions,
Pack Positive
Visual Inspection;
Scale to weigh kits
8
Assemble Hardware Kit Bad seal (B)
Customer unable to
install product, due
to missing hardware.
8 Bagger error 2 Work Instructions Visual Inspection 8
S
E
V
C
L
A
S
S Potential Causes
O
C
C
Current Controls
D
E
T
Process Step
Potential Failure
Mode
Potential Failure
Effects
TIP
• There should be at least one failure mode for each input.
Using the completed
Process Flow Diagram,
enter the process step.
Failure Modes
For each Process Input,
determine the ways in
which the input can go
wrong.
PFMEA - Step 1
11/20/2021 Hamed.Ali.Mohamed2@gmail.com 75
76. Potential Failure Mode
• List all credible failure modes or ways the process/operation can
fail in the PFMEA document before addressing failure effects and
failure causes
• In each instance, the assumption is made that the failure could
occur, but will not necessarily occur
• The failure mode:
• “… is the manner in which the process could potentially fail to meet the
process requirements and/or design intent.”
• Is a description of nonconformance
• Assumes incoming parts are correct
• Considers subsequent operations
• Typical failure modes could be, but are not limited to:
• Bent
• Open circuited
• Dirty
• Binding
• Cracked
• Improper setup
• Burred
• Deformed
• Tool worn
• Handling Damage
11/20/2021 Hamed.Ali.Mohamed2@gmail.com 76
77. Example Failure Modes by Activity
Placement Bend Test Insert Remove / Unload Index Measure
Missing Component X Orientation
Accept Non-
Conforming Part No Insertion
Fails to Remove Non-
Conforming Part X-Y Orientation
Accept Non-
Conforming Part
Wrong Component Z Orientation
Reject Conforming
Part Partial Insertion
Removes
Conforming Part No index
Reject Conforming
Part
Multiple
Components Y Orientation No test Over Insertion Miscategorization No measure
X Location Radial Orientation No remove Inaccurate Gaging
Y Location Dirt Contamination Missed op
Z Location Damage Damage
Radial Orientation Flattened Contamination
Dirt Contamination Cracked
Damage Folded
Upside down Broken fold
Backwards Scratch
Dents
Chips
Deformed
No bend
11/20/2021 Hamed.Ali.Mohamed2@gmail.com 77
78. Example Failure Modes by Activity
(cont.)
Stake Dip Package Initialize Synchronize Setup Pump-Up
No Stake Missed Operation Incorrect Qty
Fail to Clear
Registers
Fail to Recognize
Station Incorrect Setup Does not Pump-Up
Under Stake Partial Dip Incorrect Label
Write Incorrect
Value to Register
During Clearing No Synchronize Incomplete Setup
Over Stake Incorrect Box No Setup
Mixed Parts
Damage
Feed-Out Wind Cut-Off Press Load Fill / Oil Torque
Wrong Wire Too Few Coils No Cut-Off High force Wrong part Wrong fluid
Damaged
component
No Feed Too Many Coils Low force Mix part Too much fluid No torque
Feed Too Short Free Length Short Tooling alignment Dirty part Too little fluid Over torque
Feed Too Long Free Length Long Too Fast Speed Wrong lane
Too slow speed Wrong orientation
Short stroke Damage
Over stroke
11/20/2021 Hamed.Ali.Mohamed2@gmail.com 78
79. Example Failure Modes by Activity
(cont.) Rotate Mark Grease Mold
Partial Rotation Incomplete Wrong Grease Density variation
Over Rotation Illegible no grease Dimension variation
No rotation Wrong Mark X-Y Orientation Sink
Rotate to wrong side Missing Mark Z Orientation Flowlines
Damaged
component Wrong location Damage Shorts
Contamination Too much Warp
Too little Molded contamination
Contamination Weldlines
Incorrect number of
greasing points color variation
brittleness
scratches
drag marks
gate stubs
burns
flash
mixed parts
part count incorrect
bubbles
sirface contamination
voids
splay
damaged part
wrong part
11/20/2021 Hamed.Ali.Mohamed2@gmail.com 79
80. TIPS
• There should be at least one failure effect for each failure mode.
• Effects should be specific, clear, and leave no doubt to the uninformed reviewer.
Potential Failure Effects
For each Failure Mode,
determine what effect
the specific failure
could have on the
process output.
PFMEA - Step 2
11/20/2021 Hamed.Ali.Mohamed2@gmail.com 80
81. Potential Effect(s) of Failure
• Effect of failure mode based on what customer
might notice/experience
• Includes subsequent process operations
• Typical effects may include, but are not limited to:
• No Function
• Partial/Over Function/Degraded over time
• Intermittent Function
• Unintended Function
• Erratic operation
11/20/2021 Hamed.Ali.Mohamed2@gmail.com 81
82. PFMEA – Step 3
Class
Identify special product
or process characteristics
11/20/2021 Hamed.Ali.Mohamed2@gmail.com 82
83. TIP
• There should be at least one potential cause for each failure mode.
Potential Causes
For each Failure Mode,
determine the possible
cause of the failure.
PFMEA - Step 4
11/20/2021 Hamed.Ali.Mohamed2@gmail.com 83
84. Potential Cause(s) of Failure
• “…how the failure could occur.”
• Described in terms of something that can be corrected/controlled
• Requires determination of root cause
• Sources of process variation that cause the failure mode to occur
• Typical failure causes may include, but are not limited to:
• Improper torque – over, under
• Improper weld – current, time, pressure
• Inaccurate gauging
• Improper heat treat – time, temperature
• Inadequate gating/venting
• Part missing or installed incorrectly
• Thermocouple broken
• Typographical error
11/20/2021 Hamed.Ali.Mohamed2@gmail.com 84
85. TIPS
• This step in the FMEA begins to identify initial shortcomings or gaps in the current control plan.
• If a procedure exists, enter the document number.
• If no current control exists, list as “none.” There may not be both preventive and detection controls.
Current Controls
For each potential cause,
list the current method
used for preventing
and/or detecting failure.
PFMEA - Step 5
11/20/2021 Hamed.Ali.Mohamed2@gmail.com 85
86. Assign Severity
(How serious is the
effect if it fails?)
Assign Detection
(How easily can the
cause or failure
mode be detected?)
PFMEA - Step 6
Assign
Occurrence
(How likely is
the cause to
occur?)
11/20/2021 Hamed.Ali.Mohamed2@gmail.com 86
87. PFMEA - Definition of Terms
• Severity (of Effect) - severity of the effect on the
Customer and other stakeholders (Higher Value =
Higher Severity)
• Occurrence (of Cause) - frequency with which a given
Cause occurs and creates Failure Mode. (Higher Value =
Higher Probability of Occurrence)
• Detection (Capability of Current Controls) - ability of
current control scheme to detect the cause before
creating the failure mode and/or the failure mode
before suffering the effect (Higher Value = Lower Ability
to Detect)
Caution: Notice the scale difference for Detection
11/20/2021 Hamed.Ali.Mohamed2@gmail.com 87
88. Example: Severity Rating
Definitions
Suggested PFMEA Severity Evaluation Criteria
Rank Effect
Criteria:
Severity of Effect on Product
(Customer Effect)
Effect
Criteria:
Severity of Effect on Process
(Manufacturing / Assembly Effect)
9
Potential failure mode affects safe Product operation and/or involves
noncompliance with government regulation with warning
May Endanger Operator (machine or assembly) with
warning
10
Failure to Meet
Safety and/or
Regulatory
Requirements
Potential failure mode affects safe Product operation and/or involves
noncompliance with government regulation without warning
Failure to Meet
Safety and/or
Regulatory
Requirements
May Endanger Operator (machine or assembly)
without warning
7
Degradation of primary function (Product operable, but at reduced
level of performance)
Significant
Disruption
A portion of the production run may have to be
scrapped. Deviation from primary process including
decrease line speed or added manpower.
8 Loss or
Degradation of
Primary
Function
Loss of primary function (Product inoperable, does not affect safe
Product operation)
Major Disruption
100% of product may have to be scrapped. Line
shutdown or stop ship.
6
Loss or
Degradation of
Secondary
Function
Loss of secondary function (Product operable, but comfort /
convenience functions inoperable)
High Disruption
100% of production run may have to be reworked off
line and accepted
5
Degradation of secondary function (Product operable, but comfort /
convenience functions at reduced level of performance)
A portion of production run may have to be reworked
off line and accepted
4
Annoyance
Appearance or audible Noise, Product operable, item does not
conform and noticed by most customers (>75%) Moderate
Disruption
100% of production run may have to be reworked in
station before it is processed.
3
Appearance or audible Noise, Product operable, item does not
conform and noticed by most customers (50%)
A portion of production run may have to be reworked
in station before it is processed.
2
Appearance or audible Noise, Product operable, item does not
conform and noticed by most customers (<25%)
Minor Disruption Slight inconvenience to process operation or operator.
1 No Effect No discernible effect No Effect No discernible effect
11/20/2021 Hamed.Ali.Mohamed2@gmail.com 88
89. Example: Occurrence Rating
Definitions
=> 100 per Thousand
=> 1 in 10
50 per Thousand
1 in 20
20 per Thousand
1 in 50
10 per Thousand
1 in 100
2 per Thousand
1 in 500
0.5 per Thousand
1 in 2,000
0.1 per Thousand
1 in 10,000
0.01 per Thousand
1 in 100,000
=< 0.001 per Thousand
1 in 1,000,000
Criteria:
Occurrence of Cause - DFMEA
(Incidents per Item / Products)
Suggested PFMEA Occurrence Evaluation Criteria
Rank
Likelihood of
Failure
9
High
Very High
10
7
8
6
Moderate
5
4
3
Low
2
1 Very Low Failure is eliminated through preventive control
11/20/2021 Hamed.Ali.Mohamed2@gmail.com 89
90. Example: Detection Rating
Definitions
A - Error
Proofed
B -
Gauged
C -
Manual
Rank
Likelihood
of
Detection
Opportunity for Detection
Inspection Types Criteria:
Likelihood of Detection by Design Control
Suggested PFMEA Prevention / Detection Evaluation Criteria
9
10
Very Remote Not Likely to Detect at any Stage X Failure Mode and/or Error (Cause) is not easily detected (eg random audits)
X No Current Process Control; Cannot Detect or is not Analyzed
Almost
Impossible
No Detection Opportunity
Failure Mode detection post processing by operator through visual tactile audible
means
7 Very Low
Controls have poor chance of detection
Problem detection at source.
8 Remote
Controls will probably not detect.
Problem detection post processing.
X
X X
Failure Mode detection in-station by operator through visual tactile audible means or
post processing through use of attribute gauging (go/no go, manual torque check /
clicker wrench etc.)
X
Failure Mode detection post processing by operator through variable gauging or in-
station by operator through the use of attribute gauging (go/no go, manual torque
check / clicker wrench etc.)
5 Moderate
Controls might detect.
Problem detection at source.
X
6 Low
Controls might detect.
Problem detection post processing.
X
X
Controls may detect.
Problem detection post processing.
X X
Failure Mode or Error (Cause) detection in-station by operator through the use of
variable gauging or by automated controls in-station that will detect discrepant part
and notify operator (light buzzer etc.). Gauging performed on set-up and first piece
check (for set-up causes only)
4
Moderately
High
Failure Mode detection post processing by automated controls that will detect
discrepant part and lock part to prevent further processing.
3 High
Controls have a good chance to detect.
Problem detection at source.
X
Failure Mode detection in-station by automated controls that will detect discrepant
part and automatically lock part in station to prevent further processing.
Error (Cause) prevention as a result of fixture design, machine design or part design.
discrepant parts cannot be made because item has been error proofed by
process/product design.
1
Almost
Certain
Detection not applicable, error prevention. X
Error (Cause) detection in-station by automated controls that will detect error and
prevent discrepant part from being made.
2 Very High
Controls almost certain to detect.
Error detection and or problem prevention.
X
11/20/2021 Hamed.Ali.Mohamed2@gmail.com 90
91. Prevent Detect
Assemble Hardware Kit
Wrong and/or missing
parts/labeling (B)
Customer unable to
install product
8
Operator places wrong
hardware and/or label
with kit
3
Work Instructions,
Pack Positive
Visual Inspection;
Scale to weigh kits
8 192
Assemble Hardware Kit Bad seal (B)
Customer unable to
install product, due
to missing hardware.
8 Bagger error 2 Work Instructions Visual Inspection 8 128
S
E
V
C
L
A
S
S Potential Causes
O
C
C
Current Controls
D
E
T
Process Step
Potential Failure
Mode
Potential Failure
Effects
R
P
N
TIPS
• The RPN is used to prioritize the most critical risks
• Higher RPNs are flags to take effort to reduce the calculated risk
• Continually work to improve highest risk items - don’t set an RPN
threshold
• In addition to RPN, examine top Severity and Occurrence risks
Calculate the Risk Priority Number
RPN = Severity x Occurrence x Detection
PFMEA - Step 7
11/20/2021 Hamed.Ali.Mohamed2@gmail.com 91
92. PFMEA – Remediation Guidelines
• Severity – can only be improved by a design change
to the product or process
• Occurrence – can only be reduced by a change
which removes or controls a cause. Examples are
redundancy, substituting a more reliable
component or function or mistake-proofing.
• Detection – can be improved by deploying better
controls. Examples are mistake-proofing,
simplification and statistically sound monitoring.
In general, reducing the Occurrence
is preferable to improving the Detection
11/20/2021 Hamed.Ali.Mohamed2@gmail.com 92
93. Prevent Detect
Work Instructions,
Pack Positive
Visual Inspection;
Scale to weigh kits
8 192
Implement scale to
weigh hardware kits
Kolumban
7/11/11 - Scale implmented to
weigh kits. SK.- Complete
8 3 5 120
Work Instructions Visual Inspection 8 128
Repair/replace worn
bagger
Zindler
2010 Capital Plan - New HM
Autobagger. Follow status on
HM 2010 VSM implementation
plan.
7/11/11 - New Bagger
implemented 3Q 2010. APZ -
Complete
8 1 8 64
O
C
C
S
E
V
Current Controls
D
E
T
D
E
T
R
P
N
R
P
N
Actions
Recommended Responsible Actions Taken
For the high risk items,
determine the
recommended actions.
FMEA – Step 8
11/20/2021 Hamed.Ali.Mohamed2@gmail.com 93
94. Prevent Detect
Work Instructions,
Pack Positive
Visual Inspection;
Scale to weigh kits
8 192
Implement scale to
weigh hardware kits
Kolumban
7/11/11 - Scale implmented to
weigh kits. SK.- Complete
8 3 5 120
Work Instructions Visual Inspection 8 128
Repair/replace worn
bagger
Zindler
2010 Capital Plan - New HM
Autobagger. Follow status on
HM 2010 VSM implementation
plan.
7/11/11 - New Bagger
implemented 3Q 2010. APZ -
Complete
8 1 8 64
O
C
C
S
E
V
Current Controls
D
E
T
D
E
T
R
P
N
R
P
N
Actions
Recommended Responsible Actions Taken
Resp (responsibility)
Assign a specific person
who will be responsible
for recommended actions.
Actions Taken
As actions are identified
and completed, document
in the “Actions Taken”
column.
FMEA – Steps 9 and 10
SEV, OCC, DET, RPN
As actions are complete
reassess Severity,
Occurrence, and Detection
and recalculate RPN.
11/20/2021 Hamed.Ali.Mohamed2@gmail.com 94
95. Summary Steps To Complete a
FMEA
1. For each Process Input, determine the ways in which the Process Step
can go wrong (these are Failure Modes)
2. For each Failure Mode associated with the inputs, determine Effects
on the outputs
3. Mark special characteristics (product and process)
4. Identify potential Causes of each Failure Mode
5. List the Current Controls for each Cause
6. Assign Severity, Occurrence and Detection ratings after creating a
ratings key appropriate for your project
7. Calculate RPN
8. Determine Recommended Actions to reduce high risks
9. Take appropriate Actions and Document
10. Recalculate RPNs
11. Revisit steps 7 and 8 to continually reduce risks
11/20/2021 Hamed.Ali.Mohamed2@gmail.com 95
96. Example: “Good” PFMEA
PROCESS OR
PRODUCT
RESPONSIBLE
TEAM LEADER: Jane Doe DATE (Orig) 3/1/2002 (REV)
TEAM
MEMBERS:
Process
step/Input
Potential
Failure Mode
Potential
Failure Effects
S
E
V
C
l
a
s
s
Potential
Causes(s)
of Failure
O
C
C
Current PROCESS
Controls
- Prevention -
Current PROCESS
Controls
- Detection -
D
E
T
R
P
N
Actions
Recommended
Resp. Actions Taken
S
E
V
O
C
C
D
E
T
R
P
N
Add message to
prompt the
operator that the
grease is off. Add
sensor to grease
valve to sense that
it is firing.
BPB. October
2004
Completed
New prompt and
sensor
8 3 5 120
Add new sensors
to detect pumping
of air
PT. October 2010
Completed
New sensors added 8 3 4 96
7
Impropoer grease
volume block used
2 Visual inspection 8 112
Add sensors to
confirm correct
voume block is
used
PT. October 2010
Completed
Modified equipment
and changed
program to look at
sensors
8 2 4 64
7
Grease not
pumping or barrel
empty
2 Visual inspection 8 112
Add new sensors
to detect pumping
of air
PT. October 2010
Completed
New sensors added 8 2 4 64
7
Impropoer grease
volume block used
2 Visual inspection 8 112
Add sensors to
confirm correct
voume block is
used
PT. October 2010
Completed
Modified equipment
and changed
program to look at
sensors
8 2 4 64
Wrong bearing
housing
Customer will
not be able to
install
6
TP-
12
Wrong set-up 2
100% inspection of
housing in tester
4 48 0
Modify program to
prompt operator to
check orientation
PT. December
2010 Completed
Modified program 5 3 7 105
Change design of
fixture and
locators
PT. February
2011 Completed
Installed March
2011
5 2 7 70
8 120
280
8
3
5 Visual inspection
100% visual check
Damage to
mounting
holes
cosmetic issue
and potential
effect on bolt
torque
Operator turns off
grease, grease not
pumping, or barrel
empty
5
7
Part mislocated in
tester fixture
Product Family XYZ 3/1/2011
John Smith, Jane Doe, Sun Tzu, Szent István, John of Gaunt
Op 35.
Test and
grease
No grease in
bearing sleeve
Sleeve/bearing
wears out -
warranty claim
No grease in
bearing
(Product Z
only)
Premature
bearing/sleeve
failure - warranty
claim
11/20/2021 Hamed.Ali.Mohamed2@gmail.com 96
97. • Reviewers Checklist
Verify risks are prioritized and high risk items have
identified improvement actions
Make sure that high risk process concerns are carried
over into the control plan
Make sure that all critical failure modes are addressed
• Safety
• Form, fit, function
• Material concerns
• See PPAP Workbook for detailed PFMEA checklist
Process FMEA (PFMEA)
11/20/2021 Hamed.Ali.Mohamed2@gmail.com 97
98. Progress Check: PFMEA and APQP
• In which APQP phase would you first create a PFMEA?
• APQP: Phase 3 – Process Design
• Which of the following activities should be done before
the PFMEA?
• Purchase capital equipment
• Create the DFMEA
• Purchase End of Line Testers
• Make Tools/Molds
• Which FMEA risks need recommended actions?
• All
• Any over 100 RPN
• Higher risks - by RPN, Severity or Occurrence
• How would you utilize PFMEA in an ETO environment?
• By part families or by manufacturing processes
After
After
After
11/20/2021 Hamed.Ali.Mohamed2@gmail.com 98
99. PPAP Element #7: Control Plan
• What is It?
• A document that describes
how to control the critical
inputs (FMEA) to continue to
meet customer expectations
• Objective? - Planning
• Needed gaging, testing, error
proofing
• Sampling and frequencies
• How to react when something
fails a test or inspection
• When to Use It
• Implementing a new process
• Implementing a process
change
Since processes are expected to be continuously
updated and improved, the control plan
is a living document!
11/20/2021 Hamed.Ali.Mohamed2@gmail.com 99
100. Process Steps
New/Revised Process
Steps
Project Idea
Fill Out Master
Form
with Initial
Information
Is Hard
Savings > $???
Does the
Project Involve
Only Your
Group?
Does the
Project Involve
>3 Depts.
outside Eng?
Does the
Project Involve
>2 Groups in
Eng?
Do you
have BB/GB to
Assist/Work the
project?
Prefer to work
this project
within your
area?
6 Sigma
Project
Department
or Group
Project
Yes
No
Yes
No
Yes
No
No
No
Yes
Yes
Yes No
Enter Remaining
Information on
Master Form
Master Form Will
Generate
Contract
Finance Approval
and Signature
Other Required
Signatures:
Segment CEO
Champion
Process Owner
BB or GB
6 Sigma Assigns
Project Number
Get WO Assigned
Begin/Work
Project
Follow DMAIC or
DFSS process
Monitor Progress
through Power
Steering and
Monthly
Financial
Reviews
Complete Project
(Has to be fully
Documented
Finance Approval
and Signature
Other Required
Signatures:
Champion: Dir T&E
Process Owner
Project Owner
Dept BB or MBB
Enter Remaining
Information on
Master Form
Master Form Will
Generate
Contract
Finance Approval
and Signature
Other Required
Signatures:
Champion:
Process Owner
Project Owner
Dept GB/BB/MBB
Group Assigns
Project Number
Get DLN
Assigned
Monitor Progress
through Bi-
Weekly Updates
and Monthly
Reviews
Begin/Work
Project
Follow DMAIC or
DFSS process
Complete Project
(Has to be fully
Documented)
Finance Approval
and Signature
Other Required
Signatures:
Champion: Dir T&E
Process Owner
Project Owner
Dept BB or MBB
Complete all
Documentation
including a
(1) Page Close-
out Sheet
Close
Project
Complete all
Documentation
including a
(1) Page Close-
out Sheet
Final Project
Review
Close
Project
Final Project
Review
6 Sigma Project
High Level Process Map
Department/Group Project
High Level Process Map
Process Flowchart
Process Step
Key
Process
Input
Potential
Failure Mode
Potential
Failure Effects
S
E
V
Potential Causes
O
C
C
Current Controls
D
E
T
R
P
N
E
O
C
Actions
Recommended
Receive
Payment
Checks Delay internal
mail
AR balance does
not go down
7
Inadequate
staffing in mail
room 7
None
10 490
Investigate mail room
staffing and associated
processes
Identify
Customer
Wire
Transfer
reference
line
Information not
supplied
AR balance is
past due
10
Customer or bank
did not include
name and/or
account info on
wire transfer
5
Acct identifies problem
when trying to apply
payment
5 250
Poka-Yoke wire transer
process
Identify Invoice Checks Incorrect
invoice
supplied
Invoice shows
outstanding (AR
balance does go
down)
5
Customer error
5
Customer might catch
it when reviewing the
next statement 10 250
Provide payment stub
with statement for each
invoice
Identify Invoice Checks Invoice number
not supplied
Invoice shows
outstanding (AR
balance does go
down)
5
Customer error
10
Acct identifies problem
when trying to apply
payment 5 250
Provide payment stub
with statement for each
invoice
Process FMEA
Control Plan
Tool Interaction
Control Plan
11/20/2021 Hamed.Ali.Mohamed2@gmail.com 100
101. The Control Plan Form
CONTROL PLAN
Control Plan Number Key Contact/Phone Date (Orig.) Date (Rev.)
FILE.XLS 555-555-5555
Part Number/Latest Change Level Core Team Customer Engineering Approval/Date (If Req'd.)
NUMBER ECL
Part Name/Description Organization/Plant Approval/Date Customer Quality Approval/Date (If Req'd.)
NAME
Organization/Plant Organization Code Other Approval/Date (If Req'd.) Other Approval/Date (If Req'd.)
ORGANIZATION
PRODUCT/PROCESS EVALUATION/ SAMPLE
SPECIFICATION/ MEASUREMENT
TOLERANCE TECHNIQUE
CODE
REACTION
PLAN
1/1/1996 1/1/1996
MACHINE,
DEVICE
JIG, TOOLS
FOR MFG.
NO. PRODUCT PROCESS
SPECIAL
CHAR.
CLASS SIZE
PART/
PROCESS
NUMBER
PROCESS NAME/
OPERATION
DESCRIPTION FREQ.
CONTROL
METHOD
CHARACTERISTICS METHODS
Prototype Pre-Launch Production
11/20/2021 Hamed.Ali.Mohamed2@gmail.com 101
102. CONTROL PLAN
Control Plan Number Key Contact/Phone Date (Orig.) Date (Rev.)
FILE.XLS 555-555-5555
Part Number/Latest Change Level Core Team Customer Engineering Approval/Date (If Req'd.)
NUMBER ECL
Part Name/Description Organization/Plant Approval/Date Customer Quality Approval/Date (If Req'd.)
NAME
Organization/Plant Organization Code Other Approval/Date (If Req'd.) Other Approval/Date (If Req'd.)
ORGANIZATION
PRODUCT/PROCESS EVALUATION/ SAMPLE
SPECIFICATION/ MEASUREMENT
TOLERANCE TECHNIQUE
CODE
REACTION
PLAN
1/1/1996 1/1/1996
MACHINE,
DEVICE
JIG, TOOLS
FOR MFG.
NO. PRODUCT PROCESS
SPECIAL
CHAR.
CLASS SIZE
PART/
PROCESS
NUMBER
PROCESS NAME/
OPERATION
DESCRIPTION FREQ.
CONTROL
METHOD
CHARACTERISTICS METHODS
Prototype Pre-Launch Production
The Control Plan Form
Administrative Section
Identifies part number and description,
supplier, required approval signatures,
and dates.
11/20/2021 Hamed.Ali.Mohamed2@gmail.com 102
103. CONTROL PLAN
Control Plan Number Key Contact/Phone Date (Orig.) Date (Rev.)
FILE.XLS 555-555-5555
Part Number/Latest Change Level Core Team Customer Engineering Approval/Date (If Req'd.)
NUMBER ECL
Part Name/Description Organization/Plant Approval/Date Customer Quality Approval/Date (If Req'd.)
NAME
Organization/Plant Organization Code Other Approval/Date (If Req'd.) Other Approval/Date (If Req'd.)
ORGANIZATION
PRODUCT/PROCESS EVALUATION/ SAMPLE
SPECIFICATION/ MEASUREMENT
TOLERANCE TECHNIQUE
CODE
REACTION
PLAN
1/1/1996 1/1/1996
MACHINE,
DEVICE
JIG, TOOLS
FOR MFG.
NO. PRODUCT PROCESS
SPECIAL
CHAR.
CLASS SIZE
PART/
PROCESS
NUMBER
PROCESS NAME/
OPERATION
DESCRIPTION FREQ.
CONTROL
METHOD
CHARACTERISTICS METHODS
Prototype Pre-Launch Production
The Control Plan Form
3 Distinct Phases
1. Prototype – a description of the dimensional measurements and material
and performance tests that will occur during Prototype build.
2. Pre-Launch – a description of the dimensional measurements and material
and performance tests that will occur after Prototype and before full
Production.
3. Production – a comprehensive documentation of product/process
characteristics, process controls, tests, and measurement systems that will
occur during mass production
11/20/2021 Hamed.Ali.Mohamed2@gmail.com 103
104. CONTROL PLAN
Control Plan Number Key Contact/Phone Date (Orig.) Date (Rev.)
FILE.XLS 555-555-5555
Part Number/Latest Change Level Core Team Customer Engineering Approval/Date (If Req'd.)
NUMBER ECL
Part Name/Description Organization/Plant Approval/Date Customer Quality Approval/Date (If Req'd.)
NAME
Organization/Plant Organization Code Other Approval/Date (If Req'd.) Other Approval/Date (If Req'd.)
ORGANIZATION
PRODUCT/PROCESS EVALUATION/ SAMPLE
SPECIFICATION/ MEASUREMENT
TOLERANCE TECHNIQUE
CODE
REACTION
PLAN
1/1/1996 1/1/1996
MACHINE,
DEVICE
JIG, TOOLS
FOR MFG.
NO. PRODUCT PROCESS
SPECIAL
CHAR.
CLASS SIZE
PART/
PROCESS
NUMBER
PROCESS NAME/
OPERATION
DESCRIPTION FREQ.
CONTROL
METHOD
CHARACTERISTICS METHODS
Prototype Pre-Launch Production
The Control Plan Form
Each stage of production and testing. Can be:
• Each operation indicated by the process flow
• Each workstation
• Each machine
Include testing and audits
“Process Number” should cross reference with PFMEA
and Process Map
11/20/2021 Hamed.Ali.Mohamed2@gmail.com 104
105. CONTROL PLAN
Control Plan Number Key Contact/Phone Date (Orig.) Date (Rev.)
FILE.XLS 555-555-5555
Part Number/Latest Change Level Core Team Customer Engineering Approval/Date (If Req'd.)
NUMBER ECL
Part Name/Description Organization/Plant Approval/Date Customer Quality Approval/Date (If Req'd.)
NAME
Organization/Plant Organization Code Other Approval/Date (If Req'd.) Other Approval/Date (If Req'd.)
ORGANIZATION
PRODUCT/PROCESS EVALUATION/ SAMPLE
SPECIFICATION/ MEASUREMENT
TOLERANCE TECHNIQUE
CODE
REACTION
PLAN
1/1/1996 1/1/1996
MACHINE,
DEVICE
JIG, TOOLS
FOR MFG.
NO. PRODUCT PROCESS
SPECIAL
CHAR.
CLASS SIZE
PART/
PROCESS
NUMBER
PROCESS NAME/
OPERATION
DESCRIPTION FREQ.
CONTROL
METHOD
CHARACTERISTICS METHODS
Prototype Pre-Launch Production
The Control Plan Form
Product characteristics that are important. These can be
determined by referencing:
• ST Dimensions on the drawing
• Customer critical characteristics
• Process critical characteristics
There may be several for each operation
Can be dimensional, performance or visual criteria
11/20/2021 Hamed.Ali.Mohamed2@gmail.com 105
106. The Control Plan Form
Process parameters that are important. A process
parameter is a setting made within a process that effects
the variation within the operation. Examples include:
• Temperature (molding, heat treat, etc.)
• Pressure
• Fixture settings
• Speed
• Torque
11/20/2021 Hamed.Ali.Mohamed2@gmail.com 106
107. CONTROL PLAN
Control Plan Number Key Contact/Phone Date (Orig.) Date (Rev.)
FILE.XLS 555-555-5555
Part Number/Latest Change Level Core Team Customer Engineering Approval/Date (If Req'd.)
NUMBER ECL
Part Name/Description Organization/Plant Approval/Date Customer Quality Approval/Date (If Req'd.)
NAME
Organization/Plant Organization Code Other Approval/Date (If Req'd.) Other Approval/Date (If Req'd.)
ORGANIZATION
PRODUCT/PROCESS EVALUATION/ SAMPLE
SPECIFICATION/ MEASUREMENT
TOLERANCE TECHNIQUE
CODE
REACTION
PLAN
1/1/1996 1/1/1996
MACHINE,
DEVICE
JIG, TOOLS
FOR MFG.
NO. PRODUCT PROCESS
SPECIAL
CHAR.
CLASS SIZE
PART/
PROCESS
NUMBER
PROCESS NAME/
OPERATION
DESCRIPTION FREQ.
CONTROL
METHOD
CHARACTERISTICS METHODS
Prototype Pre-Launch Production
The Control Plan Form
Class refers to special characteristics –
product or process. Should align with
FMEA
11/20/2021 Hamed.Ali.Mohamed2@gmail.com 107
108. CONTROL PLAN
Control Plan Number Key Contact/Phone Date (Orig.) Date (Rev.)
FILE.XLS 555-555-5555
Part Number/Latest Change Level Core Team Customer Engineering Approval/Date (If Req'd.)
NUMBER ECL
Part Name/Description Organization/Plant Approval/Date Customer Quality Approval/Date (If Req'd.)
NAME
Organization/Plant Organization Code Other Approval/Date (If Req'd.) Other Approval/Date (If Req'd.)
ORGANIZATION
PRODUCT/PROCESS EVALUATION/ SAMPLE
SPECIFICATION/ MEASUREMENT
TOLERANCE TECHNIQUE
CODE
REACTION
PLAN
1/1/1996 1/1/1996
MACHINE,
DEVICE
JIG, TOOLS
FOR MFG.
NO. PRODUCT PROCESS
SPECIAL
CHAR.
CLASS SIZE
PART/
PROCESS
NUMBER
PROCESS NAME/
OPERATION
DESCRIPTION FREQ.
CONTROL
METHOD
CHARACTERISTICS METHODS
Prototype Pre-Launch Production
The Control Plan Form
This is a specification from the Design Record or a key
process parameter
11/20/2021 Hamed.Ali.Mohamed2@gmail.com 108
109. CONTROL PLAN
Control Plan Number Key Contact/Phone Date (Orig.) Date (Rev.)
FILE.XLS 555-555-5555
Part Number/Latest Change Level Core Team Customer Engineering Approval/Date (If Req'd.)
NUMBER ECL
Part Name/Description Organization/Plant Approval/Date Customer Quality Approval/Date (If Req'd.)
NAME
Organization/Plant Organization Code Other Approval/Date (If Req'd.) Other Approval/Date (If Req'd.)
ORGANIZATION
PRODUCT/PROCESS EVALUATION/ SAMPLE
SPECIFICATION/ MEASUREMENT
TOLERANCE TECHNIQUE
CODE
REACTION
PLAN
1/1/1996 1/1/1996
MACHINE,
DEVICE
JIG, TOOLS
FOR MFG.
NO. PRODUCT PROCESS
SPECIAL
CHAR.
CLASS SIZE
PART/
PROCESS
NUMBER
PROCESS NAME/
OPERATION
DESCRIPTION FREQ.
CONTROL
METHOD
CHARACTERISTICS METHODS
Prototype Pre-Launch Production
The Control Plan Form
How is the characteristic or parameter going to
measured? Examples include:
• Caliper
• Attribute gage
• Visual
• Fixture
• Test equipment
11/20/2021 Hamed.Ali.Mohamed2@gmail.com 109
110. CONTROL PLAN
Control Plan Number Key Contact/Phone Date (Orig.) Date (Rev.)
FILE.XLS 555-555-5555
Part Number/Latest Change Level Core Team Customer Engineering Approval/Date (If Req'd.)
NUMBER ECL
Part Name/Description Organization/Plant Approval/Date Customer Quality Approval/Date (If Req'd.)
NAME
Organization/Plant Organization Code Other Approval/Date (If Req'd.) Other Approval/Date (If Req'd.)
ORGANIZATION
PRODUCT/PROCESS EVALUATION/ SAMPLE
SPECIFICATION/ MEASUREMENT
TOLERANCE TECHNIQUE
CODE
REACTION
PLAN
1/1/1996 1/1/1996
MACHINE,
DEVICE
JIG, TOOLS
FOR MFG.
NO. PRODUCT PROCESS
SPECIAL
CHAR.
CLASS SIZE
PART/
PROCESS
NUMBER
PROCESS NAME/
OPERATION
DESCRIPTION FREQ.
CONTROL
METHOD
CHARACTERISTICS METHODS
Prototype Pre-Launch Production
The Control Plan Form
How many parts will be measured and how often.
Examples:
Final testing, visual criteria
• 100%
SPC, Audit,
• The sample size and frequency
11/20/2021 Hamed.Ali.Mohamed2@gmail.com 110
111. CONTROL PLAN
Control Plan Number Key Contact/Phone Date (Orig.) Date (Rev.)
FILE.XLS 555-555-5555
Part Number/Latest Change Level Core Team Customer Engineering Approval/Date (If Req'd.)
NUMBER ECL
Part Name/Description Organization/Plant Approval/Date Customer Quality Approval/Date (If Req'd.)
NAME
Organization/Plant Organization Code Other Approval/Date (If Req'd.) Other Approval/Date (If Req'd.)
ORGANIZATION
PRODUCT/PROCESS EVALUATION/ SAMPLE
SPECIFICATION/ MEASUREMENT
TOLERANCE TECHNIQUE
CODE
REACTION
PLAN
1/1/1996 1/1/1996
MACHINE,
DEVICE
JIG, TOOLS
FOR MFG.
NO. PRODUCT PROCESS
SPECIAL
CHAR.
CLASS SIZE
PART/
PROCESS
NUMBER
PROCESS NAME/
OPERATION
DESCRIPTION FREQ.
CONTROL
METHOD
CHARACTERISTICS METHODS
Prototype Pre-Launch Production
The Control Plan Form
How the characteristic or parameter will be controlled
(this is the record) Examples include:
• Xbar/R Chart
• NP Chart
• Pre-control Chart
• Checklist
• Log sheet
• Mistake proofing
• 1st piece inspection
• Lab report
11/20/2021 Hamed.Ali.Mohamed2@gmail.com 111
112. CONTROL PLAN
Control Plan Number Key Contact/Phone Date (Orig.) Date (Rev.)
FILE.XLS 555-555-5555
Part Number/Latest Change Level Core Team Customer Engineering Approval/Date (If Req'd.)
NUMBER ECL
Part Name/Description Organization/Plant Approval/Date Customer Quality Approval/Date (If Req'd.)
NAME
Organization/Plant Organization Code Other Approval/Date (If Req'd.) Other Approval/Date (If Req'd.)
ORGANIZATION
PRODUCT/PROCESS EVALUATION/ SAMPLE
SPECIFICATION/ MEASUREMENT
TOLERANCE TECHNIQUE
CODE
REACTION
PLAN
1/1/1996 1/1/1996
MACHINE,
DEVICE
JIG, TOOLS
FOR MFG.
NO. PRODUCT PROCESS
SPECIAL
CHAR.
CLASS SIZE
PART/
PROCESS
NUMBER
PROCESS NAME/
OPERATION
DESCRIPTION FREQ.
CONTROL
METHOD
CHARACTERISTICS METHODS
Prototype Pre-Launch Production
The Control Plan Form
What happens when the characteristic or parameter is
found to be out of control. Must include:
• Segregation of nonconforming product
• Correction method
May include (as appropriate):
• Sorting
• Rework/Repair
• Customer notification
11/20/2021 Hamed.Ali.Mohamed2@gmail.com 112
113. Control Plan – Example
Control Plan Number Key Contact/Phone Date:(Org.) Date (Rev.)
002 T. Smith / 313-555-5555 11/29/2009 2/20/2010
Part Number/Latest Change Level Core Team Customer Engineering Approval/Date (If Req'd.)
54321231 / D Erin Hope, Alan Burt, Ken Light
Part Name/Description Supplier/Plant Approval/Date Customer Quality Approval/Date(If Req'd.)
Electronic Circuit Board
Supplier/Plant Supplier Code Other Approval/Date (If Req'd.) Other Approval/Date (If Req'd.)
ACR Control 439412
Size Freq.
2
Soldering
Connections
Wave
solder
machine
Wave
solder
height 2.0 +/- .25 mc
Sensor
continuity
check 100% Continuous
Automated
inspection
(error
proofing)
Adjust and
retest
Flux
concen -
tration Standard #302B
Test sampling
lab
environment 1 pc 4 hours x-MR chart
Segregate
and retest
Prototype Pre-Launch Production
Reaction
Plan
Sample
Product/Process
Specification/
Tolerance
Evaluation /
Measurement
Technique
Control
Method
CONTROL PLAN
Part /
Process
Number
Process Name
/ Operation
Description
Machine,
Device,
Jig, Tools,
for MFG.
Characteristics
Special
Char.
Class
No. Product Process
Methods
A supplier manufactures a circuit board with electronic components soldered on the
board. Properly soldered connections are the major product characteristics. Two major
process characteristics for the wave solder machine are solder level and flux
concentration. An automated feeder controls the solder level by sensing the level of
solder and feeding in additional solder as the level is reduced. This characteristic is
measured 100% by checking electrically for continuity. The flux must be sampled and
tested for the concentration level.
11/20/2021 Hamed.Ali.Mohamed2@gmail.com 113
114. Control Plan: Reviewer’s Checklist
Remember the Control Plan is a planning tool –
• Use it to decide what you should be doing
• The AIAG format will help make sure the plan makes sense and is complete
Use process flow diagram and PFMEA to build the control plan; keep
them aligned
Controls should be effective. Keep it simple.
Ensure that the control plan is in your document control system
Good control plans address:
• All testing requirements - dimensional, material, and performance
• All product and process characteristics at every step throughout the process
The control method should be based on an effective analysis of the
process
Control plans should reference other documentation
• Specifications, tooling, etc.
11/20/2021 Hamed.Ali.Mohamed2@gmail.com 114
115. Control Plan and APQP
• In what APQP Phase would you first create a
control plan?
Prototype CP in Phase 2: Product Design
Pre-production CP in Phase 3: Process Design
Production CP in Phase 4: Validation
• How does the reaction plan help with process
design?
Identify rework needs, quarantine product location
needs, etc.
11/20/2021 Hamed.Ali.Mohamed2@gmail.com 115
116. PPAP Element #8:
Measurement System Analysis (MSA)
An MSA is a statistical tool used to
determine if a measurement system
is capable of precise measurement.
What is It?
Objective or Purpose
• To determine how much error is in
the measurement due to the
measurement process itself.
• Quantifies the variability added by
the measurement system.
• Applicable to attribute data and
variable data.
When to Use It
• On systems measuring critical inputs
and outputs prior to collecting data
for analysis.
• For any new or modified process in
order to ensure the quality of the
data.
Measurement System Analysis is
an analysis of the measurement
process, not an analysis of the
people!!
IMPORTANT!
Who Should be Involved
Everyone that measures and makes
decisions about these measurements
should be involved in the MSA.
11/20/2021 Hamed.Ali.Mohamed2@gmail.com 116
117. Inspection – what do you really
see?
11/20/2021 Hamed.Ali.Mohamed2@gmail.com 117
119. Measurement System Analysis (MSA)
Error in Resolution
The inability to detect small
changes.
Possible Cause
Wrong measurement device
selected - divisions on scale
not fine enough to detect
changes.
Resolution
11/20/2021 Hamed.Ali.Mohamed2@gmail.com 119
120. Measurement System Analysis
(MSA)
Error in Repeatability
The inability to get the same
answer from repeated
measurements made of the
same item under absolutely
identical conditions.
Possible Cause
Lack of standard operating
procedures (SOP), lack of
training, measuring system
variablilty.
Repeatability
Equipment Variation
11/20/2021 Hamed.Ali.Mohamed2@gmail.com 120
121. Measurement System Analysis
(MSA)
Error in Reproducibility
The inability to get the same
answer from repeated
measurements made under
various conditions from
different inspectors.
Possible Cause
Lack of SOP, lack of training.
Reproducibility
Appraiser Variation
11/20/2021 Hamed.Ali.Mohamed2@gmail.com 121
122. Variable MSA – Gage R&R Study
•Gage R&R is the combined estimate of
measurement system Repeatability and
Reproducibility
•Typically, a 3-person study is performed
Each person randomly measures 10 marked parts per trial
Each person can perform up to 3 trials
•There are 3 key indicators
% P/T or measurement variation compared to tolerance
% R&R or measurement variation compared to process variation
Number of distinct categories (ndc) or measure of resolution
11/20/2021 Hamed.Ali.Mohamed2@gmail.com 122
123. GAGE REPEATABILITY AND REPRODUCIBILITY DATA SHEET GAGE REPEATABILITY AND REPRODUCIBILITY DATA SHEET
VARIABLE DATA RESULTS VARIABLE DATA RESULTS
Part Number Gage Name Appraiser A Part Number Gage Name Appraiser A
NUMBER NUMBER
Part Name Gage Number Appraiser B Part Name Gage Number Appraiser B
NAME NAME
Characteristic Specification Gage Type Appraiser C Characteristic Gage Type Appraiser C
Lower Upper
Characteristic Classification Trials Parts Appraisers Date Performed Characteristic Classification Trials Parts Appraisers Date Performed
APPRAISER/ PART AVERAGE Measurement Unit Analysis % Tolerance (Tol)
TRIAL # 1 2 3 4 5 6 7 8 9 10 Repeatability - Equipment Variation (EV)
1. A 1 EV = R x K1 Trials K1 % EV = 100 (EV/Tol)
2. 2 = 2 0.8862 =
3. 3 = 3 0.5908 =
4. AVE xa= Reproducibility - Appraiser Variation (AV)
5. R ra= AV = {(xDIFF x K2)2
- (EV2
/nr)}1/2
% AV = 100 (AV/Tol)
6. B 1 = =
7. 2 = =
8. 3 A ppraisers 2 3
9. AVE xb= n = parts r = trials K2 0.7071 0.5231
10. R rb= Repeatability & Reproducibility (GRR) % GRR = 100 (GRR/Tol)
11. C 1 GRR = {(EV2
+ AV2
)}1/2
Parts K3 =
12. 2 = 2 0.7071 =
13. 3 = 3 0.5231
14. AVE xc= Part Variation (PV) 4 0.4467
15. R rc= PV = RP x K3 5 0.4030 % PV = 100 (PV/Tol)
16. PART X= = 6 0.3742 =
AVERAGE Rp= = 7 0.3534 =
17. (ra + rb + rc) / (# OF APPRAISERS) = R= Tolerance (Tol) 8 0.3375
18. xDIFF = (Max x - Min x) = xDIFF= Tol = Upper - Lower / 6 9 0.3249 ndc = 1.41(PV/GRR)
19. * UCLR = R x D4 = UCLR= = ( Upper - Lower ) / 6 10 0.3146 =
= =
* D4 =3.27 for 2 trials and 2.58 for 3 trials. UCLR represents the limit of individual R's. Circle those that are
beyond this limit. Identify the cause and correct. Repeat these readings using the same appraiser and unit as originally used or
discard values and re-average and recompute R and the limiting value from the remaining observations. For information on the theory and constants used in the form see MSA Reference Manual , Fourth edition.
Notes:
Variable MSA – AIAG GR&R
VAR(Tol)
Included in PPAP Workbook
Automatically calculates
%GRR, %PV, ndc
11/20/2021 Hamed.Ali.Mohamed2@gmail.com 123
124. 1. Select 10 items that represent the full range of long-term process variation
2. Identify the appraisers – they should be operator who normally use the gage
3. If appropriate, calibrate the gage or verify that the last calibration date is valid
4. Open the GR&R VAR(Tol) worksheet in the AIAG Core Tools file to record data, or use MiniTab
5. Have each appraiser assess each part 3 times preferably in random order (Minitab can generate a random
run order)
6. Input data into the GR&R VAR(Tol) worksheet or MiniTab
7. Enter the number of operators, trials, samples and specification limits
8. Analyze data and review GR&R and PV values
9. Take actions for improvement if necessary.
Variable MSA – Gage R&R Steps
Step 1 Step 3 Step 4 Step 5 Step 6 Step 7 Step 8 Step 9
Step 2
11/20/2021 Hamed.Ali.Mohamed2@gmail.com 124
125. Important: An MSA is an analysis of the process, not an analysis of the people. If an
MSA fails, the process failed.
A Variable MSA provides more analysis capability than an Attribute MSA. For this and
other reasons, always use variable data if possible.
The involvement of people is the key to success.
Involve the people that actually work the process
Involve the supervision
Involve the suppliers and customers of the process
An MSA primarily addresses precision with limited accuracy information.
Tips and Lessons Learned
Measurements Systems Analysis MSA
11/20/2021 Hamed.Ali.Mohamed2@gmail.com 125
126. If the gage/inspection measures a special characteristic
or other important feature, then conduct a Gage R&R
Make sure the study is recent - less than 1 year
Compare the control plan gages against the Gage R&Rs
% R&R and %P/T should be less than 10%
Values greater than 10% should be reviewed with Eaton
Number of distinct categories should be >5
If you question that gage, then
• Question the technique and part sampling
• Ask for additional studies
MSA: Reviewer’s Checklist
11/20/2021 Hamed.Ali.Mohamed2@gmail.com 126
127. MSA Summary
• Measurement systems must be analyzed BEFORE
embarking on process improvement activities
• MSA helps understand how much observed variation is
from the measurement system
• MSA will tell you about the repeatability,
reproducibility and discrimination
• Sample selection is very important – sample during
normal production to capture total range of process
variation
• MSA assessors should be operators that would
normally use the measurement system
• MSA should be done on a regular basis
11/20/2021 Hamed.Ali.Mohamed2@gmail.com 127
128. PPAP Element #9: Dimensional
Results
Evidence that dimensional
verifications have been completed
and results indicate compliance with
specified requirements
What is It?
Objective or Purpose
• To show conformance to the
customer part print on dimensions
and all other noted requirements
When to Use It
• For each unique manufacturing
process (e.g., cells or production
lines and all molds, patterns, or
dies
Corporate SCM Form-XX (Rev. A, 2014)
Part Number
Part Name
Design Record Change Level
Engineering Change Document
Measurement Method OK
Not
OK
Supplier 0 0
0
Production Part Approval / Dimensional Test Results
Supplier / Vender Code
Inspection Facility
Qty.
Tested
Supplier Measurement
Results (DATA)
Item
Dimension /
Specification
Specification /
Limits
Test
Date
11/20/2021 Hamed.Ali.Mohamed2@gmail.com 128
129. Dimensional Results
• Reviewer’s Checklist
All design record specifications (notes, referenced
specifications, etc.) shall be included in the Dimensional
Results
• Material and performance specifications results can be reported on
the separate Material, Performance Test Results
Results shall include samples from each tool cavity,
manufacturing line, etc.
Data points should come from PPAP samples included with
PPAP submission
• The agreed upon # of parts from the production run must be
shipped to the customer for verification of form, fit, and function
• Supplier must clearly identify PPAP samples used for dimensional
results
Results that do not meet the design specification shall be
addressed prior to PPAP submission
• “Not OK” results typically require changes to the manufacturing
process prior to PPAP submission. In some cases the customer may
agree to engineering changes.
11/20/2021 Hamed.Ali.Mohamed2@gmail.com 129
130. PPAP Element #10: Records of
Material/Performance Test Results
• Material Test Results
• The supplier shall perform tests for all parts and product
materials when chemical, physical, or metallurgical
requirements are specified by the design record or
Control Plan
• For products with Eaton-developed material
specifications and/or an Eaton-approved supplier list,
the supplier shall procure materials and/or services from
suppliers on that list
• Performance Test Results
• The supplier shall perform tests for all parts or product
materials when performance or functional requirements
are specified by the design record or Control Plan
11/20/2021 Hamed.Ali.Mohamed2@gmail.com 130
131. Material Results
Production Part Approval
Material Test Results
ORGANIZATION: PART NUMBER:
SUPPLIER / VENDOR CODE: PART NAME:
MATERIAL SUPPLIER: DESIGN RECORD CHANGE LEVEL:
*CUSTOMER SPECIFIED SUPPLIER / VENDOR CODE: ENGINEERING CHANGE DOCUMENTS:
*If source approval is req'd, include the Supplier (Source) & Customer assigned code. NAME of LABORATORY:
SPECIFICATION /
LIMITS
TEST
DATE
MATERIAL SPEC. NO. / REV / DATE
QTY.
TESTED
SUPPLIER TEST RESULTS (DATA) OK
NOT
OK
Material Results shall include:
The name of the laboratory that conducted the test
The type of test that was conducted
The number, date, and specification to which the part was tested
The actual test results
11/20/2021 Hamed.Ali.Mohamed2@gmail.com 131
132. Performance Test Results
Performance Test Results shall include:
The name of the laboratory that conducted the test
The type of test that was conducted
A description of the test
The parameters tested
The actual test results
11/20/2021 Hamed.Ali.Mohamed2@gmail.com 132
133. PPAP Element #11: Initial Process
Studies
• Capability studies are
measures of how well the
process is meeting the
design requirements.
• Is the process employed Stable
and Capable?
• MSA before Cpk
• MSA must be acceptable and
should represent tools/process
used for Initial Process Studies
• >1.67 Cpk for SCs, >1.33 for
other characteristics
• Cpk & Ppk minimums are
higher for initial release vs.
ongoing
134. PPAP Element #11: Initial Process
Study
Purposes of Initial Process Study
• To evaluate how well a process can produce product that meets
specifications
• To provide guidance about how to improve capability
• better process centering
• reduced variation
• Capability studies can be used to identify a problem or to verify
permanent corrective actions in the problem solving process.
11/20/2021 Hamed.Ali.Mohamed2@gmail.com 134
136. Examples of Non-Capable
Processes
Product produced
beyond both
Upper and Lower Spec
Limits.
Product produced
above the
Upper Spec Limit.
Product produced
below the
Lower Spec Limit.
11/20/2021 Hamed.Ali.Mohamed2@gmail.com 136
137. Capability Studies
A short-term capability study
covers a relative short period of
time during which extraneous
sources of variation have been
excluded. (Guideline: 30-50 data
points.)
1
50
1
00
50
0
1
5
1
4
1
3
1
2
1
1
1
0
9
ObservationN
um
ber
IndividualValue
Process Data forCo2
X=1
2.64
U
CL=1
4.1
8
LCL=1
1
.1
0
1
50
1
00
50
0
1
5
1
4
1
3
1
2
1
1
1
0
9
ObservationN
um
ber
IndividualValue
Process Data forCo2
X=1
2.64
U
CL=1
4.1
8
LCL=1
1
.1
0
A long-term capability study covers
a longer period of time in which
there is more chance for a process
shift. (Guideline: 100-200 data
points.)
11/20/2021 Hamed.Ali.Mohamed2@gmail.com 137
138. Steps for Determining Process
Capability
Step 1 Step 2 Step 3 Step 4 Step 5 Step 6 Step 7
1. Decide on the product or process characteristic to
be assessed
2. Verify the specification limits
3. Validate the measurement system
4. Collect data per sample size/frequency in Control
Plan
5. Assess data characteristics
6. Assess process stability
7. Calculate process capability
Let’s take a closer look
at data characteristics
and process capability
11/20/2021 Hamed.Ali.Mohamed2@gmail.com 138
139. Step 5: Data Characteristics
Examine the shape of your data.
• Is it what you would expect?
If not, investigate.
Mfg Hours
Frequency
24
22
20
18
16
25
20
15
10
5
0
Mean 19.98
StDev 1.713
N 100
Histogram of Mfg Hours
Mfg Hours
Frequency
22
20
18
16
14
12
10
8
20
15
10
5
0
Mean 14.87
StDev 3.088
N 100
Histogram of Mfg Hours
Mfg Hours
Frequency
75
60
45
30
15
0
-15
20
15
10
5
0
Mean 20.19
StDev 18.87
N 100
Histogram of Mfg Hours
Normal Data
Bimodal Data
Skewed Data
The shape of your data is
important for determining
which type of Capability
Analysis applies. If the
data exhibits a non-normal
shape, consult your
statistics reference.
Step 5 Assess data characteristics
11/20/2021 Hamed.Ali.Mohamed2@gmail.com 139
140. Step 6: Process Stability
Process is stable and in
control
Process is not stable and
therefore not in control
Control Chart Examples
Step 6
Capability is only valid
when the process being
studied is stable!
Assess process stability in order to understand
how your process behaves over time. Control
charts are the recommended tool.
11/20/2021 Hamed.Ali.Mohamed2@gmail.com 140
141. Difference between Cp & Cpk
Cp – determines capability of producing to specification
Cpk – same as Cp, but also measures how centered the process is
It is important to look at both!
Cp > 1.67
Cpk > 1.67
Capable,
Centered
LSL USL LSL USL
Capable,
Not Centered
Not Capable,
Centered
Not Capable,
Not Centered
LSL USL LSL USL
Cp < 1.00
Cpk < 0
Cpk < 1.00
Cp < 1.00
Cpk < 1.00
Cp > 1.67
11/20/2021 Hamed.Ali.Mohamed2@gmail.com 141
142. Acceptance Criteria
Short-term Long-term Decision
Red (Bad) <1.33 <1.00
Yellow (Marginal)
1.33-1.67 1.00-1.33
Green (Good)
>1.67 >1.33
Acceptance criteria for critical vs. non-critical characteristics
Cpk must be greater than or equal to
1.67 for critical processes
Cpk must be greater than or equal to
1.33 for non-critical processes
143. Initial Process Study: Reviewer’s
Checklist
Check to see if the data demonstrates a stable process and
exhibits a normal distribution
• Note: source data/ charts to understand stability may not always be
provided. If you have concerns, ask for the data.
PPAPs should only be approved if the capability is greater
than 1.67 for critical dimensions and greater than 1.33 for
non-critical dimensions
Capability template is in the PPAP Workbook
11/20/2021 Hamed.Ali.Mohamed2@gmail.com 143
144. PPAP Element #12:
Qualified Laboratory Documentation
• Inspection and testing for PPAP shall be performed by a
qualified laboratory (e.g., an accredited laboratory).
• The qualified laboratory (internal or external to the
supplier) shall have a laboratory scope and
documentation showing that the laboratory is qualified
for the type of measurements or tests conducted
• When an external laboratory is used, the supplier shall submit
the test results on the laboratory letterhead or the normal
laboratory report format
• The name of the laboratory that performed the tests, the
date(s) of the tests, and the standards used to run the tests
shall be identified.
• Eaton to validate results to specifications.
11/20/2021 Hamed.Ali.Mohamed2@gmail.com 144
145. PPAP Element #13:
Appearance Approval Report
When to Use It
• Prior to tooling for production
What is It?
• A report completed by the supplier
containing appearance and color
criteria
Only applies for parts with color, grain,
or surface appearance requirements
IMPORTANT!
Objective or Purpose
• To demonstrate that the part has
met the appearance requirements
on the design record
APPEARANCE APPROVAL REPORT
PART DRAWING APPLICATION
NUMBER NUMBER (VEHICLES)
PART BUYER E/CLEVEL DATE
NAME CODE
ORGANIZATION MANUFACTURING SUPPLIER/ VENDOR
NAME LOCATION CODE
REASONFOR PART SUBMISSIONWARRANT SPECIAL SAMPLE RE-SUBMISSION OTHER
SUBMISSION PRETEXTURE FIRST PRODUCTIONSHIPMENT ENGINEERING CHANGE
APPEARANCE EVALUATION
AUTHORIZEDCUSTOMER
ORGANIZATION SOURCING AND TEXTURE INFORMATION PRE-TEXTURE REPRESENTATIVE
EVALUATION SIGNATUREANDDATE
COLOR EVALUATION
COLOR
COLOR TRISTIMULUS DATA MASTER MASTER MATERIALMATERIAL HUE VALUE CHROMA GLOSS BRILLIANCE SHIPPING PART
SUFFIX DL* Da* Db* DE* CMC NUMBER DATE TYPE SOURCE RED YEL GRN BLU LIGHT DARK GRAY CLEAN HIGH LOW HIGH LOW SUFFIX DISPOSITION
METALLIC
CORRECT AND
PROCEED
CORRECT AND
PROCEED
APPROVEDTO
ETCH/TOOL/EDM
11/20/2021 Hamed.Ali.Mohamed2@gmail.com 145
146. Appearance Approval Report
APPEARANCE APPROVAL REPORT
PART DRAWING APPLICATION
NUMBER NUMBER (VEHICLES)
PART BUYER E/C LEVEL DATE
NAME CODE
ORGANIZATION MANUFACTURING SUPPLIER / VENDOR
NAME LOCATION CODE
REASON FOR PART SUBMISSION WARRANT SPECIAL SAMPLE RE-SUBMISSION OTHER
SUBMISSION PRETEXTURE FIRST PRODUCTION SHIPMENT ENGINEERING CHANGE
APPEARANCE EVALUATION
AUTHORIZED CUSTOMER
ORGANIZATION SOURCING AND TEXTURE INFORMATION PRE-TEXTURE REPRESENTATIVE
EVALUATION SIGNATUREAND DATE
COLOR EVALUATION
COLOR
COLOR TRISTIMULUS DATA MASTER MASTER MATERIAL MATERIAL HUE VALUE CHROMA GLOSS BRILLIANCE SHIPPING PART
SUFFIX DL* Da* Db* DE* CMC NUMBER DATE TYPE SOURCE RED YEL GRN BLU LIGHT DARK GRAY CLEAN HIGH LOW HIGH LOW SUFFIX DISPOSITION
METALLIC
CORRECT AND
PROCEED
CORRECT AND
PROCEED
APPROVED TO
ETCH/TOOL/EDM
Administrative Section
Identifies part number and description,
supplier, required approval signatures, and
dates.
11/20/2021 Hamed.Ali.Mohamed2@gmail.com 146
147. APPEARANCE APPROVAL REPORT
PART DRAWING APPLICATION
NUMBER NUMBER NUMBER (VEHICLES) APPLICATION
PART BUYER E/C LEVEL DATE
NAME NAME CODE ECL
ORGANIZATION MANUFACTURING ADDRESS SUPPLIER / VENDOR
NAME ORGANIZATION LOCATION CITY STATE ZIP CODE CODE
REASON FOR PART SUBMISSION WARRANT SPECIAL SAMPLE RE-SUBMISSION OTHER
SUBMISSION PRETEXTURE FIRST PRODUCTION SHIPMENT ENGINEERING CHANGE
APPEARANCE EVALUATION
AUTHORIZED CUSTOMER
ORGANIZATION SOURCING AND TEXTURE INFORMATION PRE-TEXTURE REPRESENTATIVE
EVALUATION SIGNATUREAND DATE
COLOR EVALUATION
COLOR
COLOR TRISTIMULUS DATA MASTER MASTER MATERIAL MATERIAL HUE VALUE CHROMA GLOSS BRILLIANCE SHIPPING PART
SUFFIX DL* Da* Db* DE* CMC NUMBER DATE TYPE SOURCE RED YEL GRN BLU LIGHT DARK GRAY CLEAN HIGH LOW HIGH LOW SUFFIX DISPOSITION
COMMENTS
CORRECT AND
PROCEED
CORRECT AND
PROCEED
APPROVED TO
ETCH/TOOL/EDM
METALLIC
Appearance Approval Report
Appearance Evaluation Details
Identifies supplier sourcing, texture information
and submission customer signature.
11/20/2021 Hamed.Ali.Mohamed2@gmail.com 147
148. Appearance Approval Report
COLOR EVALUATION
COLOR
COLOR TRISTIMULUS DATA MASTER MASTER MATERIAL MATERIAL HUE VALUE CHROMA GLOSS BRILLIANCE SHIPPING PART
SUFFIX DL* Da* Db* DE* CMC NUMBER DATE TYPE SOURCE RED YEL GRN BLU LIGHT DARK GRAY CLEAN HIGH LOW HIGH LOW SUFFIX DISPOSITION
COMMENTS
ORGANIZATION PHONENO. DATE AUTHORIZED CUSTOMER DATE
SIGNATURE REPRESENTATIVESIGNATURE
METALLIC
Color Evaluation Details
• Identifies supplier part color
dimensions, use of color spectrometer
or RAL charts to determine finish
information
• Requires supplier and customer to sign
11/20/2021 Hamed.Ali.Mohamed2@gmail.com 148
149. PPAP Element #14:
Sample Production Parts
Actual samples that reflect the parts
documented in the PPAP.
What is It?
Objective or Purpose
• Confirm cosmetic or functional
part approval.
When to Use It
• Sample parts should be delivered
WITH the PPAP submission
11/20/2021 Hamed.Ali.Mohamed2@gmail.com 149
150. Sample Production Parts
• The sample parts provided should be the same
parts measured for the dimensional results
• PPAP sample quantity is based on needs from Eaton
Engineering, Manufacturing and Quality
11/20/2021 Hamed.Ali.Mohamed2@gmail.com 150
151. Sample Production Parts
Sample production parts MUST be properly identified
Include the following information on the part label:
• Date parts were packed
• Eaton part number
• Quantity
• Serial number
• Supplier part number (optional)
• Part description
• Country of origin
• Indication of regulatory compliance where applicable (RoHS,
REACH, Conflict Minerals, etc.)
• Approval markings (UL, CE, etc.) where applicable
11/20/2021 Hamed.Ali.Mohamed2@gmail.com 151