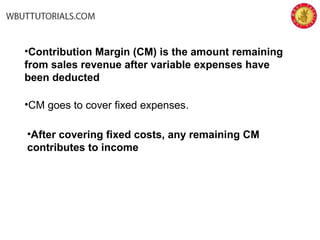
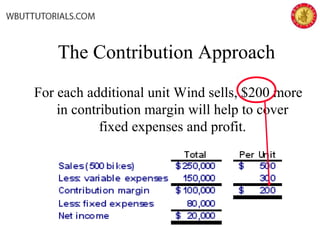
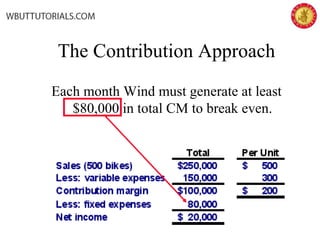
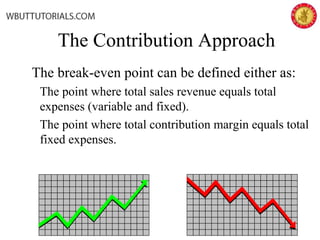
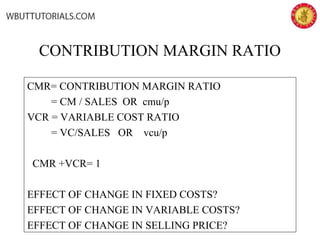
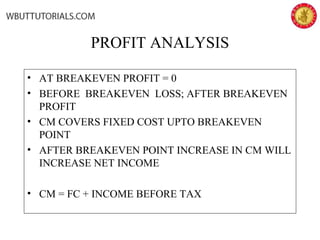
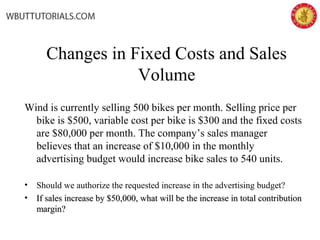
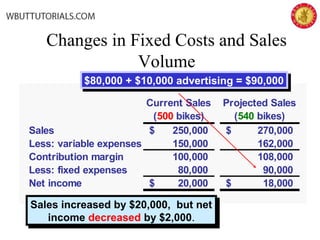
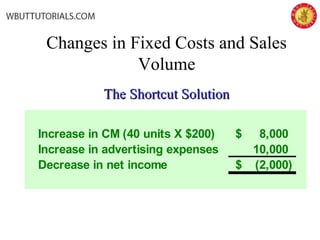
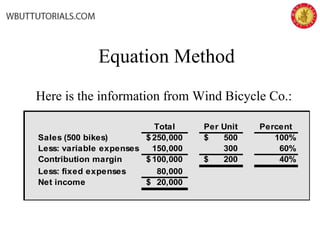
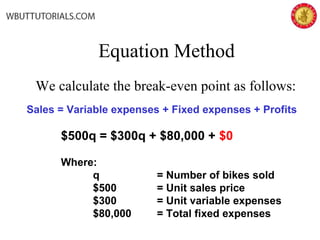
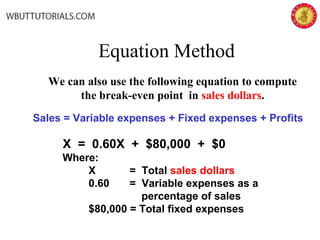
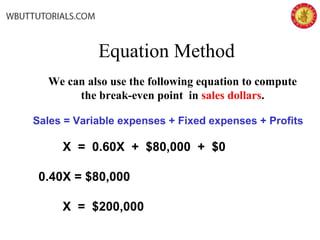
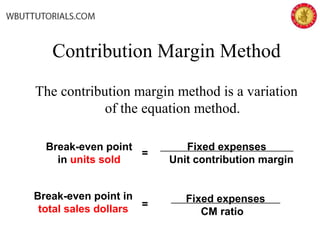
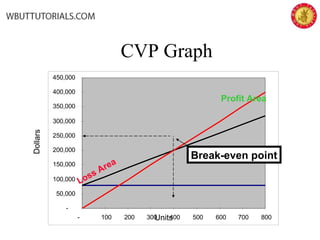
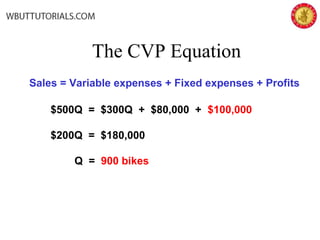
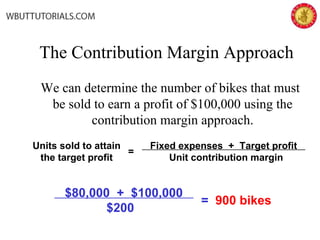
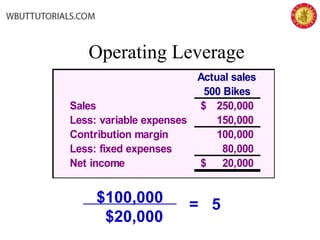
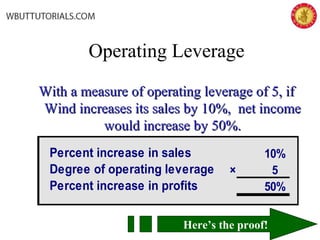
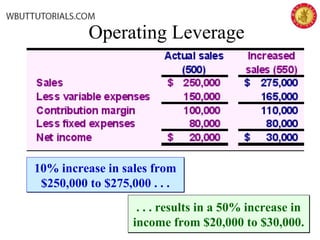
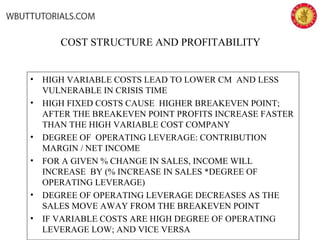
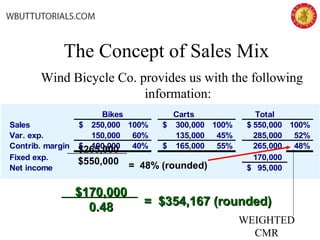
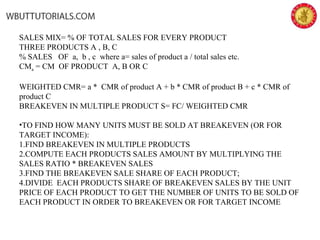
This document discusses cost-volume-profit analysis and break-even analysis. It defines key terms like contribution margin, variable costs, fixed costs, and sales mix. It provides examples of using the equation method and contribution margin method to calculate break-even points. It also discusses how to calculate target profit, margin of safety, operating leverage, and deals with break-even analysis for situations with multiple products or a sales mix.
Cost Volume Profit (CVP).
Introduction
Fixed costs
Variable costs
Semi variable costs
Contribution margin
Break even point
PV Ratio
BEP ANalysis.
break even point
Cost-volume-Profit.
the document is on Cost volume profit analysis.
(Cost-volume-profit (CVP) analysis is used to determine how changes in costs and volume affect a company's operating income and net income.)
DEFINITION of 'Operating Leverage'
A measurement of the degree to which a firm or project incurs a combination of fixed and variable costs.
1. A business that makes few sales, with each sale providing a very high gross margin, is said to be highly leveraged. A business that makes many sales, with each sale contributing a very slight margin, is said to be less leveraged. As the volume of sales in a business increases, each new sale contributes less to fixed costs and more to profitability.
2. A business that has a higher proportion of fixed costs and a lower proportion of variable costs is said to have used more operating leverage. Those businesses with lower fixed costs and higher variable costs are said to employ less operating leverage.
Financial Leverage:
Financial leverage is the degree to which a company uses fixed-income securities such as debt and preferred equity. The more debt financing a company uses, the higher its financial leverage. A high degree of financial leverage means high interest payments, which negatively affect the company's bottom-line earnings per share.
Financial risk is the risk to the stockholders that is caused by an increase in debt and preferred equities in a company's capital structure. As a company increases debt and preferred equities, interest payments increase, reducing EPS. As a result, risk to stockholder return is increased. A company should keep its optimal capital structure in mind when making financing decisions to ensure any increases in debt and preferred equity increase the value of the company.
Cost means the amount of expenditure (actual or notional) incurred on, or attributable to, a given thing.
The Institute of Cost and Management Accountant, England (ICMA) has defined Cost Accounting as – “the process of accounting for the costs from the point at which expenditure incurred, to the establishment of its ultimate relationship with cost centers and cost units.
In its widest sense, it embraces the preparation of statistical data, the application of cost control methods and the ascertainment of the profitability of activities carried out or planned”.
Biological screening of herbal drugs: Introduction and Need for
Phyto-Pharmacological Screening, New Strategies for evaluating
Natural Products, In vitro evaluation techniques for Antioxidants, Antimicrobial and Anticancer drugs. In vivo evaluation techniques
for Anti-inflammatory, Antiulcer, Anticancer, Wound healing, Antidiabetic, Hepatoprotective, Cardio protective, Diuretics and
Antifertility, Toxicity studies as per OECD guidelines
Welcome to TechSoup New Member Orientation and Q&A (May 2024).pdfTechSoup
In this webinar you will learn how your organization can access TechSoup's wide variety of product discount and donation programs. From hardware to software, we'll give you a tour of the tools available to help your nonprofit with productivity, collaboration, financial management, donor tracking, security, and more.
Francesca Gottschalk - How can education support child empowerment.pptxEduSkills OECD
Francesca Gottschalk from the OECD’s Centre for Educational Research and Innovation presents at the Ask an Expert Webinar: How can education support child empowerment?
Introduction to AI for Nonprofits with Tapp NetworkTechSoup
Dive into the world of AI! Experts Jon Hill and Tareq Monaur will guide you through AI's role in enhancing nonprofit websites and basic marketing strategies, making it easy to understand and apply.
Honest Reviews of Tim Han LMA Course Program.pptxtimhan337
Personal development courses are widely available today, with each one promising life-changing outcomes. Tim Han’s Life Mastery Achievers (LMA) Course has drawn a lot of interest. In addition to offering my frank assessment of Success Insider’s LMA Course, this piece examines the course’s effects via a variety of Tim Han LMA course reviews and Success Insider comments.
The French Revolution, which began in 1789, was a period of radical social and political upheaval in France. It marked the decline of absolute monarchies, the rise of secular and democratic republics, and the eventual rise of Napoleon Bonaparte. This revolutionary period is crucial in understanding the transition from feudalism to modernity in Europe.
For more information, visit-www.vavaclasses.com
Embracing GenAI - A Strategic ImperativePeter Windle
Artificial Intelligence (AI) technologies such as Generative AI, Image Generators and Large Language Models have had a dramatic impact on teaching, learning and assessment over the past 18 months. The most immediate threat AI posed was to Academic Integrity with Higher Education Institutes (HEIs) focusing their efforts on combating the use of GenAI in assessment. Guidelines were developed for staff and students, policies put in place too. Innovative educators have forged paths in the use of Generative AI for teaching, learning and assessments leading to pockets of transformation springing up across HEIs, often with little or no top-down guidance, support or direction.
This Gasta posits a strategic approach to integrating AI into HEIs to prepare staff, students and the curriculum for an evolving world and workplace. We will highlight the advantages of working with these technologies beyond the realm of teaching, learning and assessment by considering prompt engineering skills, industry impact, curriculum changes, and the need for staff upskilling. In contrast, not engaging strategically with Generative AI poses risks, including falling behind peers, missed opportunities and failing to ensure our graduates remain employable. The rapid evolution of AI technologies necessitates a proactive and strategic approach if we are to remain relevant.
Operation “Blue Star” is the only event in the history of Independent India where the state went into war with its own people. Even after about 40 years it is not clear if it was culmination of states anger over people of the region, a political game of power or start of dictatorial chapter in the democratic setup.
The people of Punjab felt alienated from main stream due to denial of their just demands during a long democratic struggle since independence. As it happen all over the word, it led to militant struggle with great loss of lives of military, police and civilian personnel. Killing of Indira Gandhi and massacre of innocent Sikhs in Delhi and other India cities was also associated with this movement.
2. COST VOLUME PROFIT ANALYSIS
• HELPFUL TO UNDERSTAND THE RELATIONSHIP
AMONG VARIABLE COSTS, FIXED COSTS AND PROFIT
• BASIC ASSUMPTIONS:
– SELLING PRICE IS CONSTANT
– COSTS ARE LINEAR; AND CAN BE DIVIDED INTO
FIXED AND VARIABLE; FIXED ELEMENT
CONSTANT OVER THE RELEVANT RANGE; UNIT
VARIABLE COST CONSTANT OVER RELEVANT
RANGE
– SALES MIX IS CONSTANT
– INVENTORIES STAY AT THE SAME LEVEL
3. •Contribution Margin (CM) is the amount remaining
from sales revenue after variable expenses have
been deducted
•CM goes to cover fixed expenses.
•After covering fixed costs, any remaining CM
contributes to income
4. The Contribution Approach
For each additional unit Wind sells, $200 more
in contribution margin will help to cover
fixed expenses and profit.
6. The Contribution Approach
The break-even point can be defined either as:
The point where total sales revenue equals total
expenses (variable and fixed).
The point where total contribution margin equals total
fixed expenses.
7. CONTRIBUTION MARGIN RATIO
CMR= CONTRIBUTION MARGIN RATIO
= CM / SALES OR cmu/p
VCR = VARIABLE COST RATIO
= VC/SALES OR vcu/p
CMR +VCR= 1
EFFECT OF CHANGE IN FIXED COSTS?
EFFECT OF CHANGE IN VARIABLE COSTS?
EFFECT OF CHANGE IN SELLING PRICE?
8. PROFIT ANALYSIS
• AT BREAKEVEN PROFIT = 0
• BEFORE BREAKEVEN LOSS; AFTER BREAKEVEN
PROFIT
• CM COVERS FIXED COST UPTO BREAKEVEN
POINT
• AFTER BREAKEVEN POINT INCREASE IN CM WILL
INCREASE NET INCOME
• CM = FC + INCOME BEFORE TAX
9. Changes in Fixed Costs and Sales
Volume
Wind is currently selling 500 bikes per month. Selling price per
bike is $500, variable cost per bike is $300 and the fixed costs
are $80,000 per month. The company’s sales manager
believes that an increase of $10,000 in the monthly
advertising budget would increase bike sales to 540 units.
• Should we authorize the requested increase in the advertising budget?
• If sales increase by $50,000, what will be the increase in total contributionIf sales increase by $50,000, what will be the increase in total contribution
margin?margin?
10. Current Sales
(500 bikes)
Projected Sales
(540 bikes)
Sales 250,000$ 270,000$
Less: variable expenses 150,000 162,000
Contribution margin 100,000 108,000
Less: fixed expenses 80,000 90,000
Net income 20,000$ 18,000$
Changes in Fixed Costs and Sales
Volume
Sales increased by $20,000, but net
income decreased by $2,000..
Sales increased by $20,000, but net
income decreased by $2,000..
$80,000 + $10,000 advertising = $90,000$80,000 + $10,000 advertising = $90,000
11. Changes in Fixed Costs and Sales
Volume
The Shortcut SolutionThe Shortcut Solution
Increase in CM (40 units X $200) 8,000$
Increase in advertising expenses 10,000
Decrease in net income (2,000)$
13. Equation Method
Profits(before tax) =
Sales – (Variable expenses + Fixed expenses)
Sales = Variable expenses + Fixed expenses + Profits
(before tax)
OR
At the break-even point
profits equal zero.
14. DERIVATION OF EQUATIONS
SALES= VARIABLE COSTS+FIXED COSTS + PROFIT
p*q= vcu *q + FC + 
AT BREAKEVEN PROFIT = 0
p*q=vcu *q +FC
q * (p-vcu) = FC
q= FC / (p - vcu) OR q=FC/ cmu
CM= SALES - TOTAL VC
VC= SALES - CM= INCLUDE VARIABLE PRODUCTION AND
SELLING EXPENSES
cmu=CONTRIBUTION MARGIN PER UNIT= p - vcu=CM/q
vcu= VARIABLE COST PER UNIT= VC/ q
q number of units
15. Equation Method
Here is the information from Wind Bicycle Co.:
Total Per Unit Percent
Sales (500 bikes) 250,000$ 500$ 100%
Less: variable expenses 150,000 300 60%
Contribution margin 100,000$ 200$ 40%
Less: fixed expenses 80,000
Net income 20,000$
16. Equation Method
We calculate the break-even point as follows:
Sales = Variable expenses + Fixed expenses + Profits
$500q = $300q + $80,000 + $0
Where:
q = Number of bikes sold
$500 = Unit sales price
$300 = Unit variable expenses
$80,000 = Total fixed expenses
17. Equation Method
We can also use the following equation to compute
the break-even point in sales dollars.
Sales = Variable expenses + Fixed expenses + Profits
X = 0.60X + $80,000 + $0
Where:
X = Total sales dollars
0.60 = Variable expenses as a
percentage of sales
$80,000 = Total fixed expenses
18. Equation Method
We can also use the following equation to compute
the break-even point in sales dollars.
Sales = Variable expenses + Fixed expenses + Profits
X = 0.60X + $80,000 + $0
0.40X = $80,000
X = $200,000
19. Contribution Margin Method
The contribution margin method is a variation
of the equation method.
Fixed expenses
Unit contribution margin
=
Break-even point
in units sold
Fixed expenses
CM ratio
=
Break-even point in
total sales dollars
21. Target Profit Analysis
Suppose Wind Co. wants to know how many
bikes must be sold to earn a profit of
$100,000.
We can use our CVP formula to determine the
sales volume needed to achieve a target net
profit figure.
23. The Contribution Margin Approach
We can determine the number of bikes that must
be sold to earn a profit of $100,000 using the
contribution margin approach.
Fixed expenses + Target profit
Unit contribution margin
=
Units sold to attain
the target profit
$80,000 + $100,000
$200
= 900 bikes
24. The Margin of Safety
Excess of budgeted (or actual) sales over the
break-even volume of sales. The amount by
which sales can drop before losses begin to
be incurred.
Margin of safety = Total sales - Break-even sales
Let’s calculate the margin of safety for Wind.
25. The Margin of Safety
Wind has a break-even point of $200,000. If
actual sales are $250,000, the margin of safety is
$50,000 or 100 bikes.
Break-even
sales
400 units
Actual sales
500 units
Sales 200,000$ 250,000$
Less: variable expenses 120,000 150,000
Contribution margin 80,000 100,000
Less: fixed expenses 80,000 80,000
Net income -$ 20,000$
26. Break-even
sales
400 units
Actual sales
500 units
Sales 200,000$ 250,000$
Less: variable expenses 120,000 150,000
Contribution margin 80,000 100,000
Less: fixed expenses 80,000 80,000
Net income -$ 20,000$
The Margin of Safety
The margin of safety can be expressed as 20
percent of sales.
($50,000 ÷ $250,000)
27. MARGIN OF SAFETY
: EXCESS OF SALES (EITHER ACTUAL OR FORECASTED ) OVER
THE BREAKEVEN SALES I.E., THE BUFFER AMOUNT
MoS $= ACTUAL OR BUDGETED SALES - BREAKEVEN SALES $
MoS % = MoS $ / ACTUAL OR BUDGETED SALES
BREAKEVEN SALES IN SINGLE PRODUCT SETTING
SALES $ = VC$ + FC$
WHERE VCR= x% *SALES THEN 1-x% = CMR
SALES $ = x% *SALES +FC
(1-x)* SALES $ = FC THAT IS CMR*SALES = FC
SALES $ AT BREAKEVEN = FC/ CMR
28. Operating Leverage
• A measure of how sensitive net income is to
percentage changes in sales.
• With high leverage, a small percentage increase
in sales can produce a much larger percentage
increase in net income.
Contribution margin
Net income
Degree of
operating leverage =
29. Operating Leverage
Actual sales
500 Bikes
Sales 250,000$
Less: variable expenses 150,000
Contribution margin 100,000
Less: fixed expenses 80,000
Net income 20,000$
$100,000
$20,000
= 5
30. Operating Leverage
With a measure of operating leverage of 5, ifWith a measure of operating leverage of 5, if
Wind increases its sales by 10%, net incomeWind increases its sales by 10%, net income
would increase by 50%.would increase by 50%.
Percent increase in sales 10%
Degree of operating leverage × 5
Percent increase in profits 50%
Here’s the proof!
31. Operating Leverage
10% increase in sales from
$250,000 to $275,000 . . .
10% increase in sales from
$250,000 to $275,000 . . .
. . . results in a 50% increase in
income from $20,000 to $30,000.
. . . results in a 50% increase in
income from $20,000 to $30,000.
32. COST STRUCTURE AND PROFITABILITY
• HIGH VARIABLE COSTS LEAD TO LOWER CM AND LESS
VULNERABLE IN CRISIS TIME
• HIGH FIXED COSTS CAUSE HIGHER BREAKEVEN POINT;
AFTER THE BREAKEVEN POINT PROFITS INCREASE FASTER
THAN THE HIGH VARIABLE COST COMPANY
• DEGREE OF OPERATING LEVERAGE: CONTRIBUTION
MARGIN / NET INCOME
• FOR A GIVEN % CHANGE IN SALES, INCOME WILL
INCREASE BY (% INCREASE IN SALES *DEGREE OF
OPERATING LEVERAGE)
• DEGREE OF OPERATING LEVERAGE DECREASES AS THE
SALES MOVE AWAY FROM THE BREAKEVEN POINT
• IF VARIABLE COSTS ARE HIGH DEGREE OF OPERATING
LEVERAGE LOW; AND VICE VERSA
33. The Concept of Sales Mix
• Sales mix is the relative proportions in which a
company’s products are sold.
• Different products have different selling prices,
cost structures, and contribution margins.
Let’s assume Wind sells bikes and carts and see
how we deal with break-even analysis.
34. The Concept of Sales Mix
Wind Bicycle Co. provides us with the following
information:
Bikes Carts Total
Sales 250,000$ 100% 300,000$ 100% 550,000$ 100%
Var. exp. 150,000 60% 135,000 45% 285,000 52%
Contrib. margin 100,000$ 40% 165,000$ 55% 265,000 48%
Fixed exp. 170,000
Net income 95,000$
$265,000
$550,000 = 48% (rounded)
$170,000$170,000
0.480.48 = $354,167 (rounded)= $354,167 (rounded)
WEIGHTED
CMR
35. SALES MIX= % OF TOTAL SALES FOR EVERY PRODUCT
THREE PRODUCTS A , B, C
% SALES OF a, b , c where a= sales of product a / total sales etc.
CMa = CM OF PRODUCT A, B OR C
WEIGHTED CMR= a * CMR of product A + b * CMR of product B + c * CMR of
product C
BREAKEVEN IN MULTIPLE PRODUCT S= FC/ WEIGHTED CMR
•TO FIND HOW MANY UNITS MUST BE SOLD AT BREAKEVEN (OR FOR
TARGET INCOME):
1.FIND BREAKEVEN IN MULTIPLE PRODUCTS
2.COMPUTE EACH PRODUCTS SALES AMOUNT BY MULTIPLYING THE
SALES RATIO * BREAKEVEN SALES
3.FIND THE BREAKEVEN SALE SHARE OF EACH PRODUCT;
4.DIVIDE EACH PRODUCTS SHARE OF BREAKEVEN SALES BY THE UNIT
PRICE OF EACH PRODUCT TO GET THE NUMBER OF UNITS TO BE SOLD OF
EACH PRODUCT IN ORDER TO BREAKEVEN OR FOR TARGET INCOME