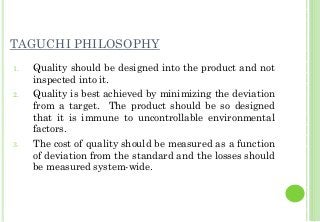
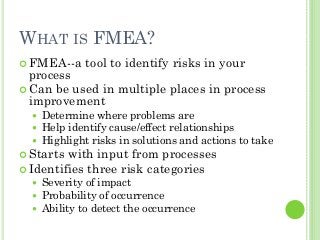
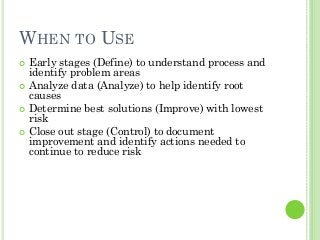
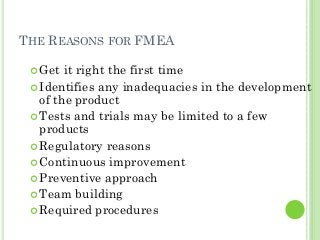
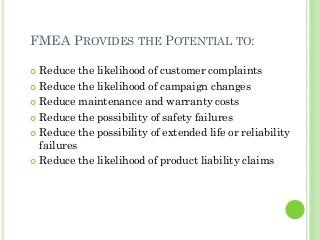
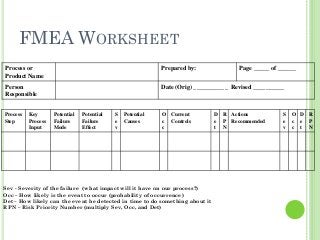
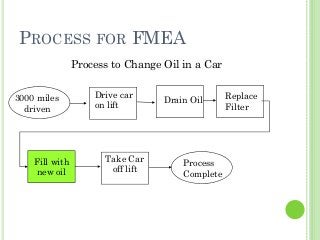
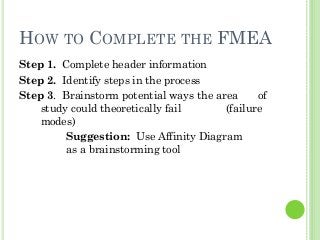
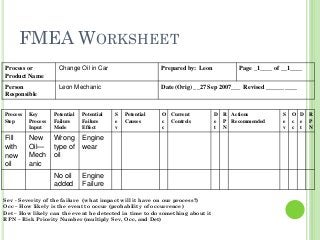
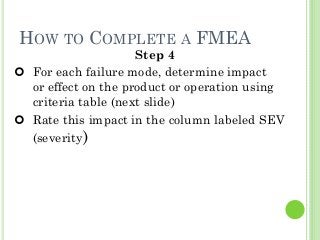
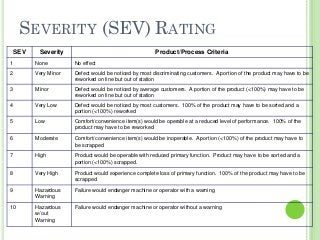
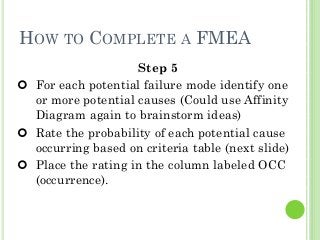
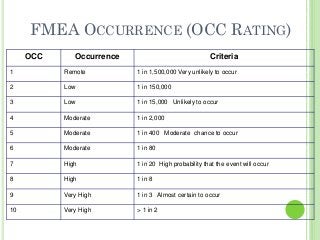
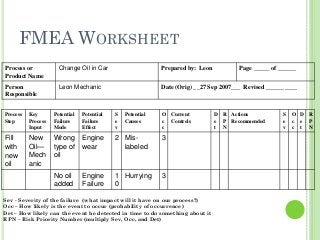
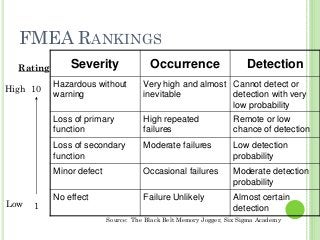
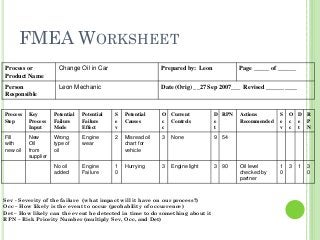
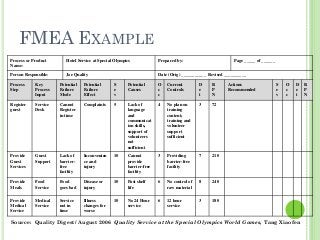
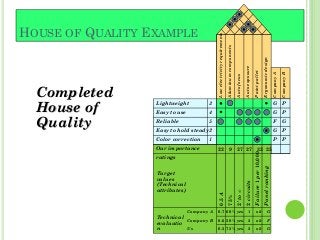
This document provides an overview of failure mode and effects analysis (FMEA). FMEA is a systematic process for identifying potential failures in a design, manufacturing or production process. It involves reviewing all possible failures, their causes and effects. Potential failures are ranked according to severity, occurrence, and the ability to detect the failure. This ranking is used to identify areas that need improvement and prevent potential problems. The document discusses the different types of FMEAs (e.g. design, process), how to conduct one including using a worksheet to document the analysis, and how FMEAs can benefit processes by reducing risks and costs.


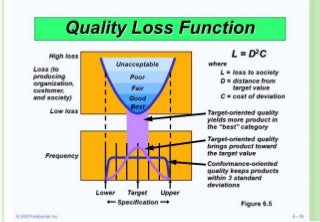
![In Taguchi's view tolerance specifications are given by
engineers and not by customers; what the customer
experiences is 'loss'. This equation is true for a single
product; if 'loss' is to be calculated for multiple
products the loss function is given by
L = k[S2 + y – m)2],
where S2 is the 'variance of product size' and y is the
average product size.](https://image.slidesharecdn.com/unit3-171116133246/85/Unit-3-161-320.jpg?cb=1690468223)
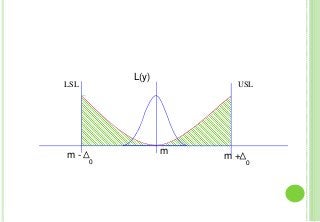
![Average quality loss
Q = k [( m - μ )2 + σ 2 ]
It consists of two components:
Shift of process average (μ) from the target
value (m)
Spread of the process (σ2)
S/N ratios are a log-modified form of Average
quality loss function](https://image.slidesharecdn.com/unit3-171116133246/85/Unit-3-166-320.jpg?cb=1690468223)