Download to read offline
![International Journal of Technical Research and Applications e-ISSN: 2320-8163,
www.ijtra.com Volume 3, Issue 3 (May-June 2015), PP. 245-251
248 | P a g e
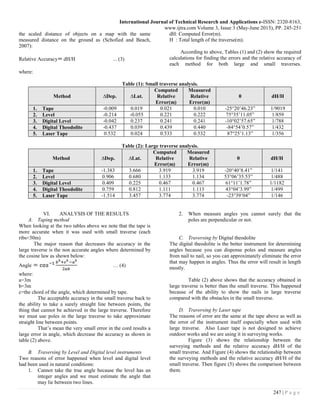
Figure (3): Small traverse analysis [y-axis represents
1/(dH/H)].
Figure (4): Large traverse analysis [y-axis represents
1/(dH/H)].
Figure (5): A comparison between two traverses analysis
[y-axis represents 1/(dH/H)].
VII. DIGITAL TOPOGRAPHIC MAPPING
A topographic map is a type of map characterized by
large-scale detail and quantitative representation of relief,
usually using contour lines in modern mapping, but
historically using a variety of methods. Traditional definitions
require a topographic map to show both natural and man-made
features. A topographic map is typically published as a map
series, made up of two or more map sheets that combine to
form the whole map. A contour line is a combination of two
line segments that connect but do not intersect; these represent
elevation on a topographic map. Figure (6) shows an example
of the topographic map (Roy, 1999).
The digital map is not just a computer-readable file of
map data. Visvalingam (1989) proposed that the term implies
"a compact, structured, integrated and elegant representation
of spatial data and their spatial attributes in a manner that
facilitates rapid inference and retrieval and speedy but error-
free update of data. This implies pre-processing and
substantial restructuring of input data so that the digital post-
processing system may infer spatial forms, relationships and
patterns in a way, which matches, and if possible surpasses,
human information processing capabilities". This definition
excludes uninterrupted raster and video-scanned images and
spaghetti vectors, despite their value and use as visual maps.
The full benefits of digital mapping can only be realized
when the required data are already in computer-readable form.
There is now a large primary sector within the computer
mapping industry, which is mainly concerned with the
collection, processing, validation, maintenance and
distribution of spatial data. Both in theory and in practice the
map database has become the ultimate reference map - the
digital map, which is a commercial product in its own right
(Visvalingam, 1989).
Figure (6): Topographic Map of Al-Mada'en City in Iraq.
ArcView software is one among several sotwares of GIS.
It is a desktop system for storing, querying, modifying,
analyzing and displaying information about geographic space.
An intuitive graphical user interface includes data display and
a viewing tool. Support for spatial and tabular queries, ‘hot
links’ to other desktop applications and data types, business
graphics functions such as charting, bar and pie charts, and
map symbolization, design, and layout capabilities are
supported. Geo-coding and address matching are also possible.
The Spatial Analyst tool kit makes working with raster data
such as terrain and DEMs possible. Other extensions permit](https://image.slidesharecdn.com/ijtra150522-160123080534/85/ERROR-ESTIMATION-IN-DEVELOPING-GIS-MAPS-USING-DIFFERENT-INPUT-METHODS-OF-LAND-SURVEYING-4-320.jpg)
![International Journal of Technical Research and Applications e-ISSN: 2320-8163,
www.ijtra.com Volume 3, Issue 3 (May-June 2015), PP. 245-251
251 | P a g e
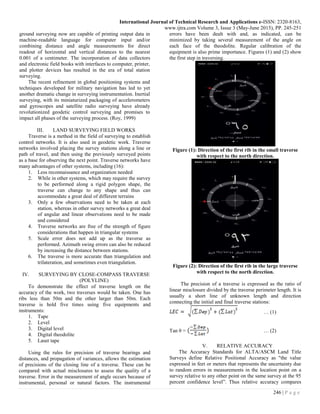
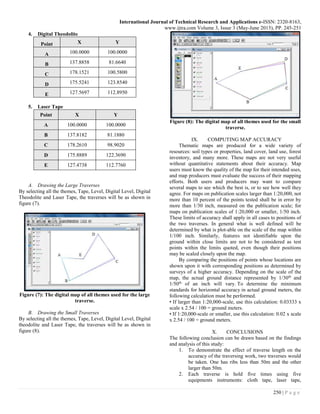
automatic level, digital level and digital theodolite.
3. When using cloth tape in traversing the error was
.021 m. In the small traverse and 3.919 m. in the
large traverse. The amount of the error in the first
traverse is very good but the error in the second
traverse is not. This error may be happened because
of several cause such as:
a) Non accurate angles due to the use of poles
which results error in the chord of the angle.
b) The presence of obstacles was preventing
the tape to be at the same level.
c) Coefficient of linear expansion of the tape
affects the accuracy of the work.
4. When using automatic level in traversing the error
was 0.221 m. In the small traverse and 1.133 m. in
the large traverse. The amount of the error in both
traverses is very good because the level is not
designed for measuring angles. Anyway the error
may be happened due to several cause such as:
a) personal errors have a significant impact on
the accuracy, especially when determining
the lengths, since the upper and lower stadia
are seen difficulty:
Length = (upper reading – lower reading) × 100
b) The true angle couldn’t take because the
level has integer angles and you must
estimate the angle when lay between two
lines.
c) When measuring angles you cannot surely
that the poles are perpendicular or not.
5. By using digital level in traversing the error was
0.241 m. In the small traverse and 0.467m. in the
large traverse. The amount of the error in both
traverses is very good and it was enhanced in the
second traverse. The error may be happened due to
several cause such as:
a) The rule of the digital level does not
contain bubble so it affects on the
lengths.
b) When measuring angles you cannot
surely if the poles are perpendicular.
6. Using digital theodolite in traversing the error was
0.439 m. In the small traverse and 1.111m. in the
large traverse. The amount of the error in both
traverses is not acceptable for accurate works. The
error may be happened due to several cause such as:
a) Instrument error affect on the lengths
and angles.
b) The presence of obstacles prevents
vision of the nails, so you must use
poles which affect the angles.
c) Our personal errors.
7. When using laser tape in traversing the error was
0.533 m. In the small traverse and 3.774 m. in the
large traverse. The amount of the error in the first
traverse is fair for reconnaissance works, but the error
in the second traverse is not. This error may be
happened due to several cause such as:
a) Instrument error affects on the lengths and
angles, since the angles measured by cos law
(length of the chord affect the angle).
b) The presence of obstacles prevents you to
put the laser tape directly on the nail and
measure. So you must raises it by pedestal,
thus you cannot surely that the laser tape
directly over the nail.
8. Details map of the site using a satellite image taken
from Google Earth for building the Department of
Architecture, Al-Salam Hall, roads and gardens
surrounding.
9. AutoCAD drawing program is easier and faster than
ArcView, the large number of tools and commands in
AutoCAD allows the user a lot of options to draw
anything and this is not found in ArcView. GIS is a
database program, and AutoCAD is a graphics
program. With AutoCAD, it’s the lines that are
important, i.e. the drawing is the information. With
GIS, the lines are just a representation of the data
behind it.
REFERNCES
[1] ESRI (2015), “Mapping with ESRI software”,
http://www.esri.com/.
[2] Ibraheem, A. (1997), “The Utilization of Local Resources to
Develop A GIS in Surveying and Route Design”; M.Sc.
Thesis, College of Engineering, University of Baghdad.
[3] Ibraheem, A. Th., Hassan, H. A. and Abd Al-Husain, M. H.
(2012), "Integrating ACAD with GIS for Civil Engineering
Applications", Journal of Software Engineering and
Applications, 2012, 5, 138-146.
[4] Roy, S.K. (1999), “Fundamentals of surveying” Prentice-Hall
India Privale Limited, New-Delhi. All rights reserved.
[5] Schofied W. E, and Breach M. (2007), “Engineering
Surveying”;6th
Edition , Elsevier Ltd. UK.
[6] Visvalingam M. (1989), “Trends and Concerns in Digital
Cartography”, Cartographic Information Systems Research
Group, University of Hull.
https://hydra.hull.ac.uk/assets/hull:8331/content](https://image.slidesharecdn.com/ijtra150522-160123080534/85/ERROR-ESTIMATION-IN-DEVELOPING-GIS-MAPS-USING-DIFFERENT-INPUT-METHODS-OF-LAND-SURVEYING-7-320.jpg)
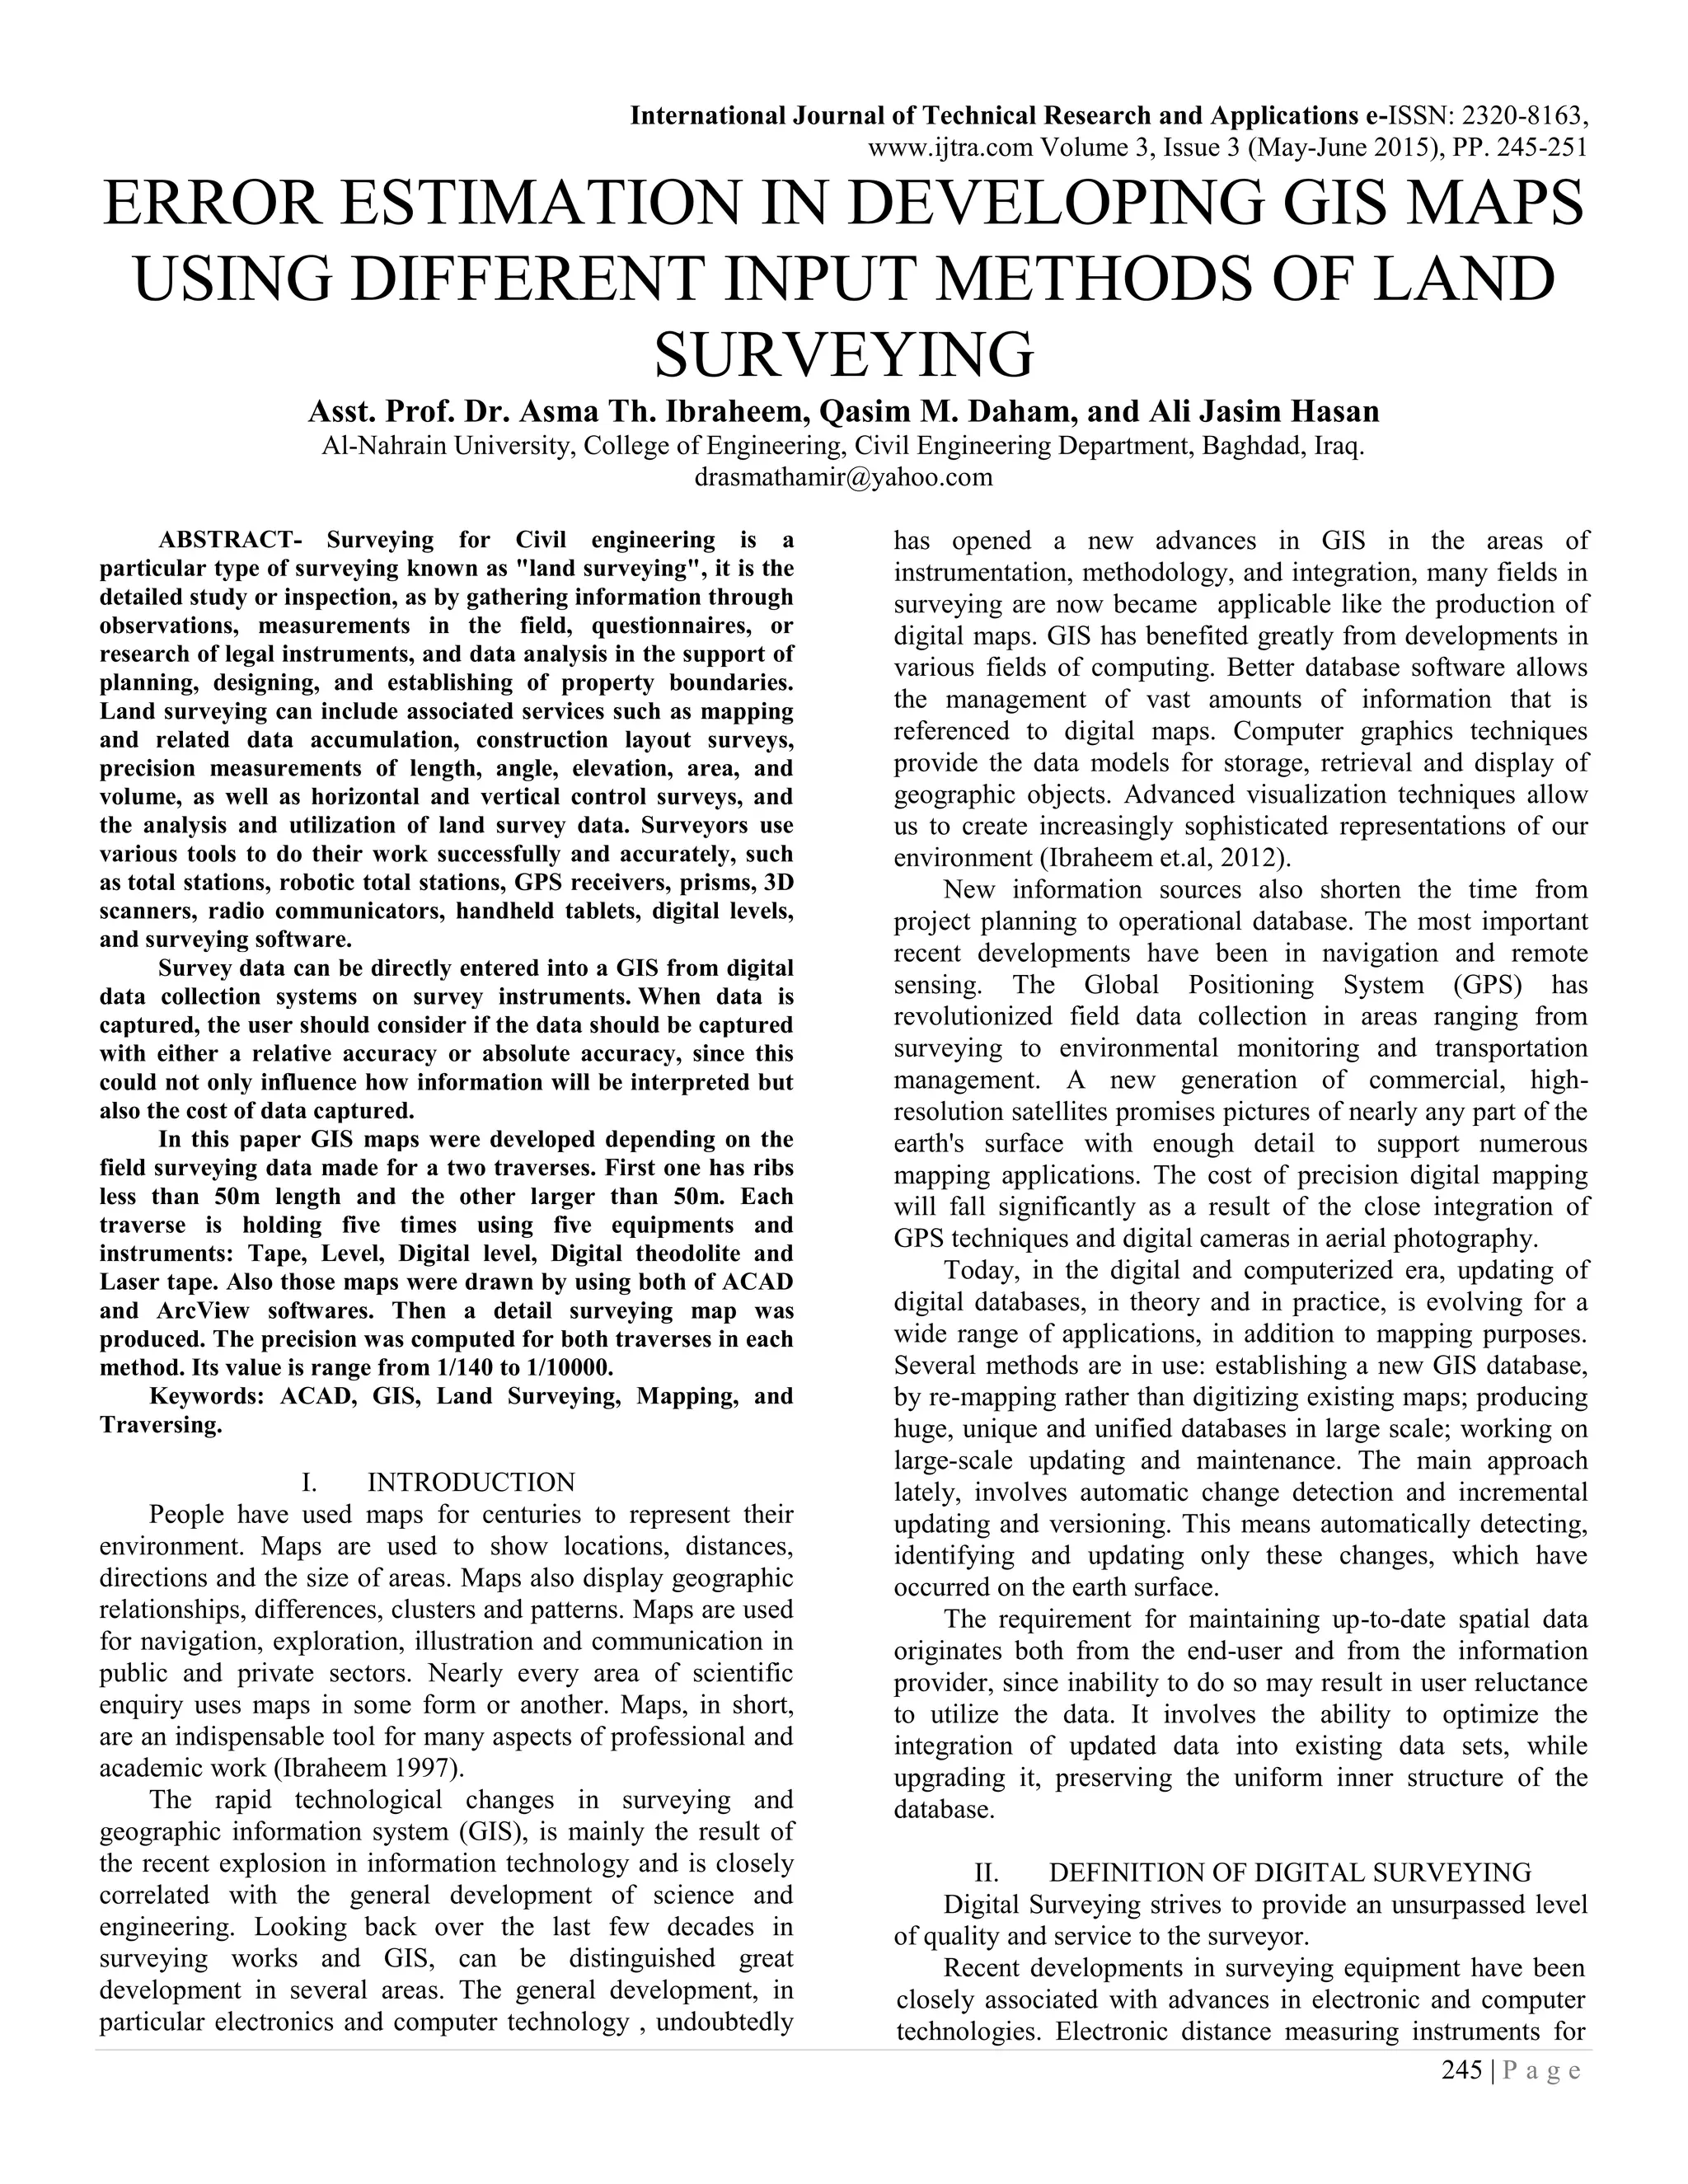
This paper explores the error estimation in developing GIS maps using various land surveying methods, specifically analyzing two traverses of different lengths. The study utilizes multiple surveying instruments, including tape, levels, and digital theodolites, to assess the precision of mapping while highlighting the impact of technological advancements on surveying practices. Results indicate varying accuracy levels based on surveying methods and traverse lengths, with comprehensive discussions around relative accuracy and digital topographic mapping.