Downloaded 814 times


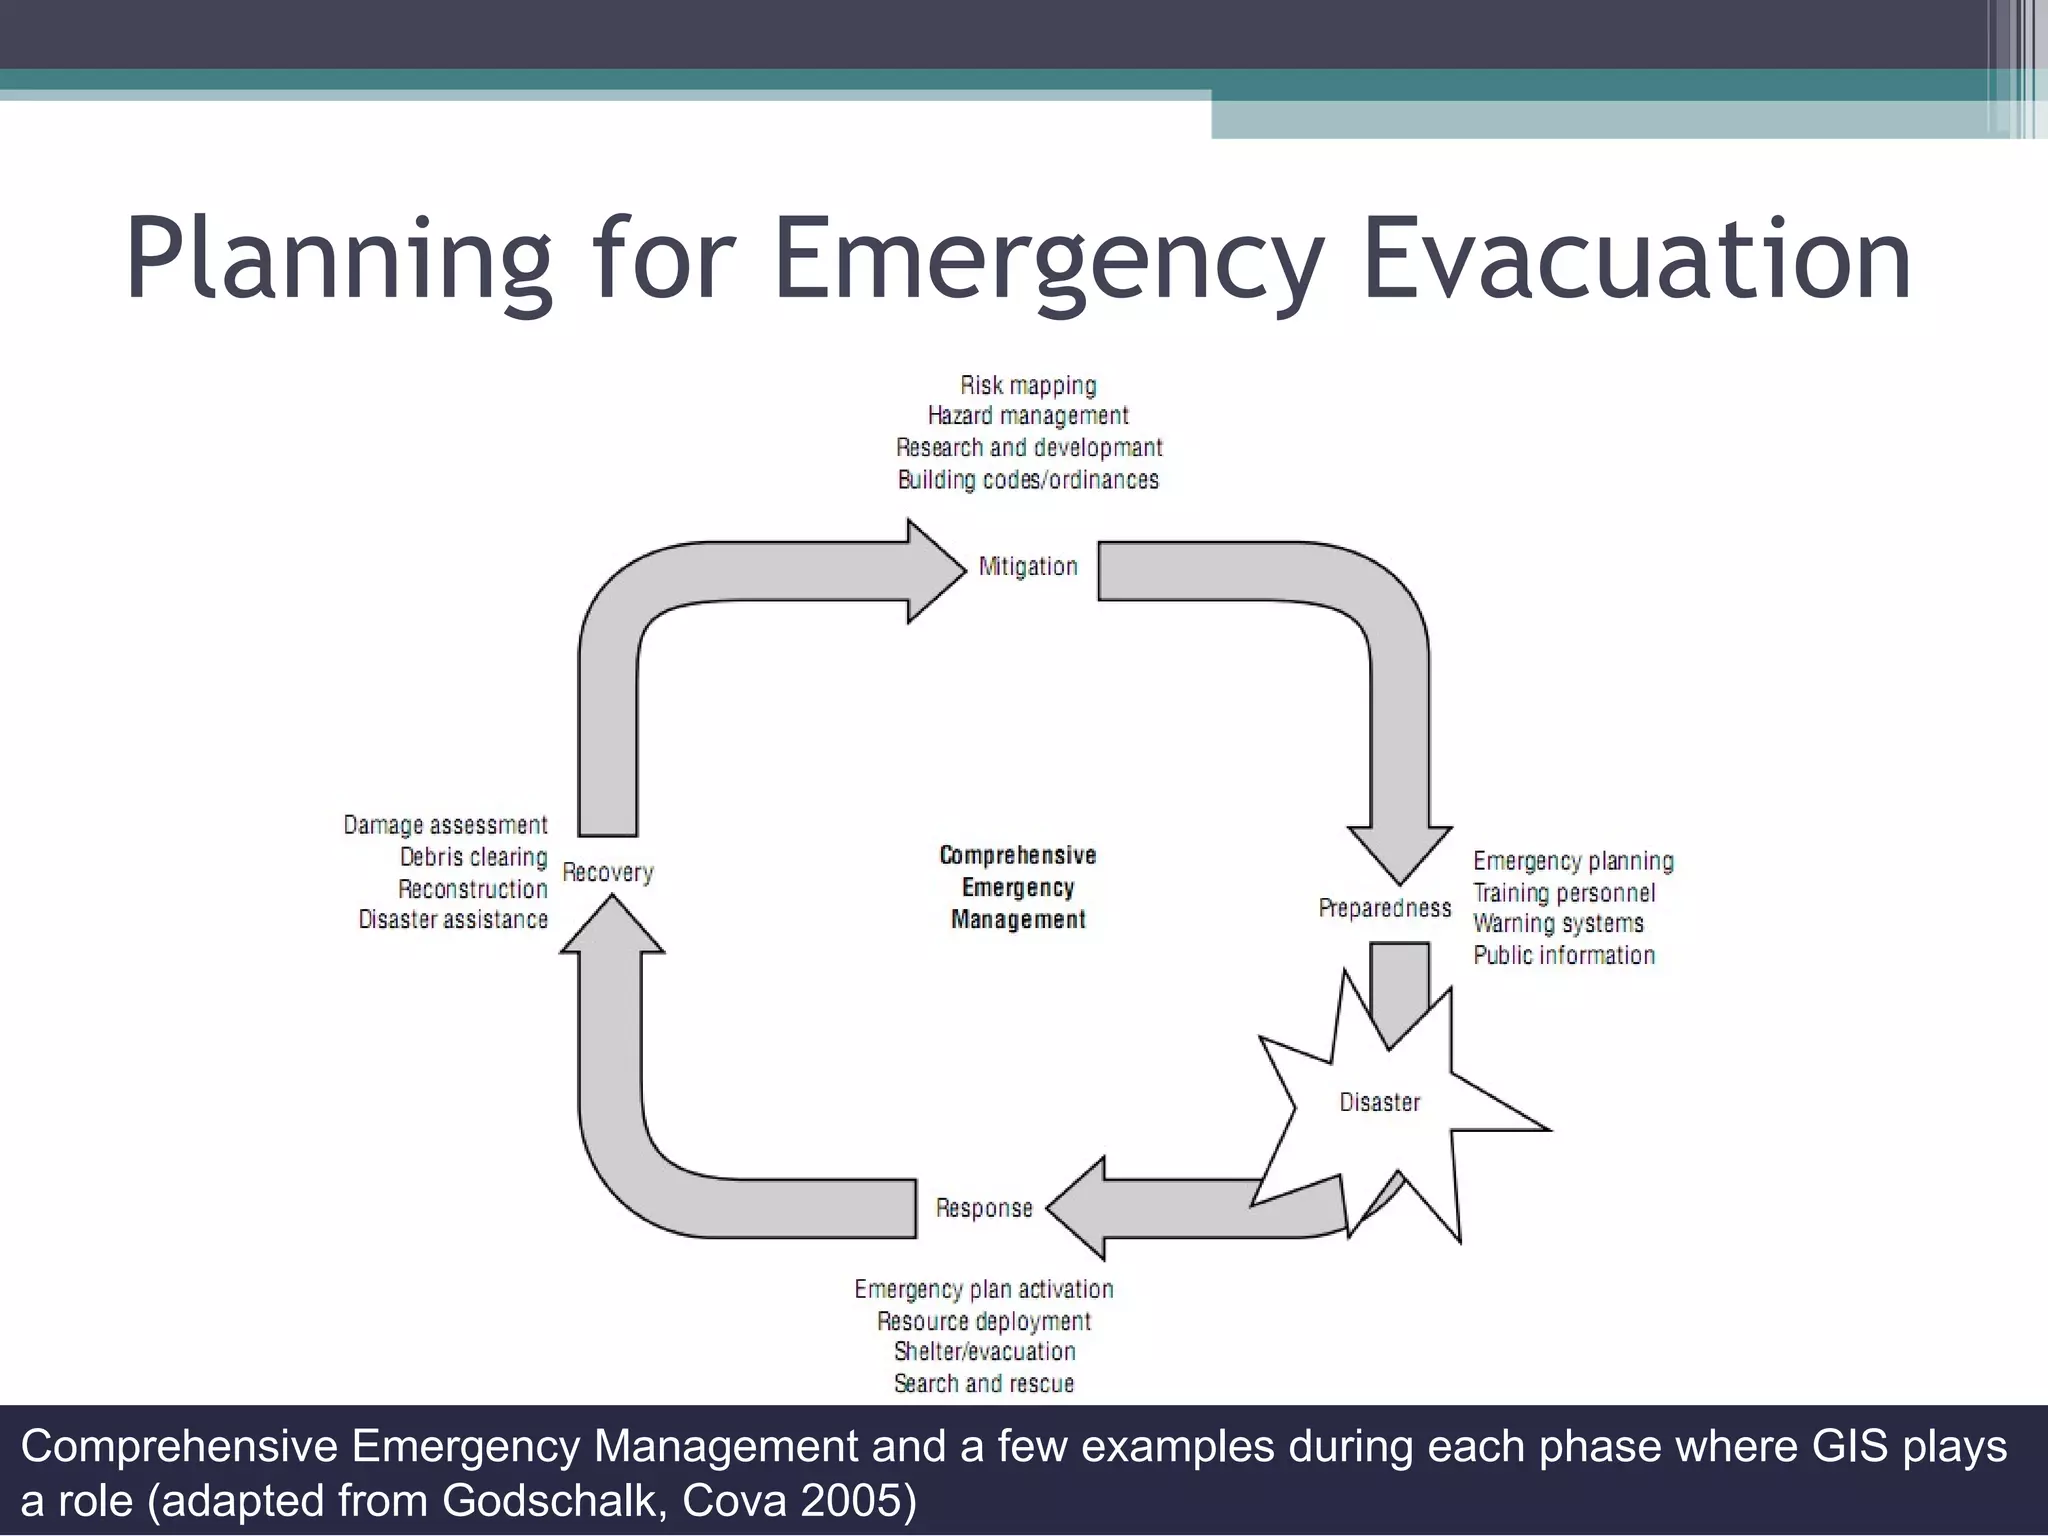
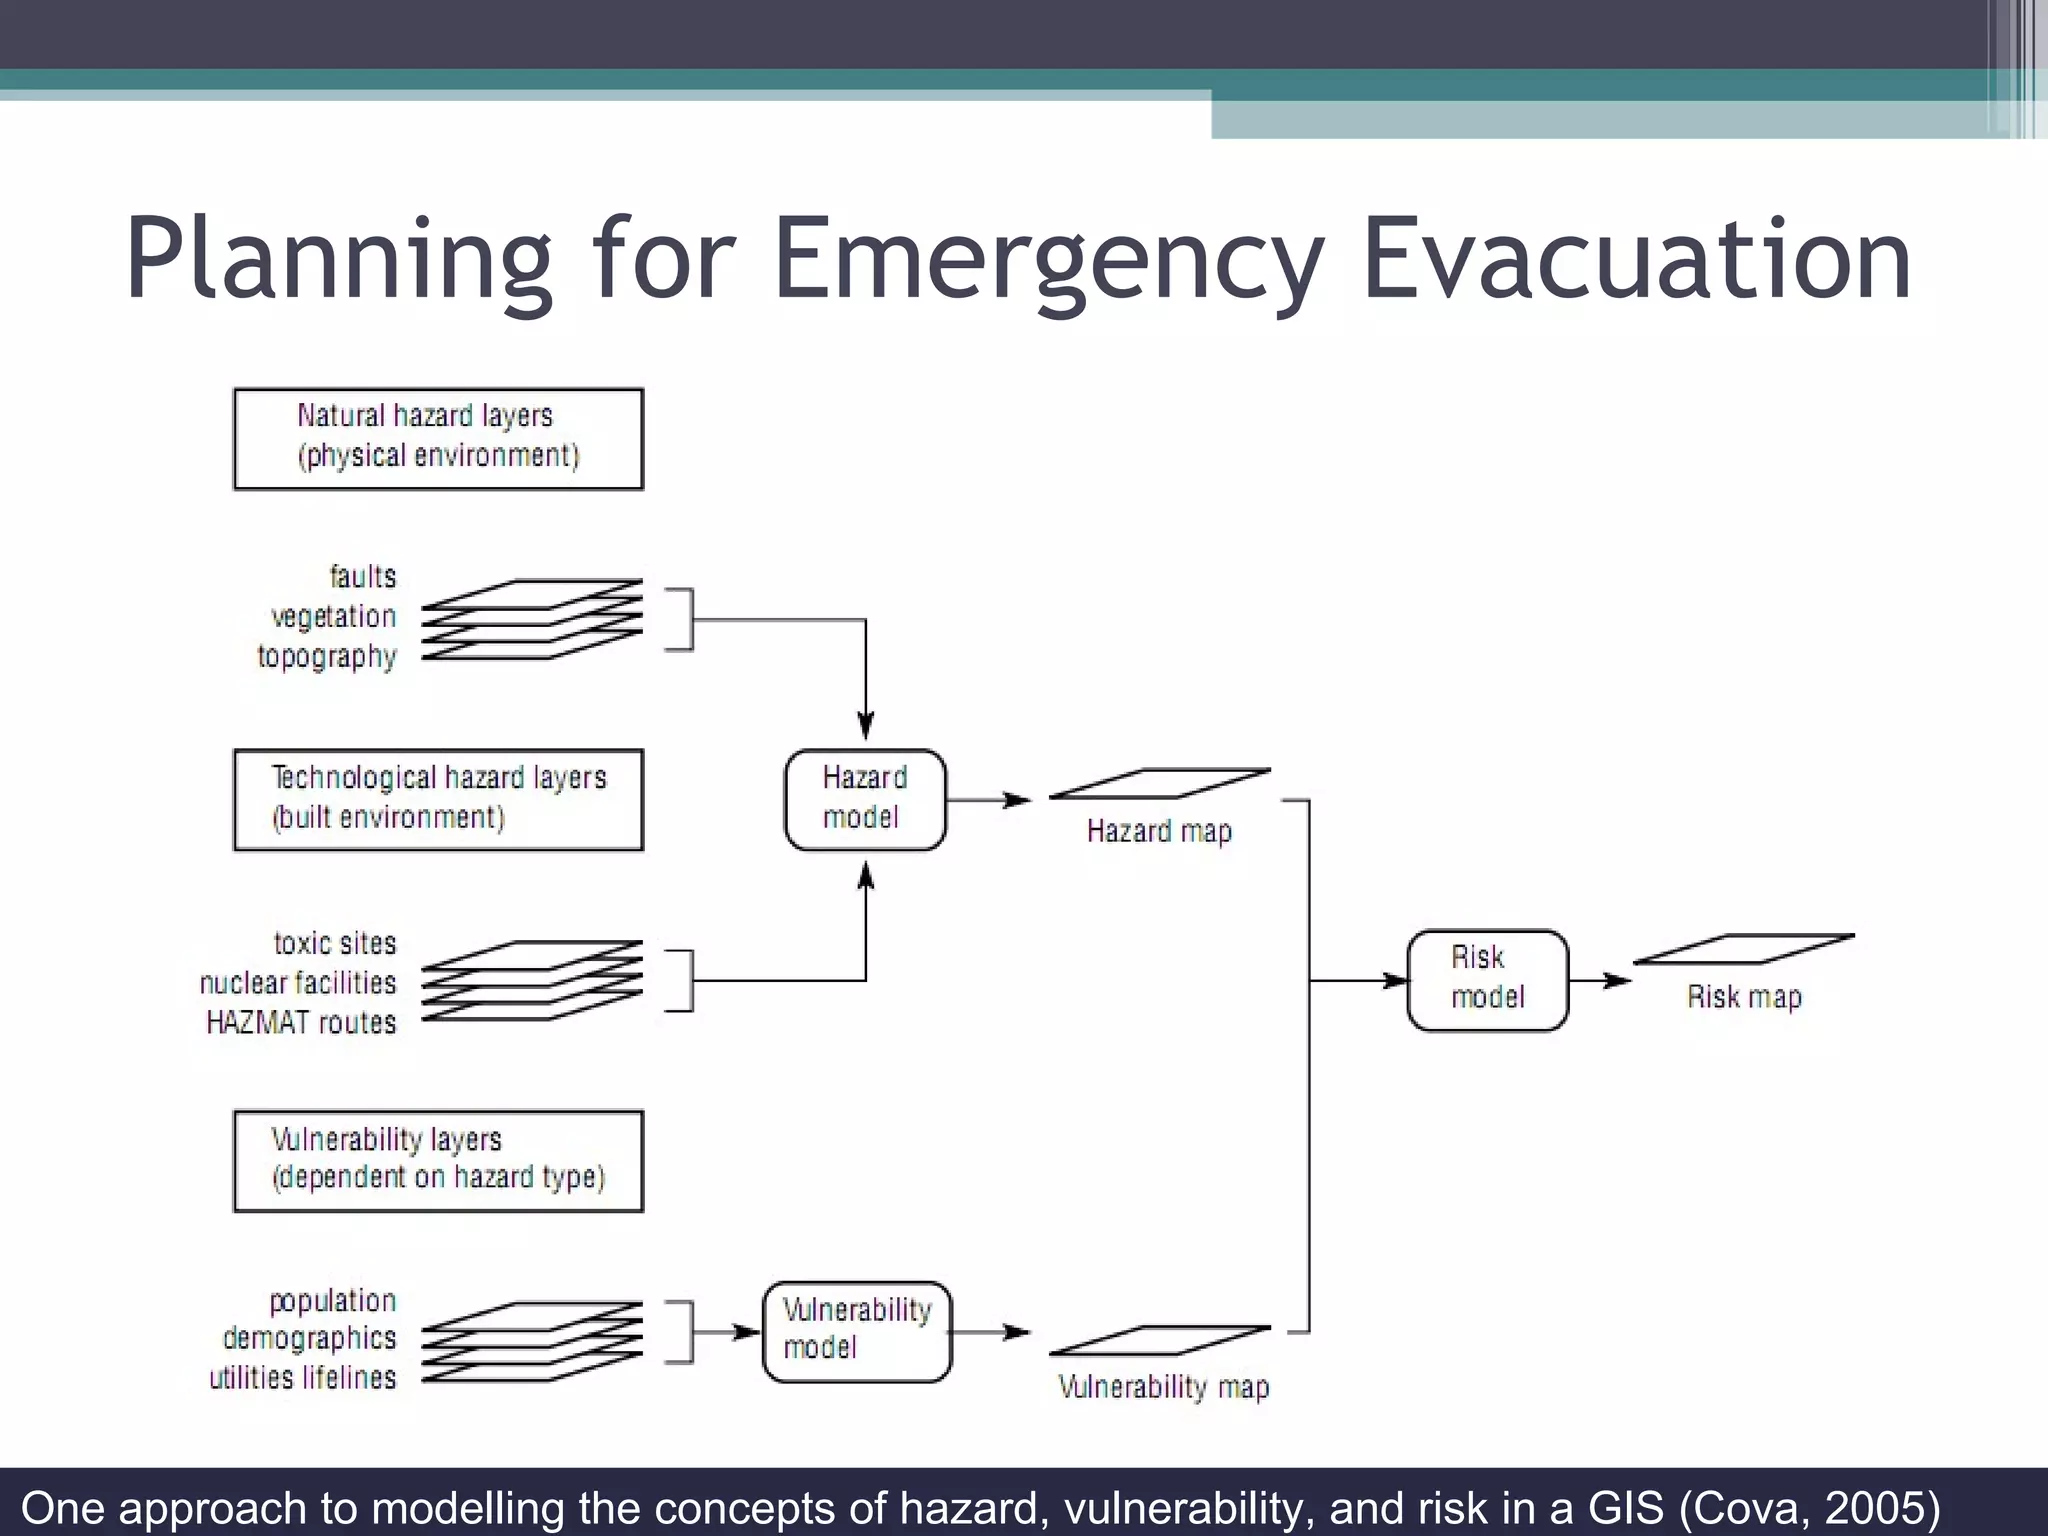
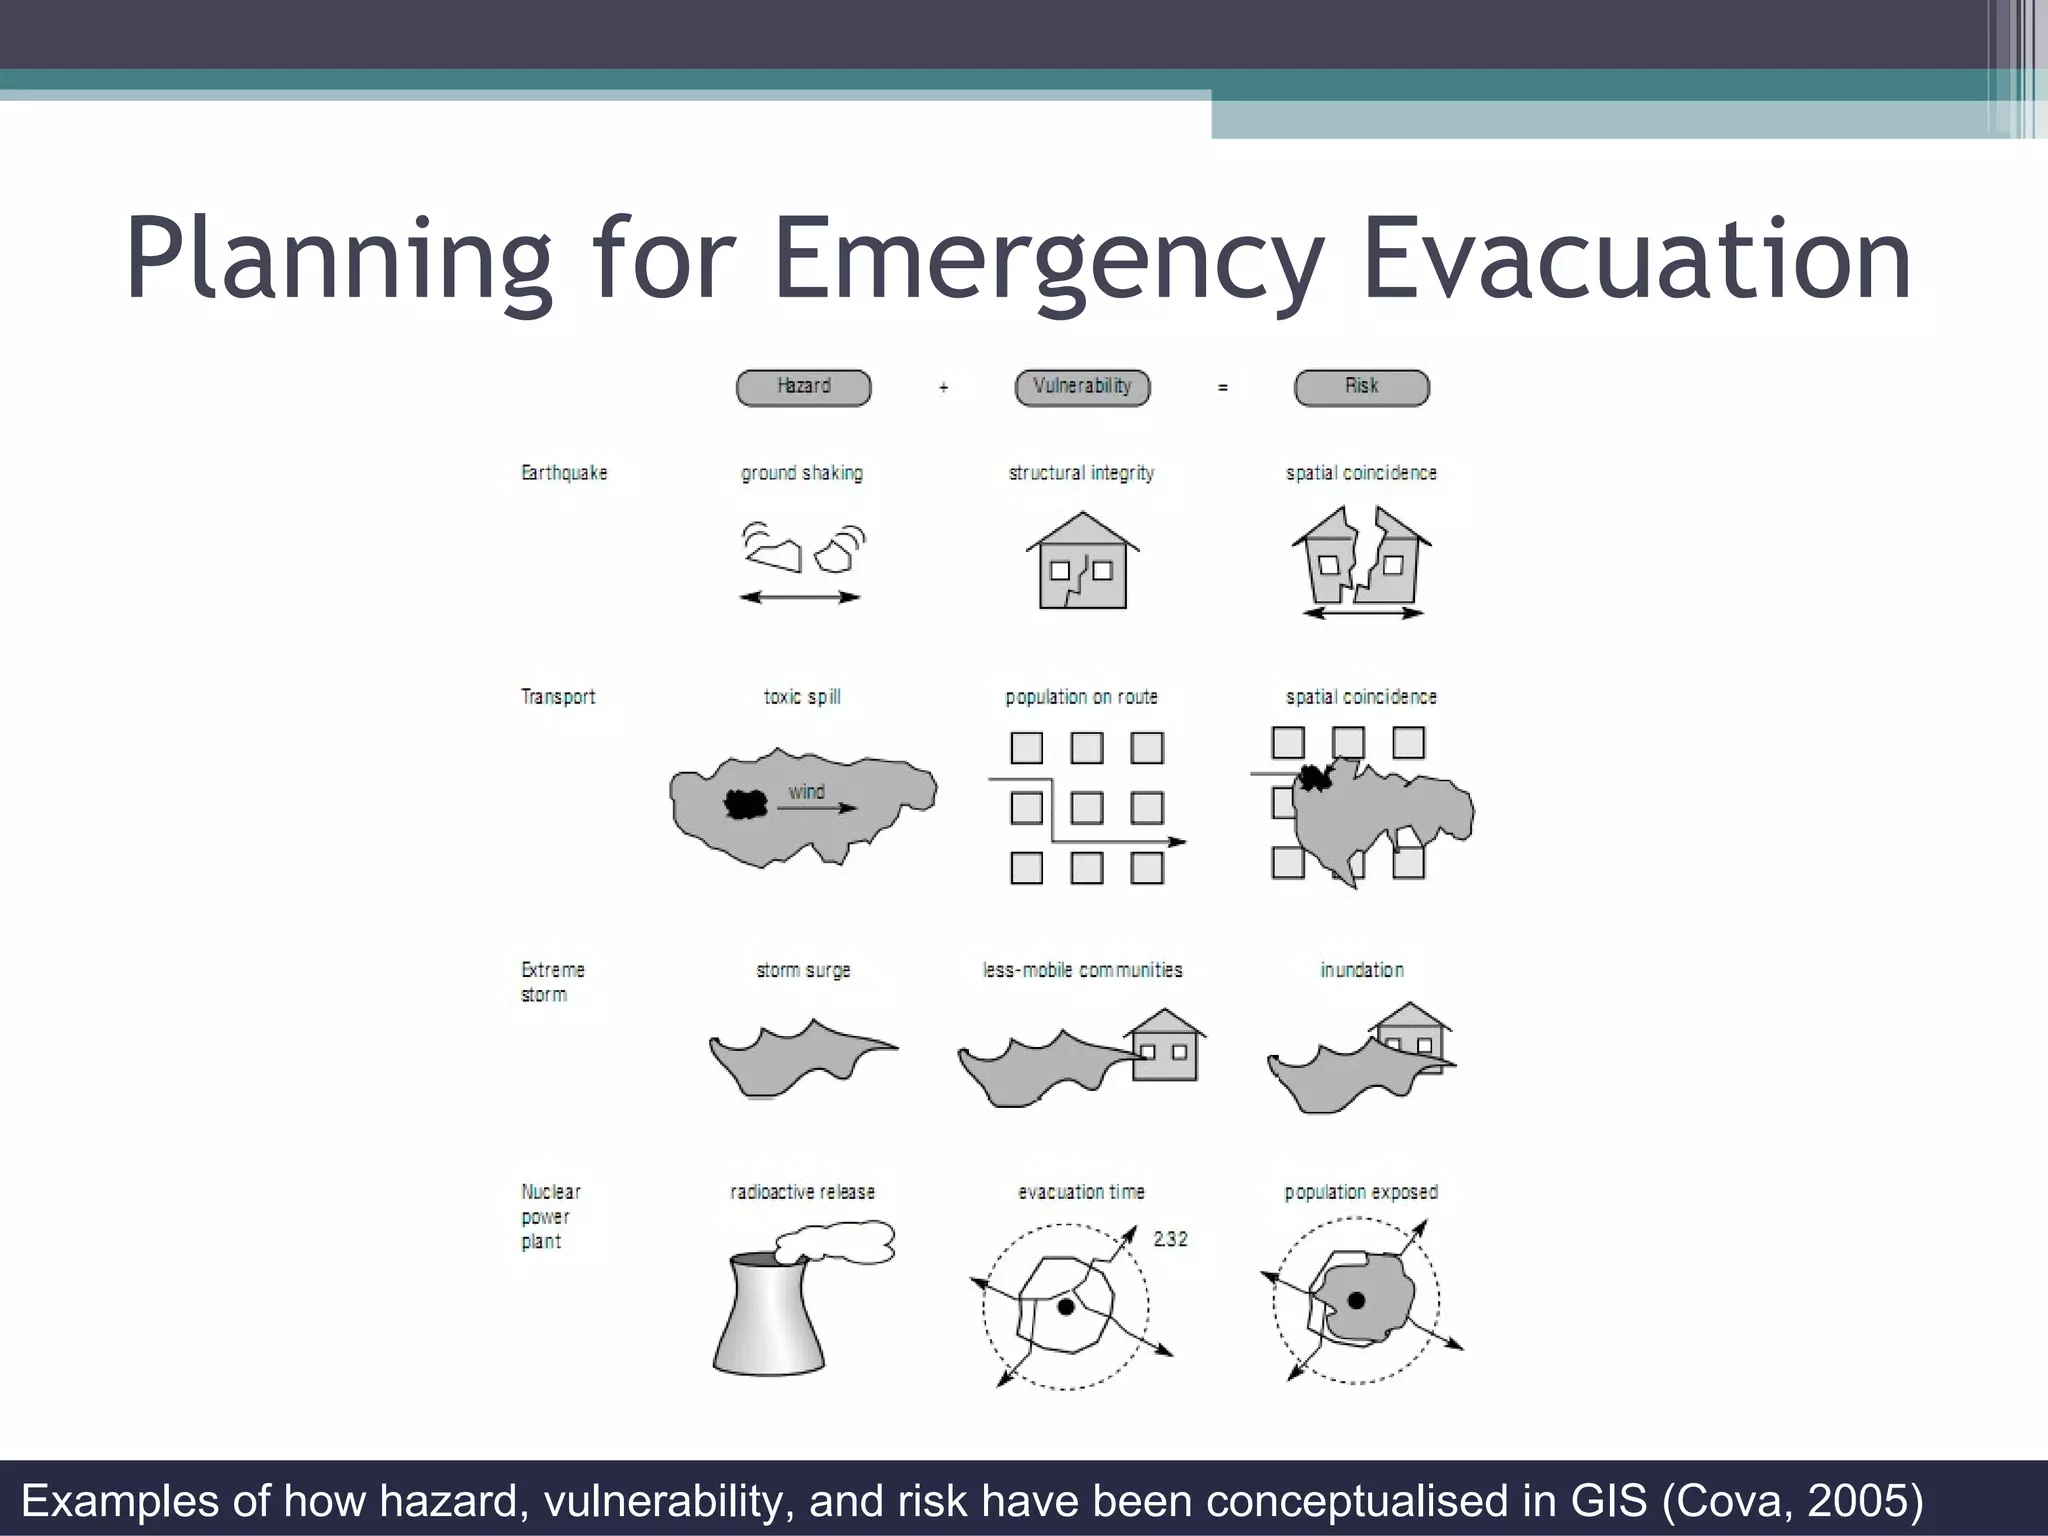
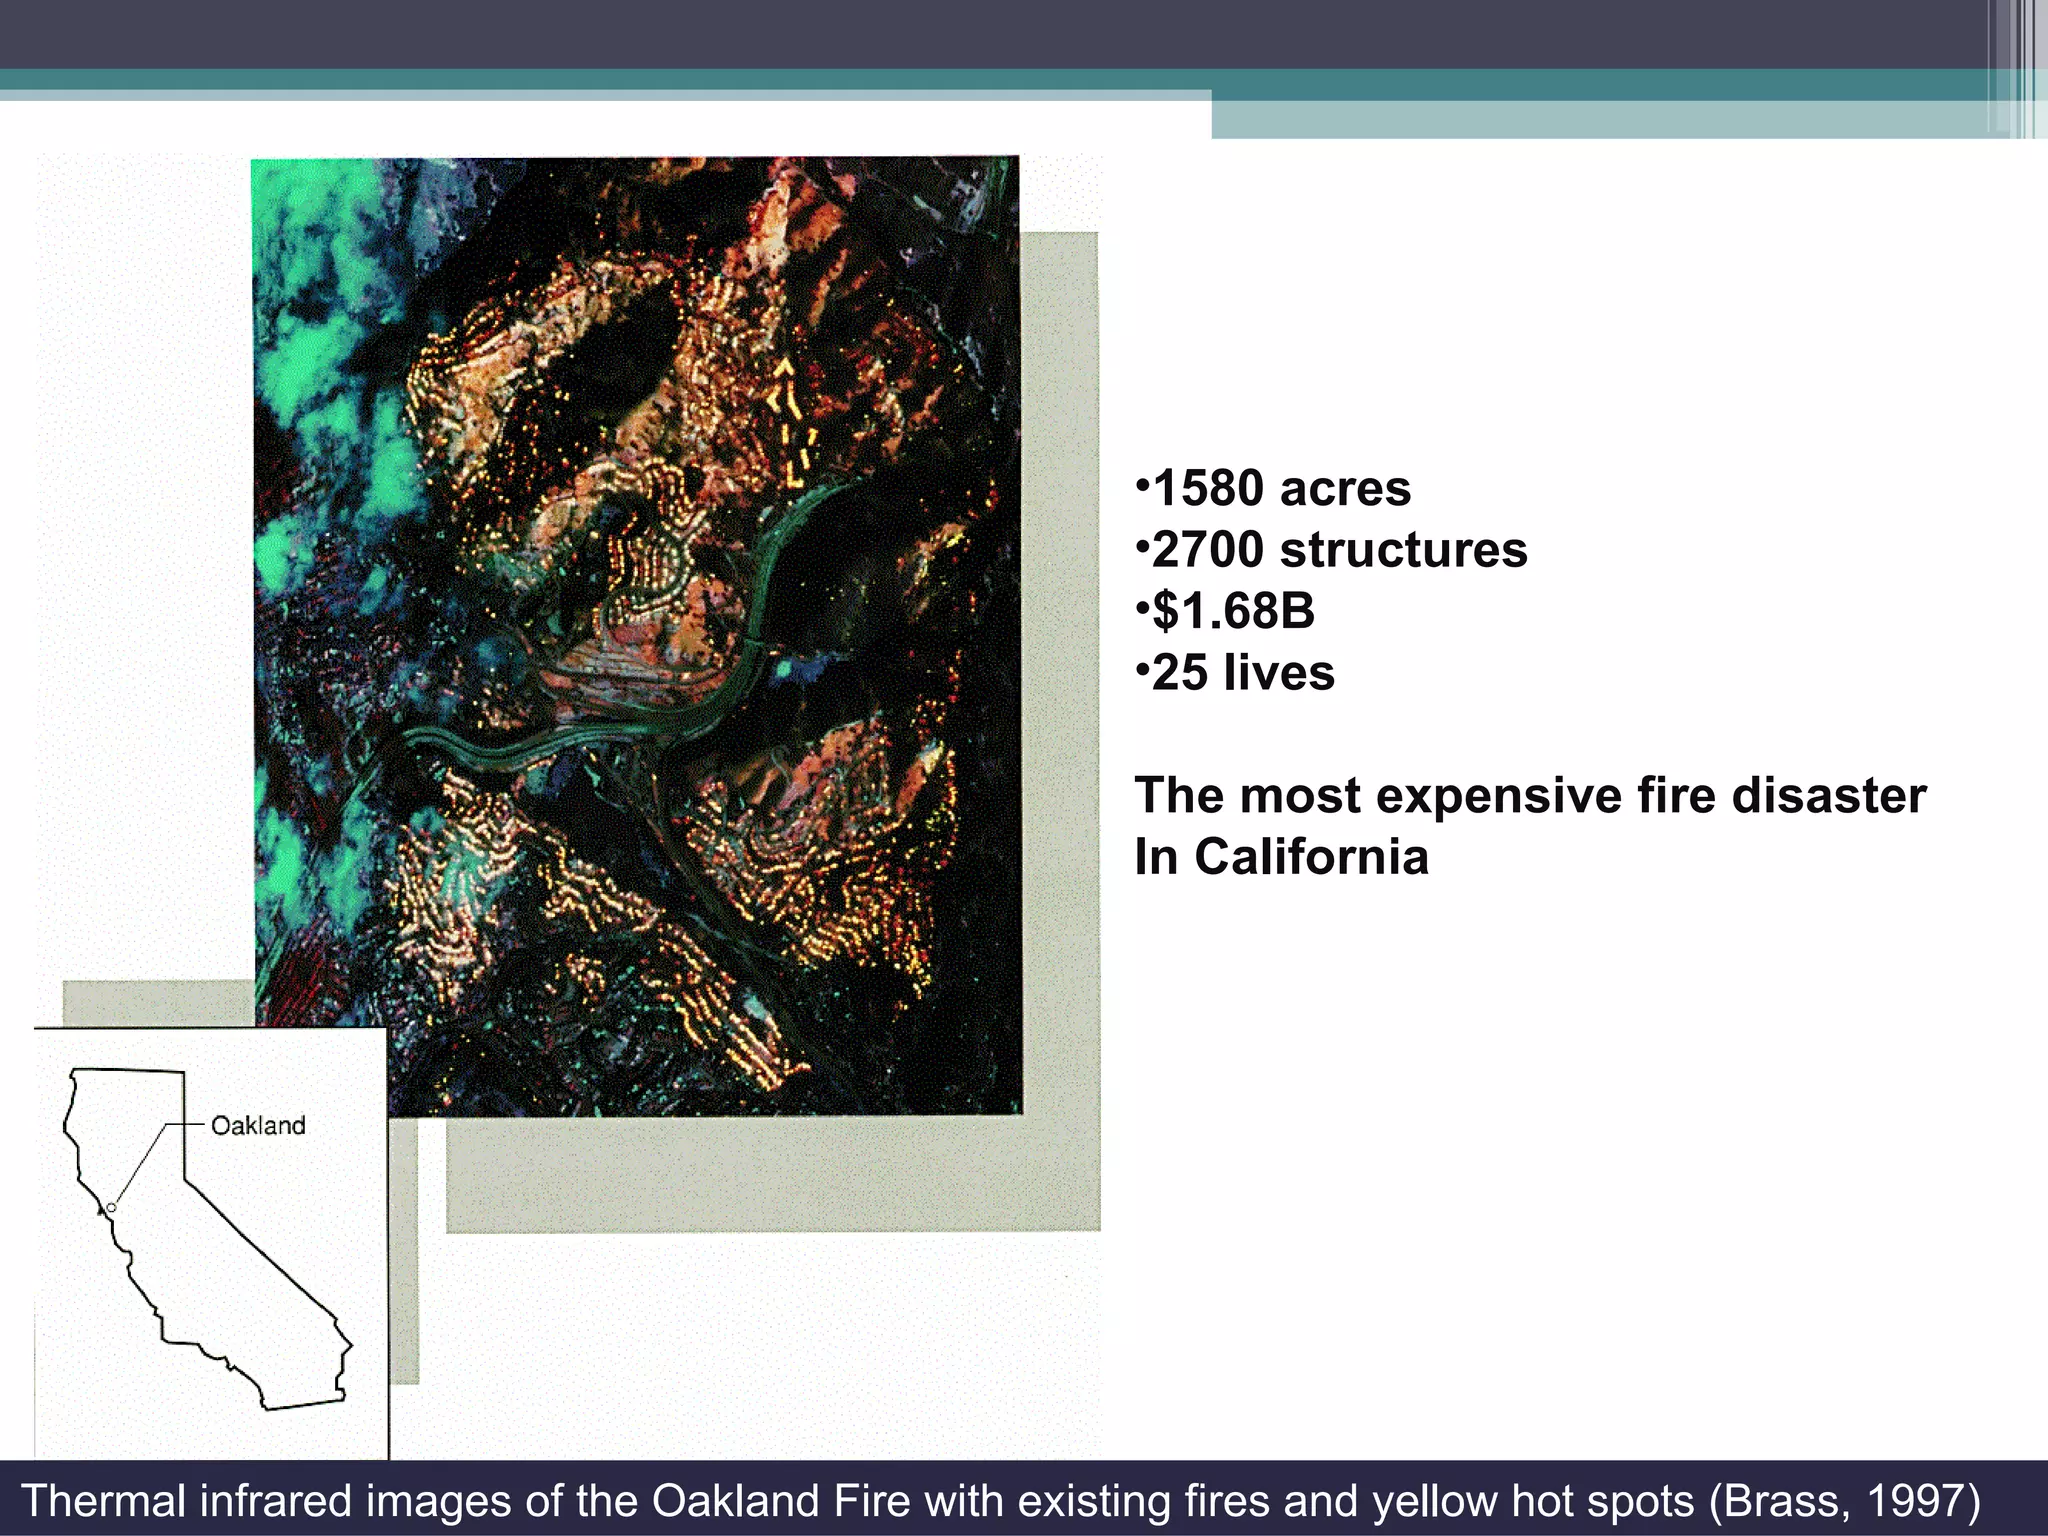
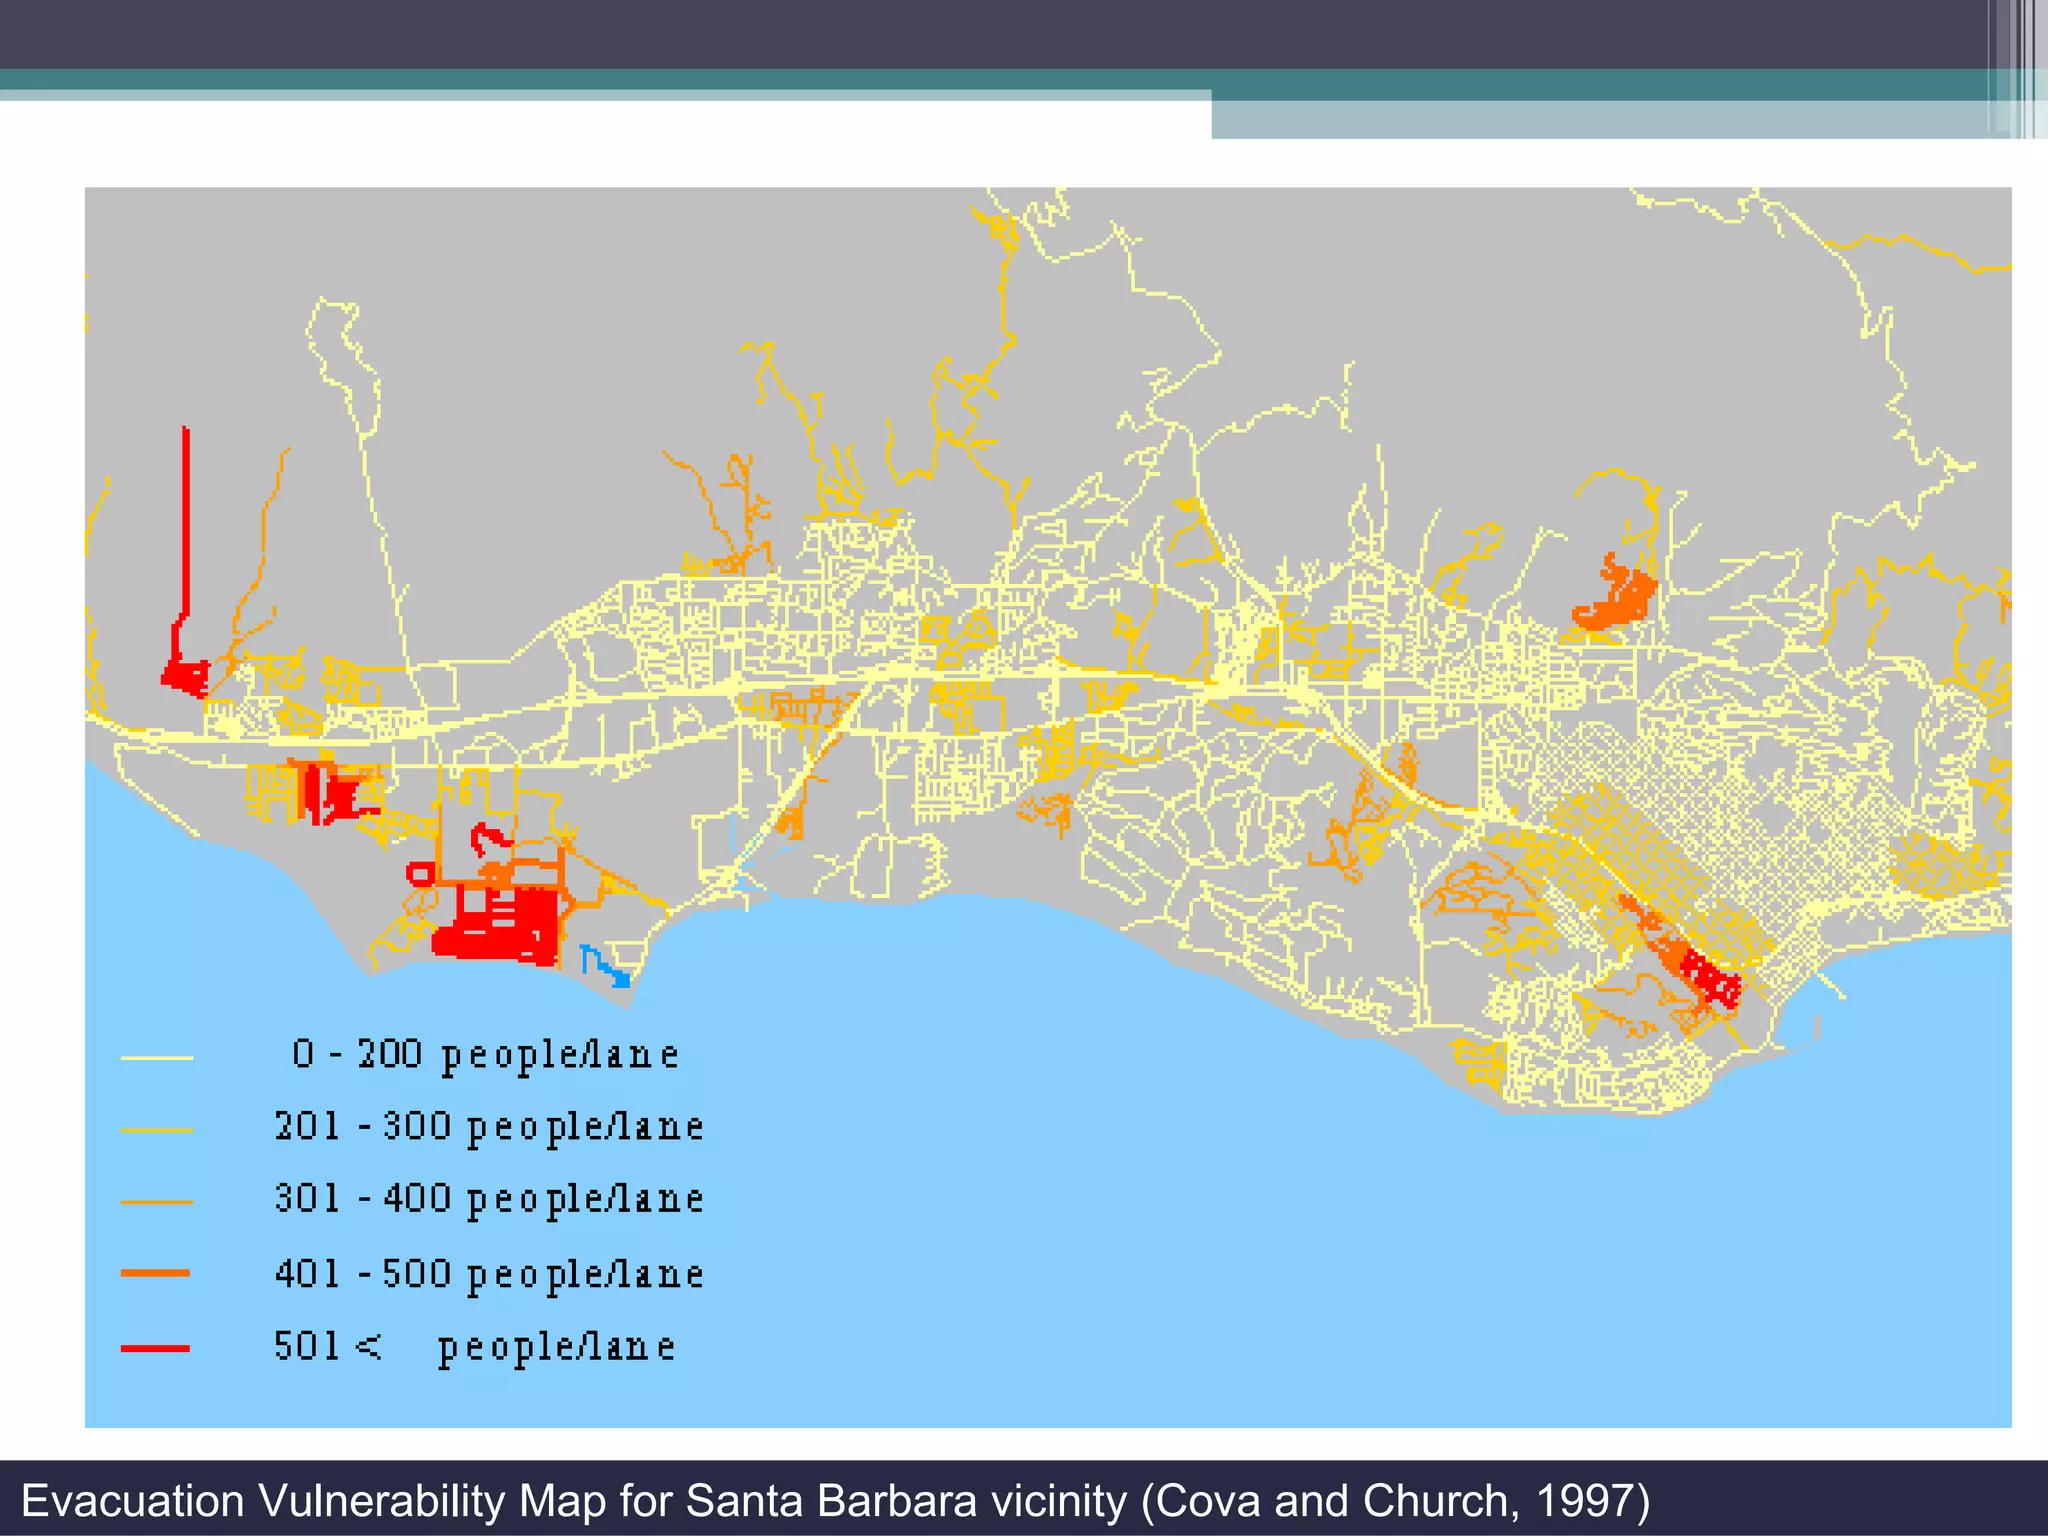


1. The document discusses how GIS can be used for logistics and transportation planning, including for emergency evacuation modeling. It provides an example of a study by Tom Cova that used GIS to model evacuation vulnerability by analyzing street networks and population data. 2. Cova demonstrated that GIS is an effective planning tool for rating evacuation risk by providing a visual map of areas that may experience bottlenecks. His analysis showed that limited entrances to subdivisions from main roads can hinder evacuation. 3. While Cova's analysis focused on measurable data like population and street layout, it did not consider social factors important to evacuation planning like culture, language, and needs of vulnerable groups.