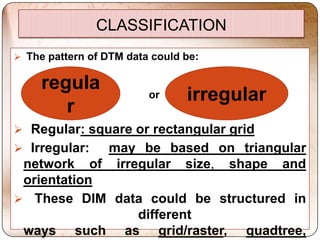
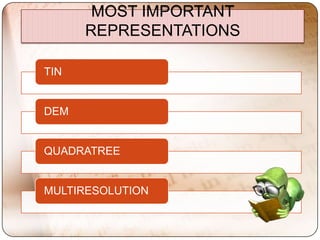
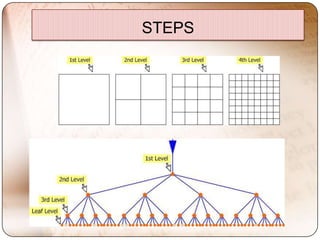
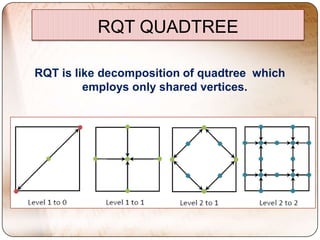
DIGITAL TERRAIN
                REPRESENTATIONS
GROUP MEMBERS
Agasha Ochneva, Biniyam
Tilahun
Gülendam Baysal, Roya
Olyazadeh
Muhammad Maimaiti, Shiuli
Pervin
David González Sánchez
Roberto Mediero Martí
GENEREAL EXPLANATION OF
      DIGITAL TERRAIN
     REPRESENTATIONS
  A digital terrain model is a topographic
model of the bare earth –terrain relief - that
can be manipulated by computer programs.
 The data files contain the spatial elevation
    data of the terrain in a digital format
DATA SOURCE:

 Ground survey,
 Digitizing contours,
 Digital Photogrammetry,
 Direct image grid DEM,
 LiDAR, RADAR, SONAR;
CLASSIFICATION
 The pattern of DTM data could be:


    regula
    regular                      irregular
                         or     irregular
       r
 Regular: square or rectangular grid
 Irregular: may be based on triangular
 network of irregular size, shape and
 orientation
 These DIM data could be structured in
                different
 ways such as grid/raster, quadtree,
MOST IMPORTANT
      REPRESENTATIONS

TIN


DEM


QUADRATREE


MULTIRESOLUTION
Grid DEM
                 Main description
 DEM: A digital representation of a topographic surface
 They are based on the values of the elevation at the
  sampling points- one height per pixel (grid cell)
 The grid representation is the consequence of
  sampling elevation values in regular intervals of
  latitude and longitude.
Grid DEM
               Main description
 The result is a matrix whose indices are the
  coordinates and values are the elevation value at
  each point (raster representation)
 From this sample representation it is possible to
  get a representation of the relief
Grid DEM
             Main description

     The steps to build a grid DEM are:

Obtaining the data: Sampling elevation
 values in a regular grid pattern; process and
 filtered of the acquired data
Model building: Data structures building and
 storage
Optimization and visualization of the model
SAMPLES
SAMPLES
ADVANTAGES of GRID

 Regular sample pattern --> Simple data
  storage structures and algorithm
 Multisource possibility --> Compatible with
  many sources, even satellite, and easy to
  combine with imagery
 Allow a high resolution visualization with a
  relatively simple process
 It is easy to use to generate other
  models, and to deduce from other models
DISADVANTAGES of GRID

 Regular sample pattern --> Possibility of
  oversampling or
  undersampling and redundant data points.
  Uniform pixel size. Large amount of storage
  memory for large resolutions
 Multisource possibility --> Large mathematical
  process to combine them, heavy computation
  processes
 For very high resolutions, a too large collection of
  points to
  render in a short time
 Transformation into/from other models involves a
  heavy computational mathematic process
TIN

Vector based model
Made up of Irreguarly distributed points
 and lines with three dimenion
Vertices are connected with the edges to
 form a network of triangles
TIN (TRIANGULAR IRREGULAR
                 NETWORK)
   Different methods of Interpolation of TIN:
 Delaunay triangulation
 Distance ordering

           ArcGIS use Delaunay triangulation
           The edge of the TINs forms
            continuous        non    overlapping
            triangular facets


Nodes and edge   Nodes, edge and facet of TIN
TIN (TRIANGULAR IRREGULAR
                 NETWORK)
             Delaunay triangulation
 Delaunay triangulation is a proximal method that
satisfies the requirement that a circle drawn through
 the three nodes of a triangle will contain no other
                        node
TIN (TRIANGULAR IRREGULAR
                NETWORK)
              Distance ordering


compute the distance between all pairs
 of points
sort from lowest to highest
connect     the    closest     pair   of
 points until it covers all the points to
 form triangulation
this tends to produce many skinny
 triangles instead of the preferred "fat"
 triangles.
TIN (TRIANGULAR IRREGULAR
                NETWORK)
               Data Structure:
 TIN applied for both regularly and irregularly located
  data
 A regular grid network can be formed by interpolation
  from a triangular network
 Delaunay triangulation use static data structure
 The input feature used to form the dem remains in
  same position
TIN (TRIANGULAR IRREGULAR
                  NETWORK)
                 Data Structure:
           It is possible to create a TIN surface from features,
              such as points, line, and polygons that contain
                           elevation information


Acceptable data size:
10 to 15 million nodes represents the largest size for Win32. The
recommended size is to bound at a few million for the sake of
usability and performance.
ADVANTAGES of TIN:

 The position of input feature remain
  unchanged
 Fewer points needed for the same accuracy
 Less dik space is needed
 TIN preserves all the precision of input data
 Preisely located feature on a surface
 resolution adapts to terrain
 Typically used for high precision modeling of
  smaller areas
DISADVANTAGES of TIN:

 Usually TIN expects units to be in feet or
  meters, not decimal degrees
 Delaunay Triangulation is not valid when
  triangulation constructed using angular
  coordinate from the geographic coordinate
  system.
 More expensive to build and process
 less widely available than the raster surface
  model
 TIN is seems to be less efficient than processing
  raster data.
MULTI-RESOLUTION
 It provides an abstraction for representing, manipulating, and
  visualizing large volumes of spatial data at multiple levels of
  detail and accuracy (LOD).
 vertex removal, edge collapse, and triangle collapse.
 It  shows        topographic features: peak, pit, ridge
  channel, pass, valley, concave or convex area.


                                                   MULTI-RESOLUTION
ALGORITHMS
They have been improved and by using least square
   adjustment they can add or remove details by
                changing resolution.
ALGORITHMS

 B-Spline algorithm
 Multi-TIN
 Regular Triangle Mesh
 Simplification
ADVANTAGES                    DISADVANTAGES
- Easy analysis of               - This method is so
 topographic parameters at         complicated and using
 different resolutions.            different algorithms in
                                   different level and
- This model can be used for       sometimes least square
 huge data with level of           adjustment for unique
 detail (LOD) in online form.      answer
                                 - There is no technique for
- It may remove noise and          simplification and multi-
 errors in the input data and      resolution modeling of
                                   tetrahedral meshes.
- Maintainance of the
 topology of the isolines of
 the TIN at full resolution at   - Irregularities caused by
 differents LODs.                  real small scale landforms
                                   in the landscape.
USAGE AND APPLICATION


      Multi-Resolution method can be fundamental for applications
involving geometric navigation and computations on the mesh.
      For example: contour line extraction, drainage network
computation, path planning, etc.
SAMPLES
QUADTREE

 Quadtree is a grid-based
 structure and has variable
 resolution.

 A quadtree have tree data
 structure in which each
 internal node has
 exactly four children.
STEPS
TYPES

 The restricted quadtree for regularly-
 sampled surface data

 PMR quadtree for irregularly-sampled data.
RQT QUADTREE

RQT is like decomposition of quadtree which
         employs only shared vertices.
PMR QUADTREE

Uses probabilistic splitting rule
SAMPLES
ADVANTAGES of QUADTREE
 Need less storage space


 Compact representation of the terrain


 Fast LOD triangulation and rendering, and are
 easier to implement as well.
DISADVANTAGES of QUADTREE

 Not very efficient structure to represent grid
  DTM data, continuous surface, and
  unclassified imagery data.
 Difficult to modify any changes to the pattern
  of the data, requires recalculation of the
  quadtree.
SAMPLES
FINAL COMPARISON

                      DEM   TIN   MR    QT
Regular Sample
Pattern                √    √ X   √ X   √ X

Data Storage           X     √    √      √
Multisource
Possibility            √     √    √      √

Visualisation          √     √    √      √

Conversion             √     √    √      X
Speed of
Performance            X     √    √      √
Level of Details
(LOD)                  X     √    √      √
RESOURSES:
Book and Research Paper Resources
   Emanuele Danovaro, Leila De Floriani, Enrico Puppo1, and Hanan Samet, Out-of-core Multi-resolution
    Terrain Modeling, Department of Computer and Information Science University of Genoa - Via
    Dodecaneso, 35, 16146 Genoa, Italy
   Zhi Wanga, Qingquan Lia, Besheng Yanga, Multi Resolution Representation of Digital Terrain Models
    with topographical features presentation, State Key Laboratory for Information Engineering in
    Surveying, Mapping and Remote Sensing, Wuhan University,
   Emanuele Danovaro, Leila De Floriani, Paola Magillo, Mohammed Mostefa Memoudi,Enrico
    Puppo, MorphologyDriven Simplification and Multiresolution Modeling of Terrains, Dipartimento di
    Informatica e Scienze dell’Informazione Universit `a di Genva
   Jan Rasmus SULEBAK and Øyvind HJELLE,2003, Multiresolution Spline Models and Their
    Applications in Geomorphology, SINTEF Applied Mathematics, P.O. Box 124, Blindern, N-0314
    Oslo, Norway
   HÉLIO PEDRINI, 2001, Multi-Resolution Terrain Modeling based on Triangulated Irregular
    Networks, Revista Brasileira de Geociências 31(2):117-122, 2001
   Leila De Floriani , Paola Magillo, Regular and Irregular MultiResolution Terrain Models: a Comparison
    Dept. of Computer Science University of Genova
Web Resources
  http://www.etsimo.uniovi.es                         http://www.etsimo.uniovi.es
  http://www.gtbi.net                                            http://en.wikipedia.org
  http://www.technion.ac.il                           http://www.wiley.com
  http://eprints.utm.my                               http://www.earsel.org
Obrigado por sua atenção!


Gracias por su atención!


                           Thank you for your attention!


                             Þakka þér fyrir athygli þína!

                     Gràcies per la seva atenció!

Digital terrain representations(last)

  • 1.
    DIGITAL TERRAIN REPRESENTATIONS GROUP MEMBERS Agasha Ochneva, Biniyam Tilahun Gülendam Baysal, Roya Olyazadeh Muhammad Maimaiti, Shiuli Pervin David González Sánchez Roberto Mediero Martí
  • 2.
    GENEREAL EXPLANATION OF DIGITAL TERRAIN REPRESENTATIONS A digital terrain model is a topographic model of the bare earth –terrain relief - that can be manipulated by computer programs. The data files contain the spatial elevation data of the terrain in a digital format
  • 3.
    DATA SOURCE:  Groundsurvey,  Digitizing contours,  Digital Photogrammetry,  Direct image grid DEM,  LiDAR, RADAR, SONAR;
  • 4.
    CLASSIFICATION  The patternof DTM data could be: regula regular irregular or irregular r  Regular: square or rectangular grid  Irregular: may be based on triangular network of irregular size, shape and orientation  These DIM data could be structured in different ways such as grid/raster, quadtree,
  • 5.
    MOST IMPORTANT REPRESENTATIONS TIN DEM QUADRATREE MULTIRESOLUTION
  • 6.
    Grid DEM Main description  DEM: A digital representation of a topographic surface  They are based on the values of the elevation at the sampling points- one height per pixel (grid cell)  The grid representation is the consequence of sampling elevation values in regular intervals of latitude and longitude.
  • 7.
    Grid DEM Main description  The result is a matrix whose indices are the coordinates and values are the elevation value at each point (raster representation)  From this sample representation it is possible to get a representation of the relief
  • 8.
    Grid DEM Main description The steps to build a grid DEM are: Obtaining the data: Sampling elevation values in a regular grid pattern; process and filtered of the acquired data Model building: Data structures building and storage Optimization and visualization of the model
  • 9.
  • 10.
  • 11.
    ADVANTAGES of GRID Regular sample pattern --> Simple data storage structures and algorithm  Multisource possibility --> Compatible with many sources, even satellite, and easy to combine with imagery  Allow a high resolution visualization with a relatively simple process  It is easy to use to generate other models, and to deduce from other models
  • 12.
    DISADVANTAGES of GRID Regular sample pattern --> Possibility of oversampling or undersampling and redundant data points. Uniform pixel size. Large amount of storage memory for large resolutions  Multisource possibility --> Large mathematical process to combine them, heavy computation processes  For very high resolutions, a too large collection of points to render in a short time  Transformation into/from other models involves a heavy computational mathematic process
  • 13.
    TIN Vector based model Madeup of Irreguarly distributed points and lines with three dimenion Vertices are connected with the edges to form a network of triangles
  • 14.
    TIN (TRIANGULAR IRREGULAR NETWORK) Different methods of Interpolation of TIN:  Delaunay triangulation  Distance ordering  ArcGIS use Delaunay triangulation  The edge of the TINs forms continuous non overlapping triangular facets Nodes and edge Nodes, edge and facet of TIN
  • 15.
    TIN (TRIANGULAR IRREGULAR NETWORK) Delaunay triangulation Delaunay triangulation is a proximal method that satisfies the requirement that a circle drawn through the three nodes of a triangle will contain no other node
  • 16.
    TIN (TRIANGULAR IRREGULAR NETWORK) Distance ordering compute the distance between all pairs of points sort from lowest to highest connect the closest pair of points until it covers all the points to form triangulation this tends to produce many skinny triangles instead of the preferred "fat" triangles.
  • 17.
    TIN (TRIANGULAR IRREGULAR NETWORK) Data Structure:  TIN applied for both regularly and irregularly located data  A regular grid network can be formed by interpolation from a triangular network  Delaunay triangulation use static data structure  The input feature used to form the dem remains in same position
  • 18.
    TIN (TRIANGULAR IRREGULAR NETWORK) Data Structure: It is possible to create a TIN surface from features, such as points, line, and polygons that contain elevation information Acceptable data size: 10 to 15 million nodes represents the largest size for Win32. The recommended size is to bound at a few million for the sake of usability and performance.
  • 19.
    ADVANTAGES of TIN: The position of input feature remain unchanged  Fewer points needed for the same accuracy  Less dik space is needed  TIN preserves all the precision of input data  Preisely located feature on a surface  resolution adapts to terrain  Typically used for high precision modeling of smaller areas
  • 20.
    DISADVANTAGES of TIN: Usually TIN expects units to be in feet or meters, not decimal degrees  Delaunay Triangulation is not valid when triangulation constructed using angular coordinate from the geographic coordinate system.  More expensive to build and process  less widely available than the raster surface model  TIN is seems to be less efficient than processing raster data.
  • 21.
    MULTI-RESOLUTION  It providesan abstraction for representing, manipulating, and visualizing large volumes of spatial data at multiple levels of detail and accuracy (LOD).  vertex removal, edge collapse, and triangle collapse.  It shows topographic features: peak, pit, ridge channel, pass, valley, concave or convex area. MULTI-RESOLUTION
  • 22.
    ALGORITHMS They have beenimproved and by using least square adjustment they can add or remove details by changing resolution.
  • 23.
    ALGORITHMS  B-Spline algorithm Multi-TIN  Regular Triangle Mesh  Simplification
  • 24.
    ADVANTAGES DISADVANTAGES - Easy analysis of - This method is so topographic parameters at complicated and using different resolutions. different algorithms in different level and - This model can be used for sometimes least square huge data with level of adjustment for unique detail (LOD) in online form. answer - There is no technique for - It may remove noise and simplification and multi- errors in the input data and resolution modeling of tetrahedral meshes. - Maintainance of the topology of the isolines of the TIN at full resolution at - Irregularities caused by differents LODs. real small scale landforms in the landscape.
  • 25.
    USAGE AND APPLICATION Multi-Resolution method can be fundamental for applications involving geometric navigation and computations on the mesh. For example: contour line extraction, drainage network computation, path planning, etc.
  • 26.
  • 27.
    QUADTREE  Quadtree isa grid-based structure and has variable resolution.  A quadtree have tree data structure in which each internal node has exactly four children.
  • 28.
  • 29.
    TYPES  The restrictedquadtree for regularly- sampled surface data  PMR quadtree for irregularly-sampled data.
  • 30.
    RQT QUADTREE RQT islike decomposition of quadtree which employs only shared vertices.
  • 31.
  • 32.
  • 33.
    ADVANTAGES of QUADTREE Need less storage space  Compact representation of the terrain  Fast LOD triangulation and rendering, and are easier to implement as well.
  • 34.
    DISADVANTAGES of QUADTREE Not very efficient structure to represent grid DTM data, continuous surface, and unclassified imagery data.  Difficult to modify any changes to the pattern of the data, requires recalculation of the quadtree.
  • 35.
  • 36.
    FINAL COMPARISON DEM TIN MR QT Regular Sample Pattern √ √ X √ X √ X Data Storage X √ √ √ Multisource Possibility √ √ √ √ Visualisation √ √ √ √ Conversion √ √ √ X Speed of Performance X √ √ √ Level of Details (LOD) X √ √ √
  • 37.
    RESOURSES: Book and ResearchPaper Resources  Emanuele Danovaro, Leila De Floriani, Enrico Puppo1, and Hanan Samet, Out-of-core Multi-resolution Terrain Modeling, Department of Computer and Information Science University of Genoa - Via Dodecaneso, 35, 16146 Genoa, Italy  Zhi Wanga, Qingquan Lia, Besheng Yanga, Multi Resolution Representation of Digital Terrain Models with topographical features presentation, State Key Laboratory for Information Engineering in Surveying, Mapping and Remote Sensing, Wuhan University,  Emanuele Danovaro, Leila De Floriani, Paola Magillo, Mohammed Mostefa Memoudi,Enrico Puppo, MorphologyDriven Simplification and Multiresolution Modeling of Terrains, Dipartimento di Informatica e Scienze dell’Informazione Universit `a di Genva  Jan Rasmus SULEBAK and Øyvind HJELLE,2003, Multiresolution Spline Models and Their Applications in Geomorphology, SINTEF Applied Mathematics, P.O. Box 124, Blindern, N-0314 Oslo, Norway  HÉLIO PEDRINI, 2001, Multi-Resolution Terrain Modeling based on Triangulated Irregular Networks, Revista Brasileira de Geociências 31(2):117-122, 2001  Leila De Floriani , Paola Magillo, Regular and Irregular MultiResolution Terrain Models: a Comparison Dept. of Computer Science University of Genova Web Resources http://www.etsimo.uniovi.es http://www.etsimo.uniovi.es http://www.gtbi.net http://en.wikipedia.org http://www.technion.ac.il http://www.wiley.com http://eprints.utm.my http://www.earsel.org
  • 38.
    Obrigado por suaatenção! Gracias por su atención! Thank you for your attention! Þakka þér fyrir athygli þína! Gràcies per la seva atenció!