Download to read offline

![International Journal of Technical Research and Applications e-ISSN: 2320-8163,
www.ijtra.com Volume 3, Issue 1 (Jan-Feb 2015), PP. 141-144
144 | P a g e
Fig.12. Variation of tip deflection at different load
Fig13. Variation of stresses at max. load with respect to span
IV. DISCUSSION AND CONCLUSION
Though the detailed results are presented in earlier, here an
attempt is made to compare the results obtained analytically,
by FEM and experimentation. For comparison of stresses
first principle stress is considered.
A. Variation of stress and deflection in cantilever
plate
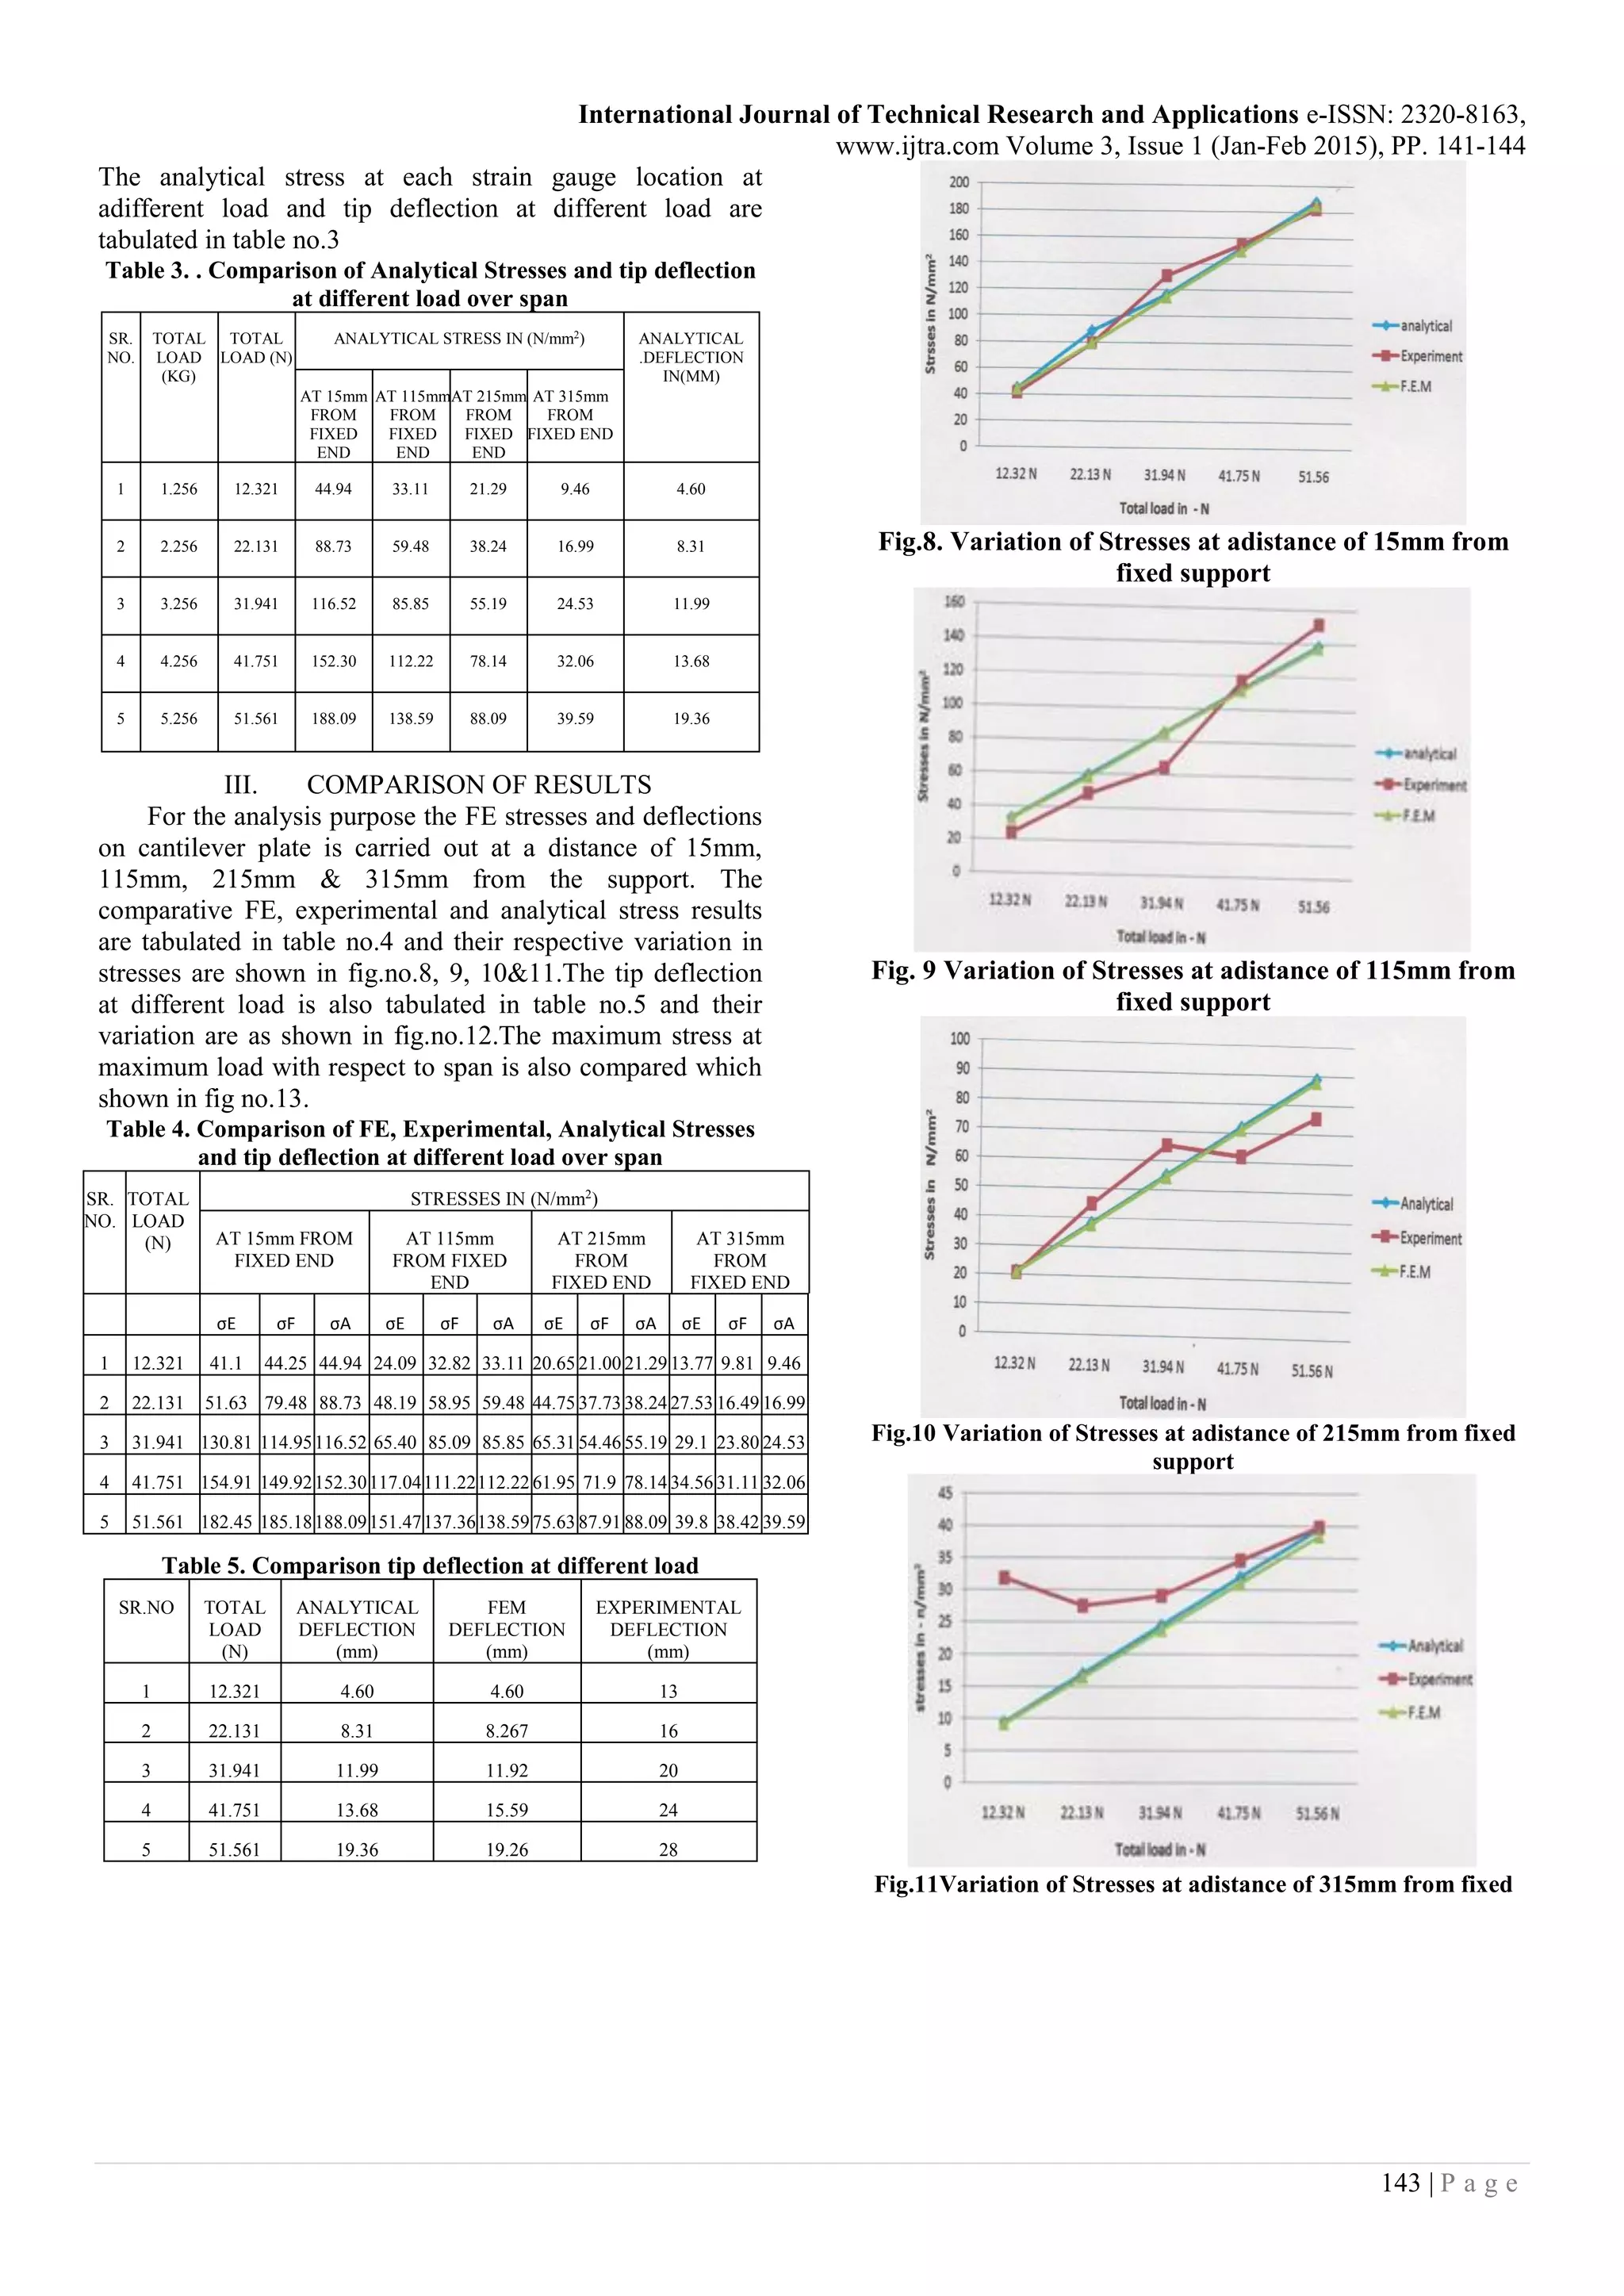
From the Fig. no 8, 9, 10&11 it is observed that FE
stresses and analytical stresses is closely matched but in
experimental the stress is slightly differ.
The strain gauges at a distance of 15mm and 115mm from
fixed support all three analysis are in good agreement with
each other, but at a distance of 215mm from fixed support
the experimental stress is closely matched at a lower load
and when the load increases, it quit differs.
At a distance of 315mm from fixed support the FE and
analytical stresses are closely matched, but in
experimentation at a lower load the experimental stress
highly differs than the analytical and FE stresses. When the
load are increasing, all these stresses are closer to each
other.
From fig no. 13 it is observed that, at a higher load the
nature of the graph of FE, analytical and experimental
stresses over a span obtained in the same nature as that of
stresses occurred in cantilever beam.
From fig. no.12 it is observed that at the end of the beam,
where the load is applied, the analytical and FEM deflection
are in good agreement but experimental deflection is quit
differ from the above two analysis because of due to inertia
and properties of material.
B. Overall conclusion
From this study it is conclude that in the analytical and
FEM analysis of a beam, observing stresses are nearer to
each other, but in experimental analysis as the load increases
the experimental stress is nearer to the FE and analytical
stresses and also follows the cantilever beam theory. In the
deflection concern, the analytical and FE deflection is in
good agreement but, the experimental deflection is quite
differs from above two analysis because due to inertia
effect, material properties and length of beam.
REFERENCES
[1] Gargi Majumdar., (2013) “Deflection and stress analysis of
cantilever beam and its validation using ANSYS”.
Intiernational Journal of Mechanicl engg. ISSN 2249-OO19,
Vol. 3. PP. 655 – 662.
[2] Bellagundu; (2002) “Finite element in engineering”, 3rd
Edition, Prentice Hall India.
[3] Khurmi, R. S.; Gupta, J. K.; (1999) “A textbook of Machine
Design” EPH Publication.
[4] Satphy S.M.;(2014)” A project of dynamic analysis of
cantilever beam & its experimental validation”,Dept.of
Mech. Engg.,National institute of Technology,Rourkela.
[5] A.Kursun, M.Tunay Certin; (2014) “Elastic Stress analysis
of composite cantilever beam loaded uniformly”,
Intenational Journal of Mechanical, Aerospace, Industrial
and Mechatronics Engineering. Vol;8, No:2.
[6] K.Vijaykumar ;(2014) “Tungsten Cantilever Beam using
Ansys, (Model Analysis)”, IJES,ISSN 2319-1813
Volume3,P.P .53-59
[7] Tarsicio Belendez; (2003) “Numerical and Experimental
Analysis of a Cantilever Beam; a Laboratory project to
Introduce Geometric Nonlinearity in Mechanics of
Material”, Int.J.Engg.Ed, vol.19,No.6,P.P 885-892.](https://image.slidesharecdn.com/0ttmrmywrdu13xntfbdq-signature-c6a80b553dece86f7153a1209428b50dc206f07ef14842097ac4ca4d54fa00d3-poli-151029083515-lva1-app6892/75/INVESTIGATION-OF-STRESSES-IN-CANTILEVER-BEAM-BY-FEM-AND-ITS-EXPERIMENTAL-VERIFICATION-4-2048.jpg)
This study investigates the stresses in a cantilever beam using three methods: analytical, finite element method (FEM), and experimental techniques. The results show that the FEM and analytical stresses are closely aligned, while experimental stresses differ, particularly at lower loads and distances from the support. Overall, the study concludes that while analytical and FEM analyses provide similar stress results, experimental deflections vary due to material properties and inertia effects.