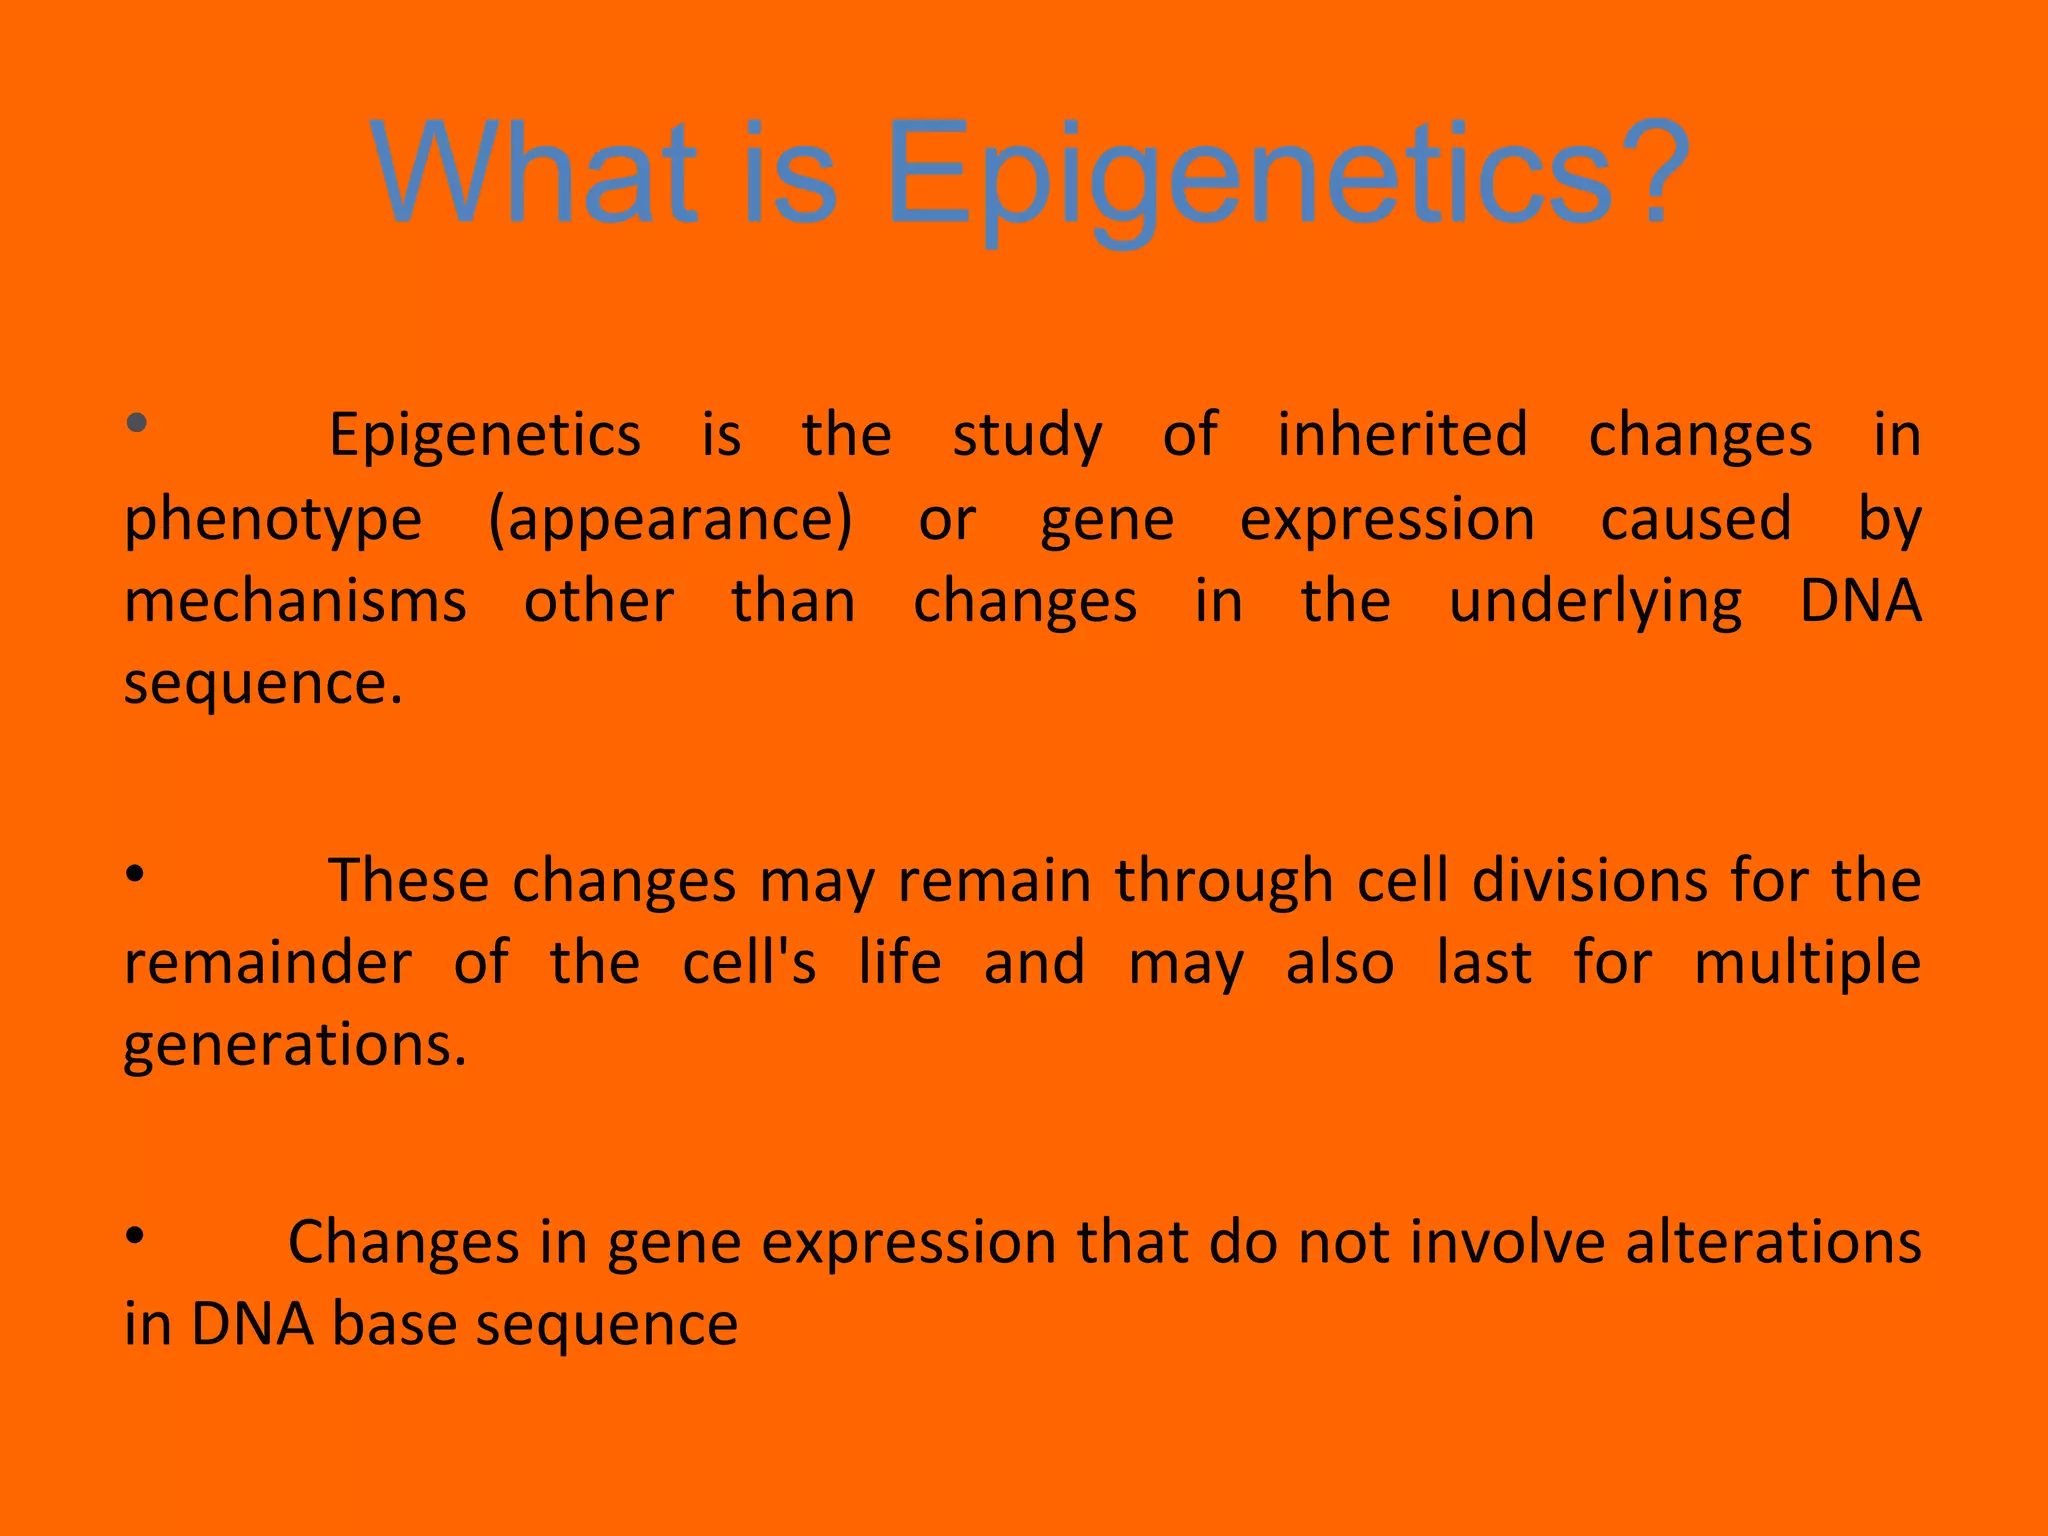
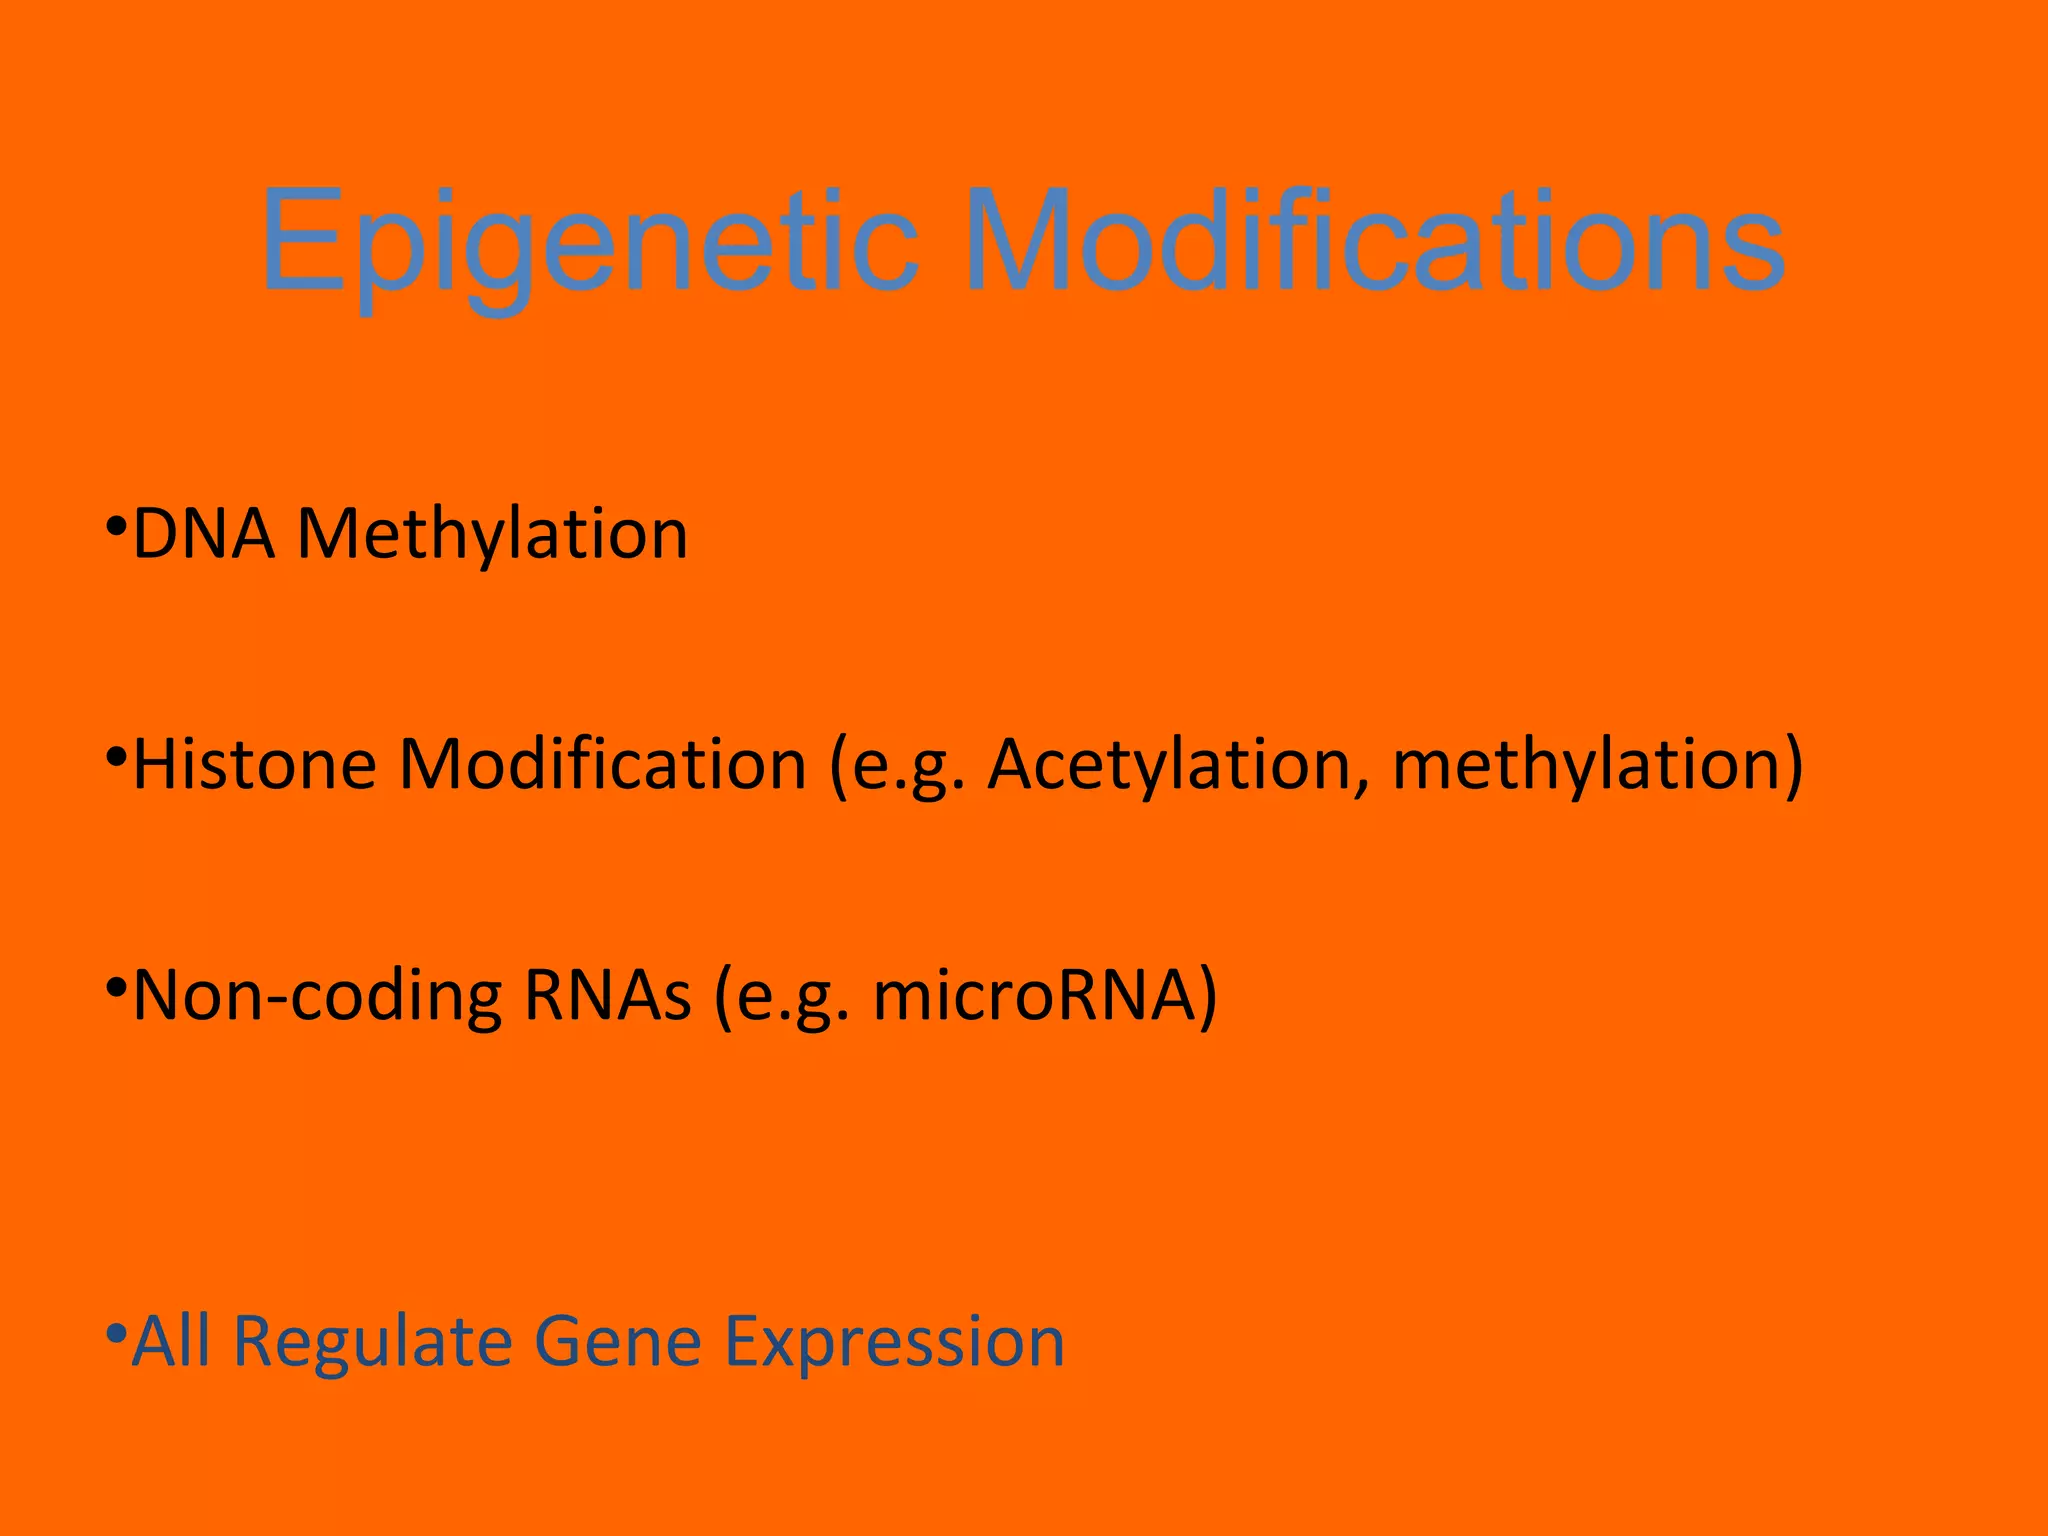
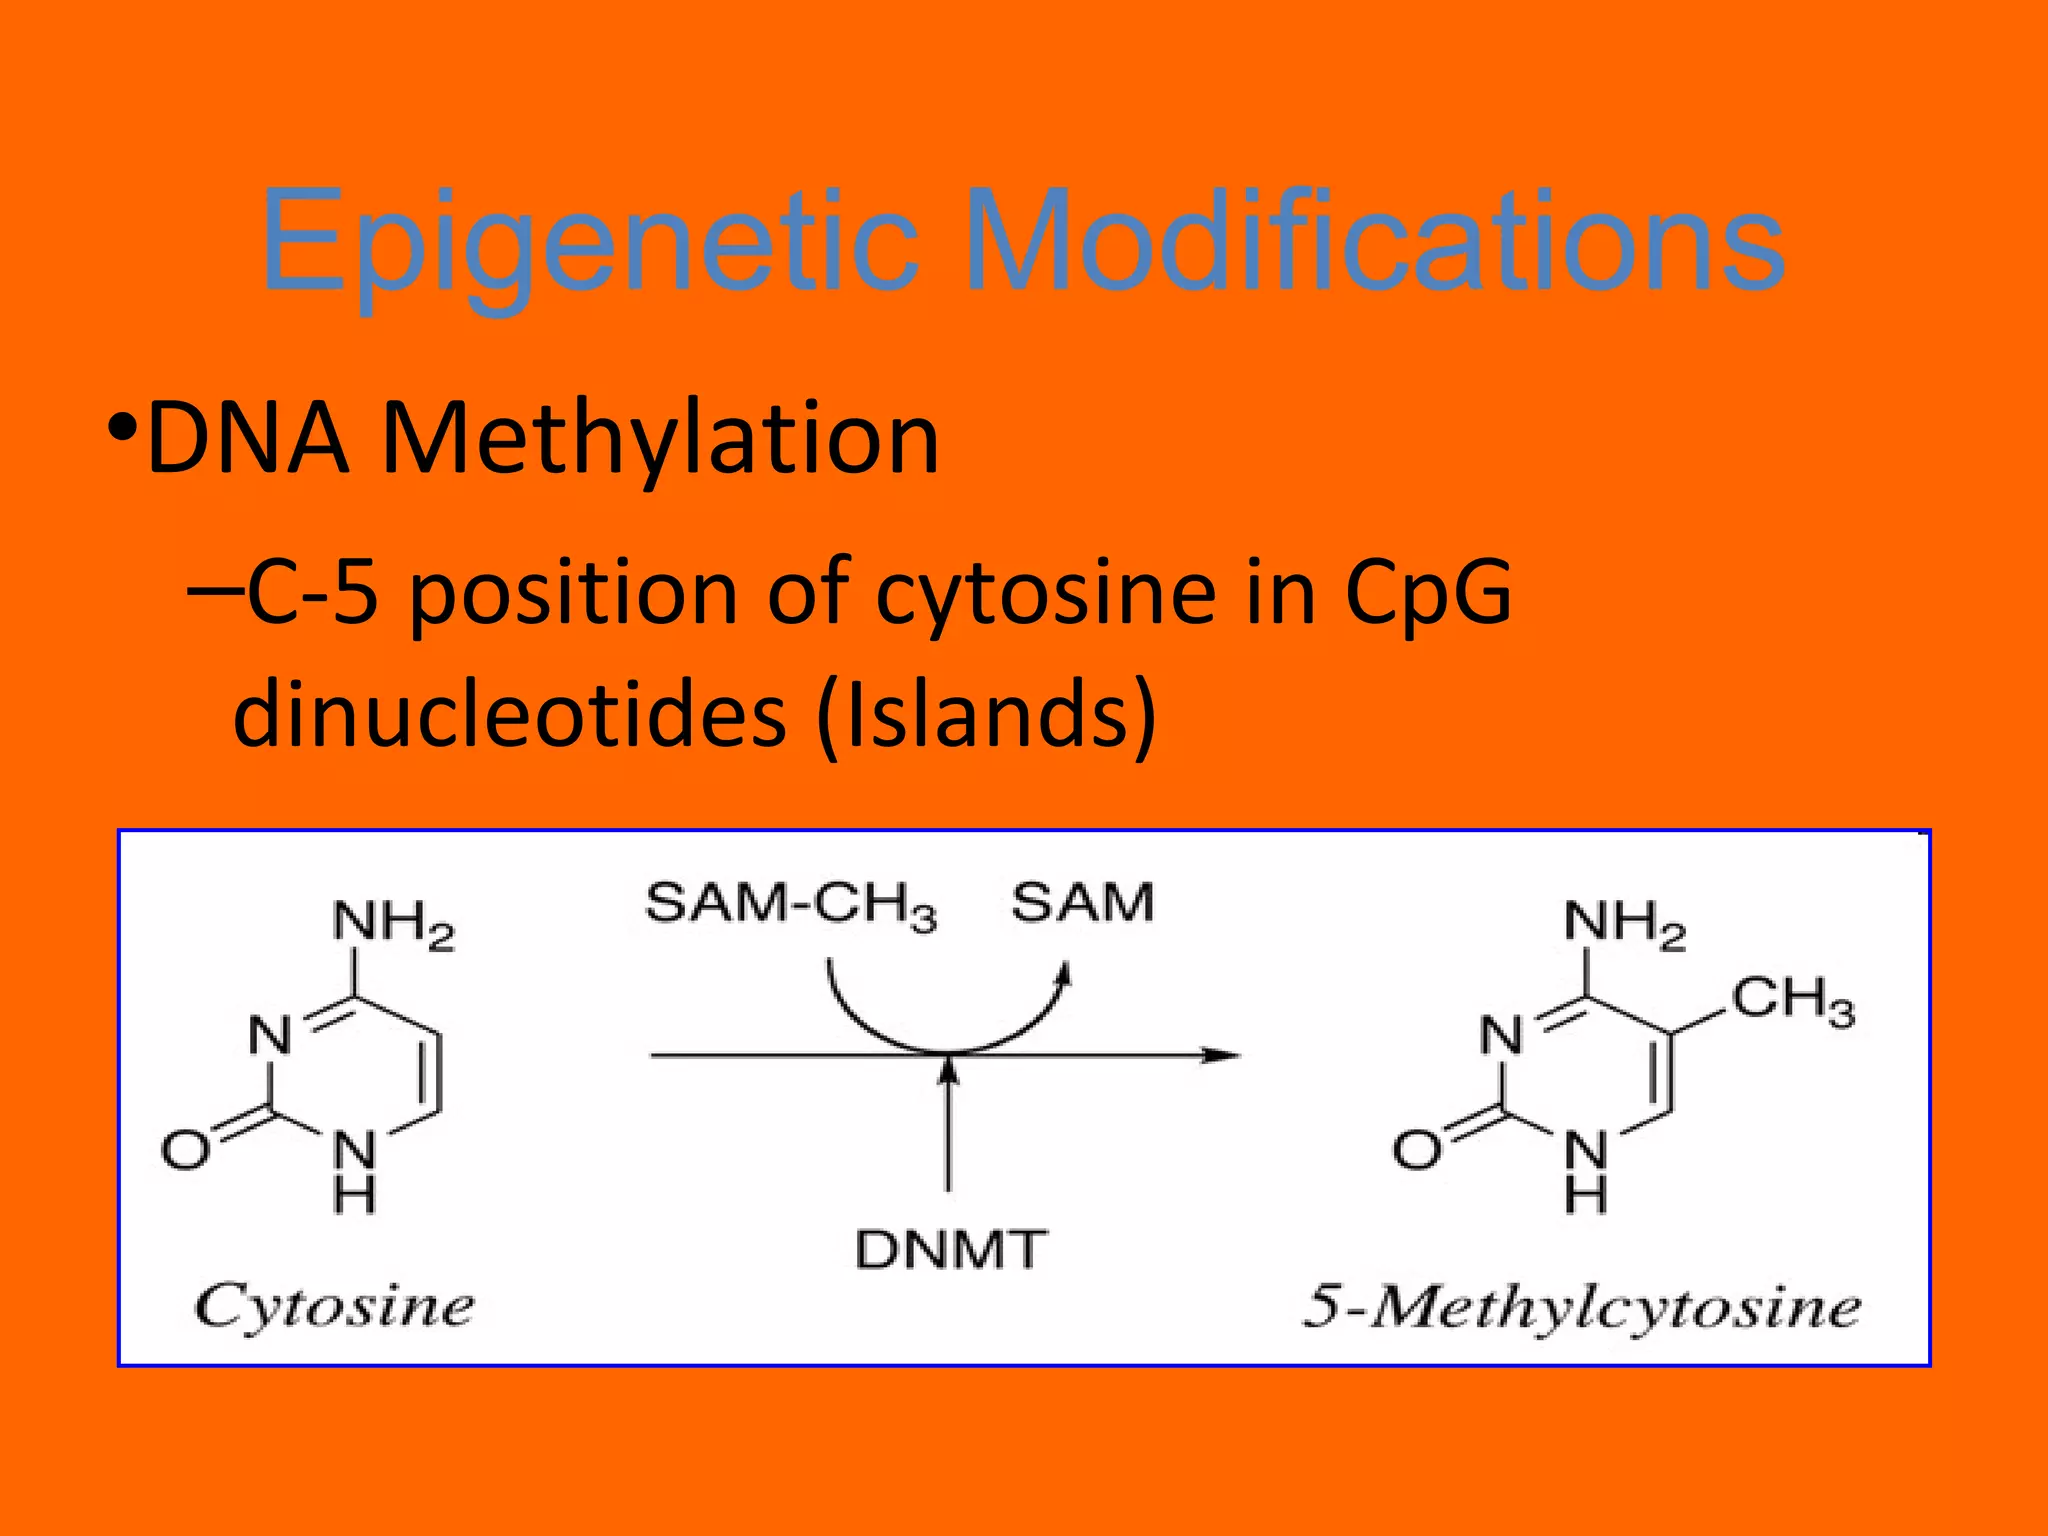
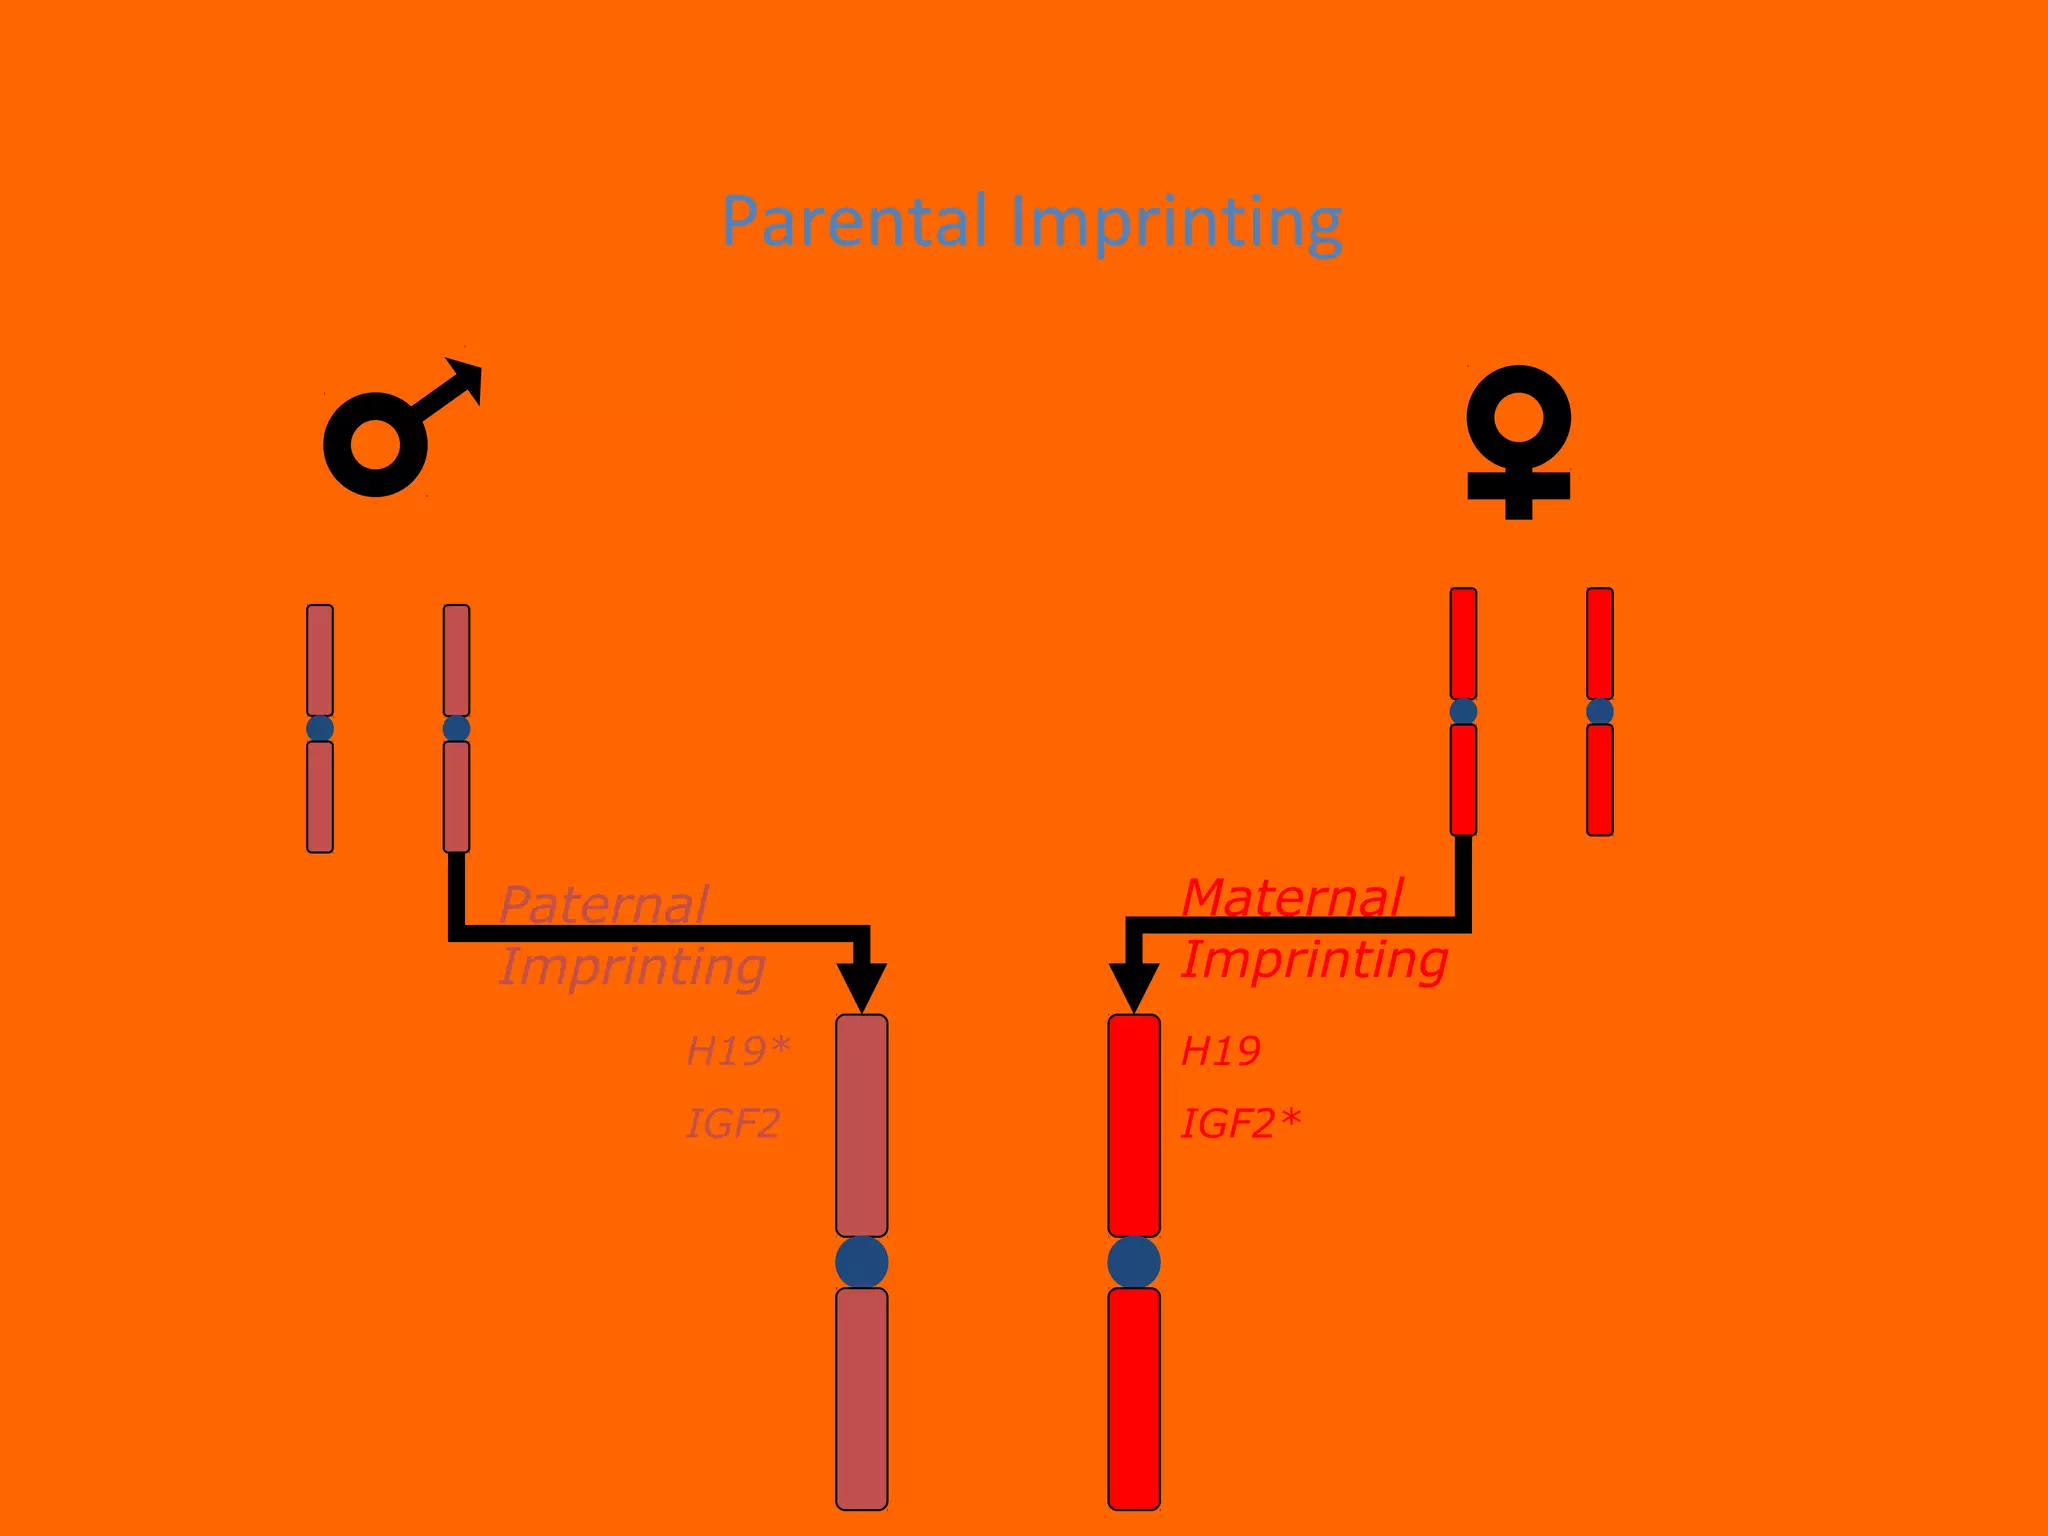
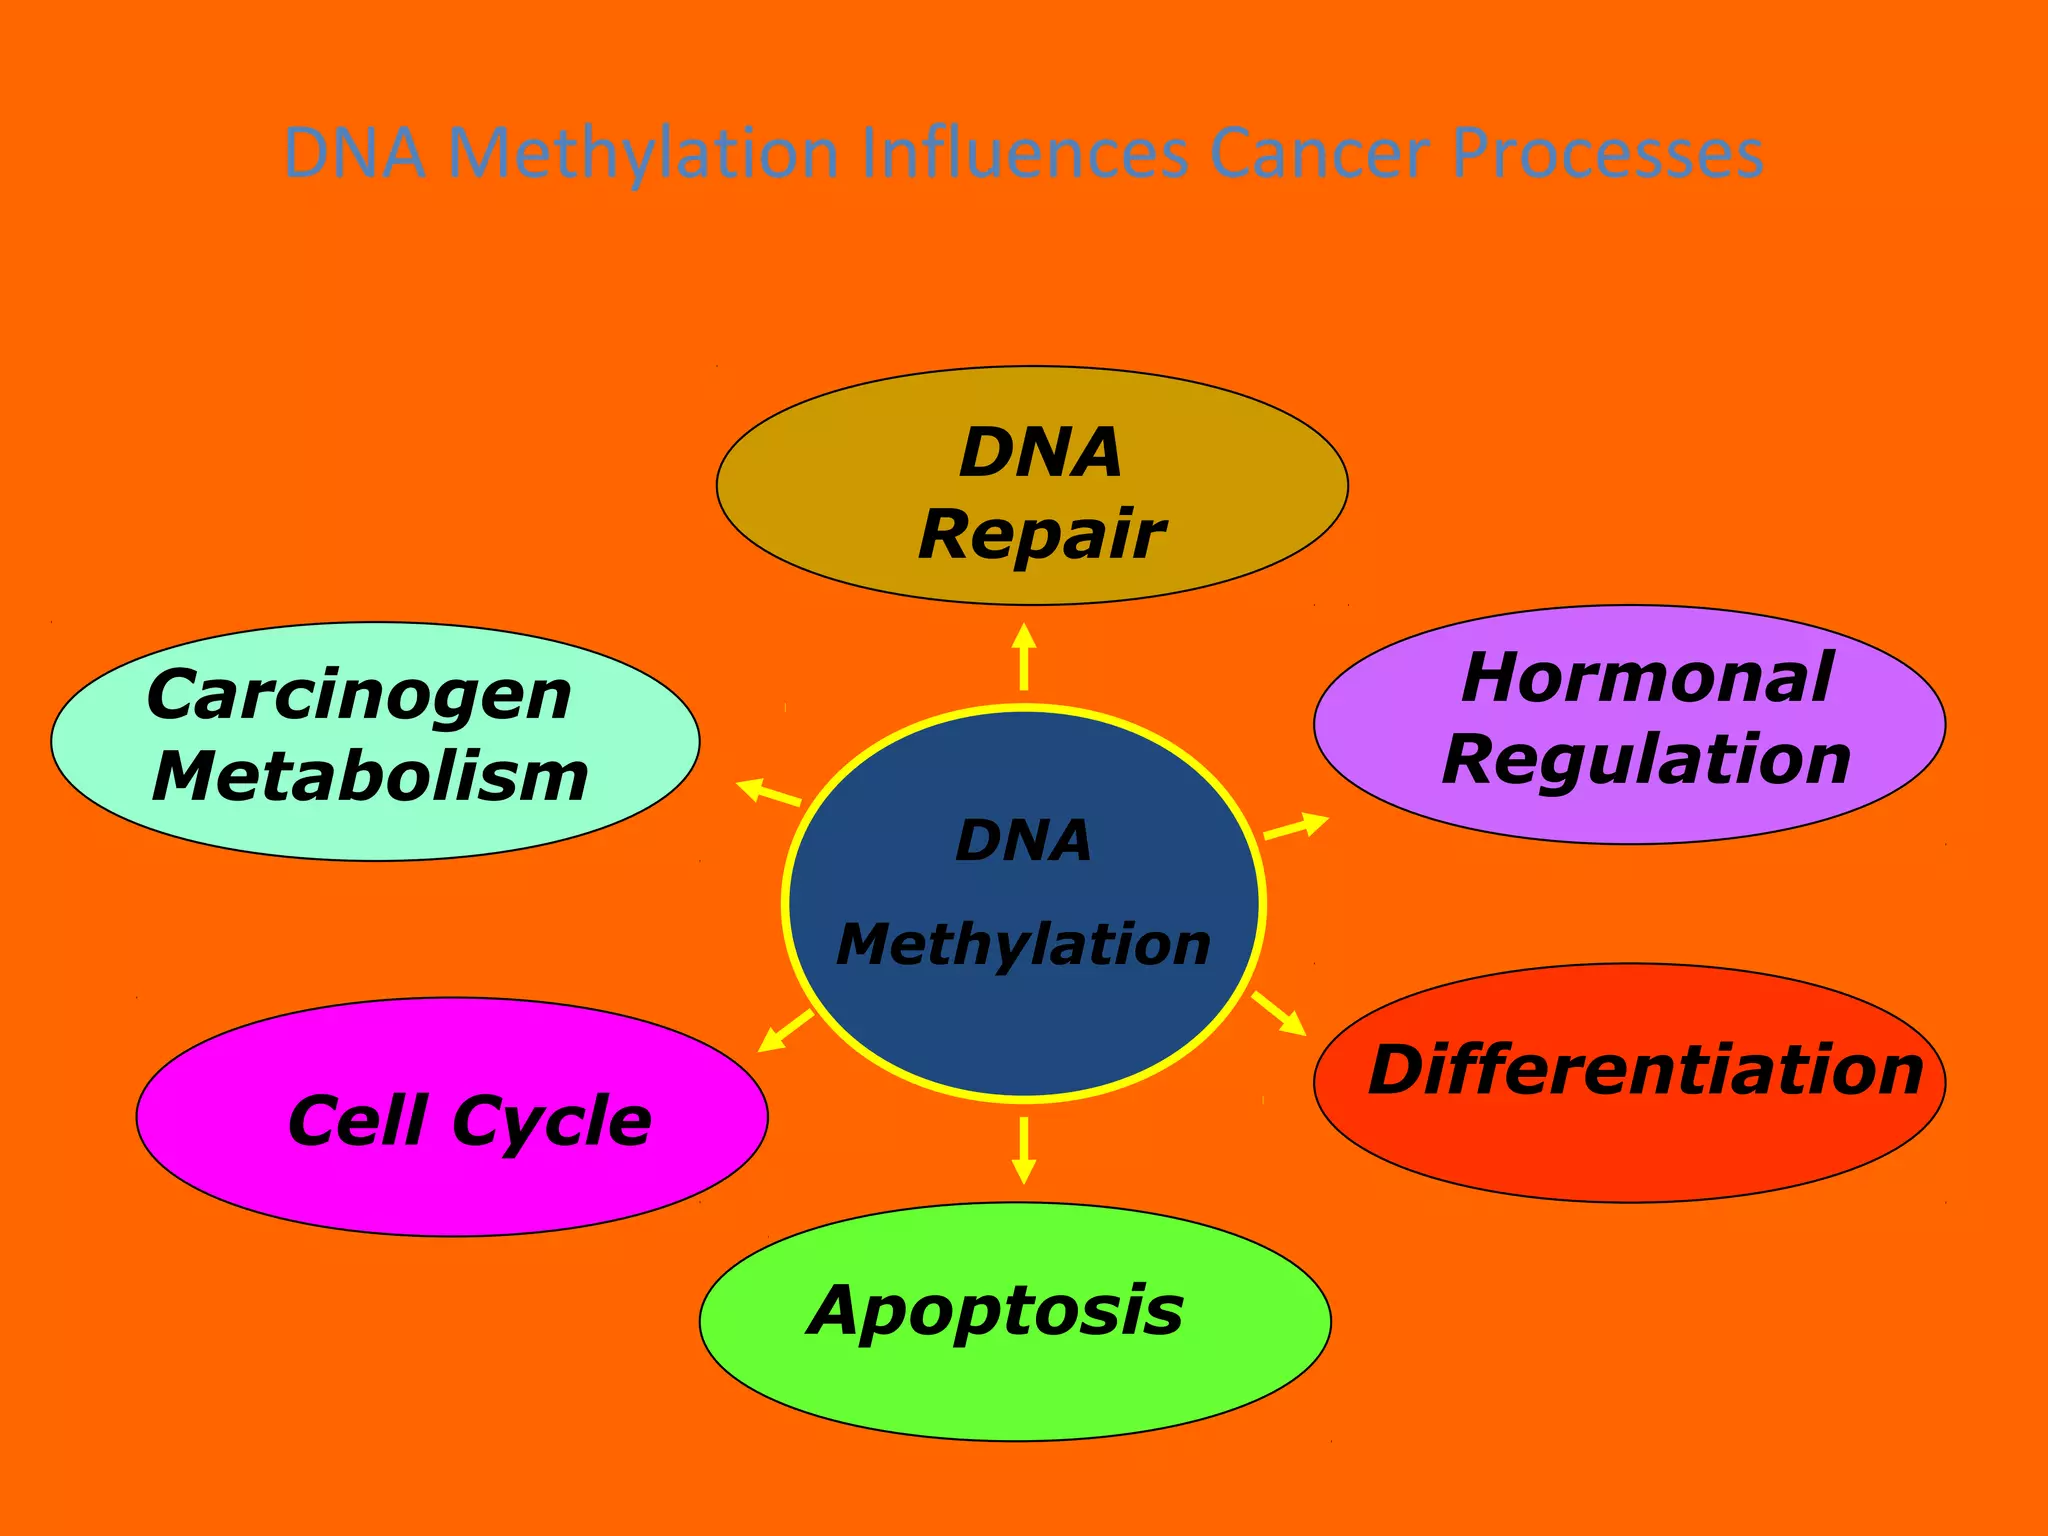
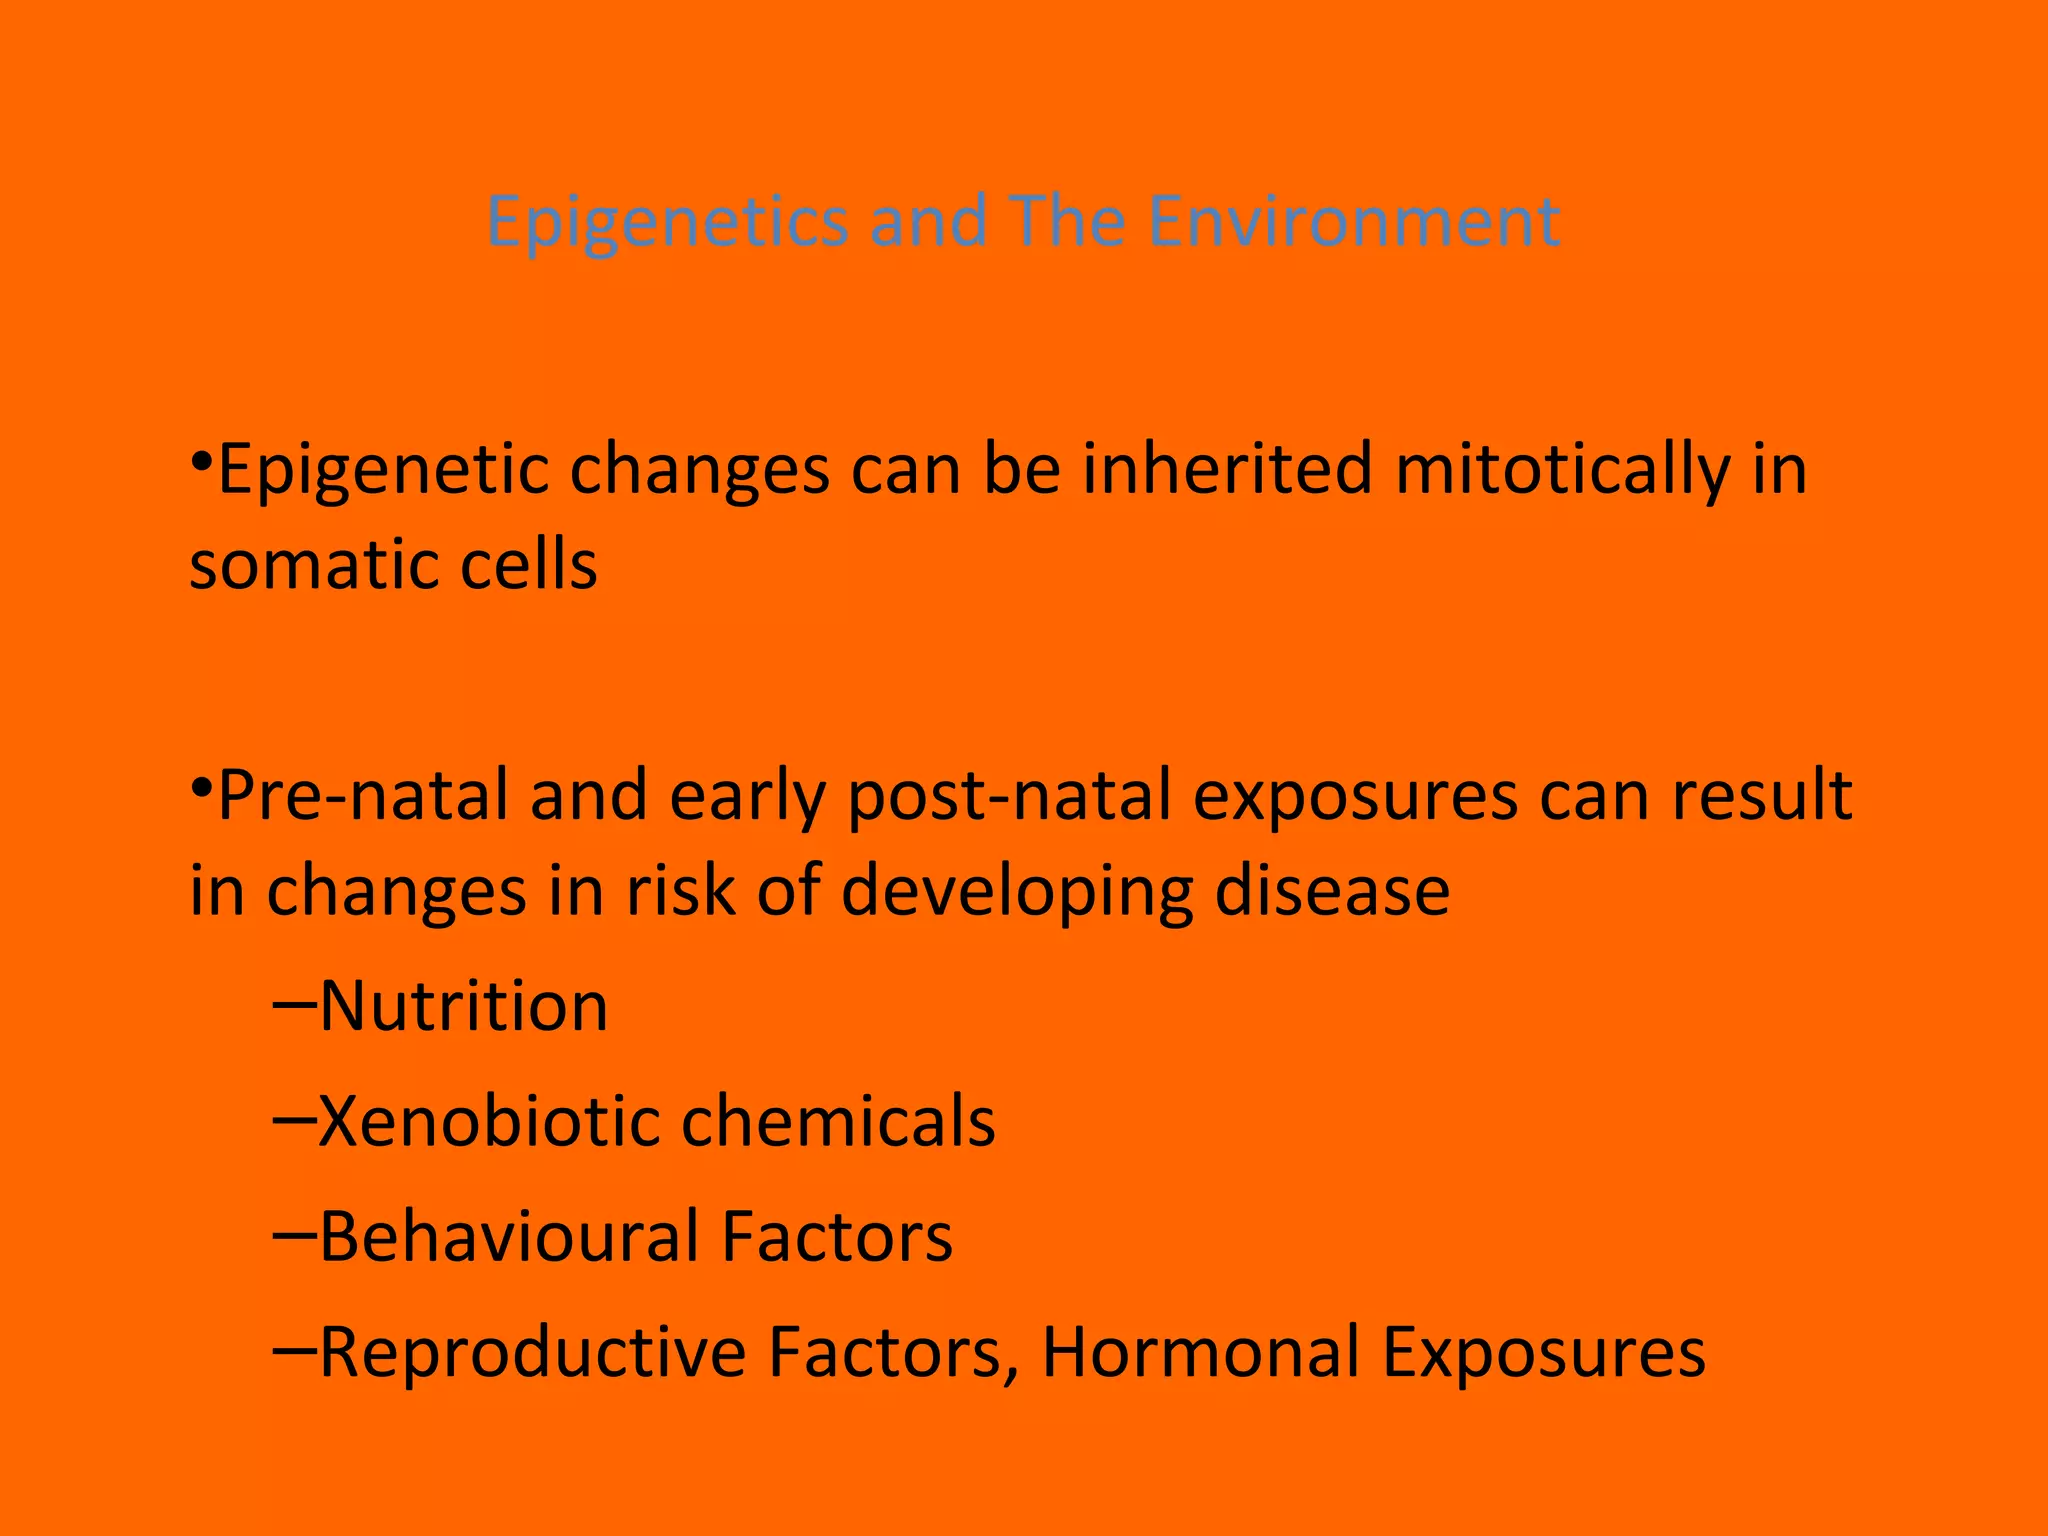
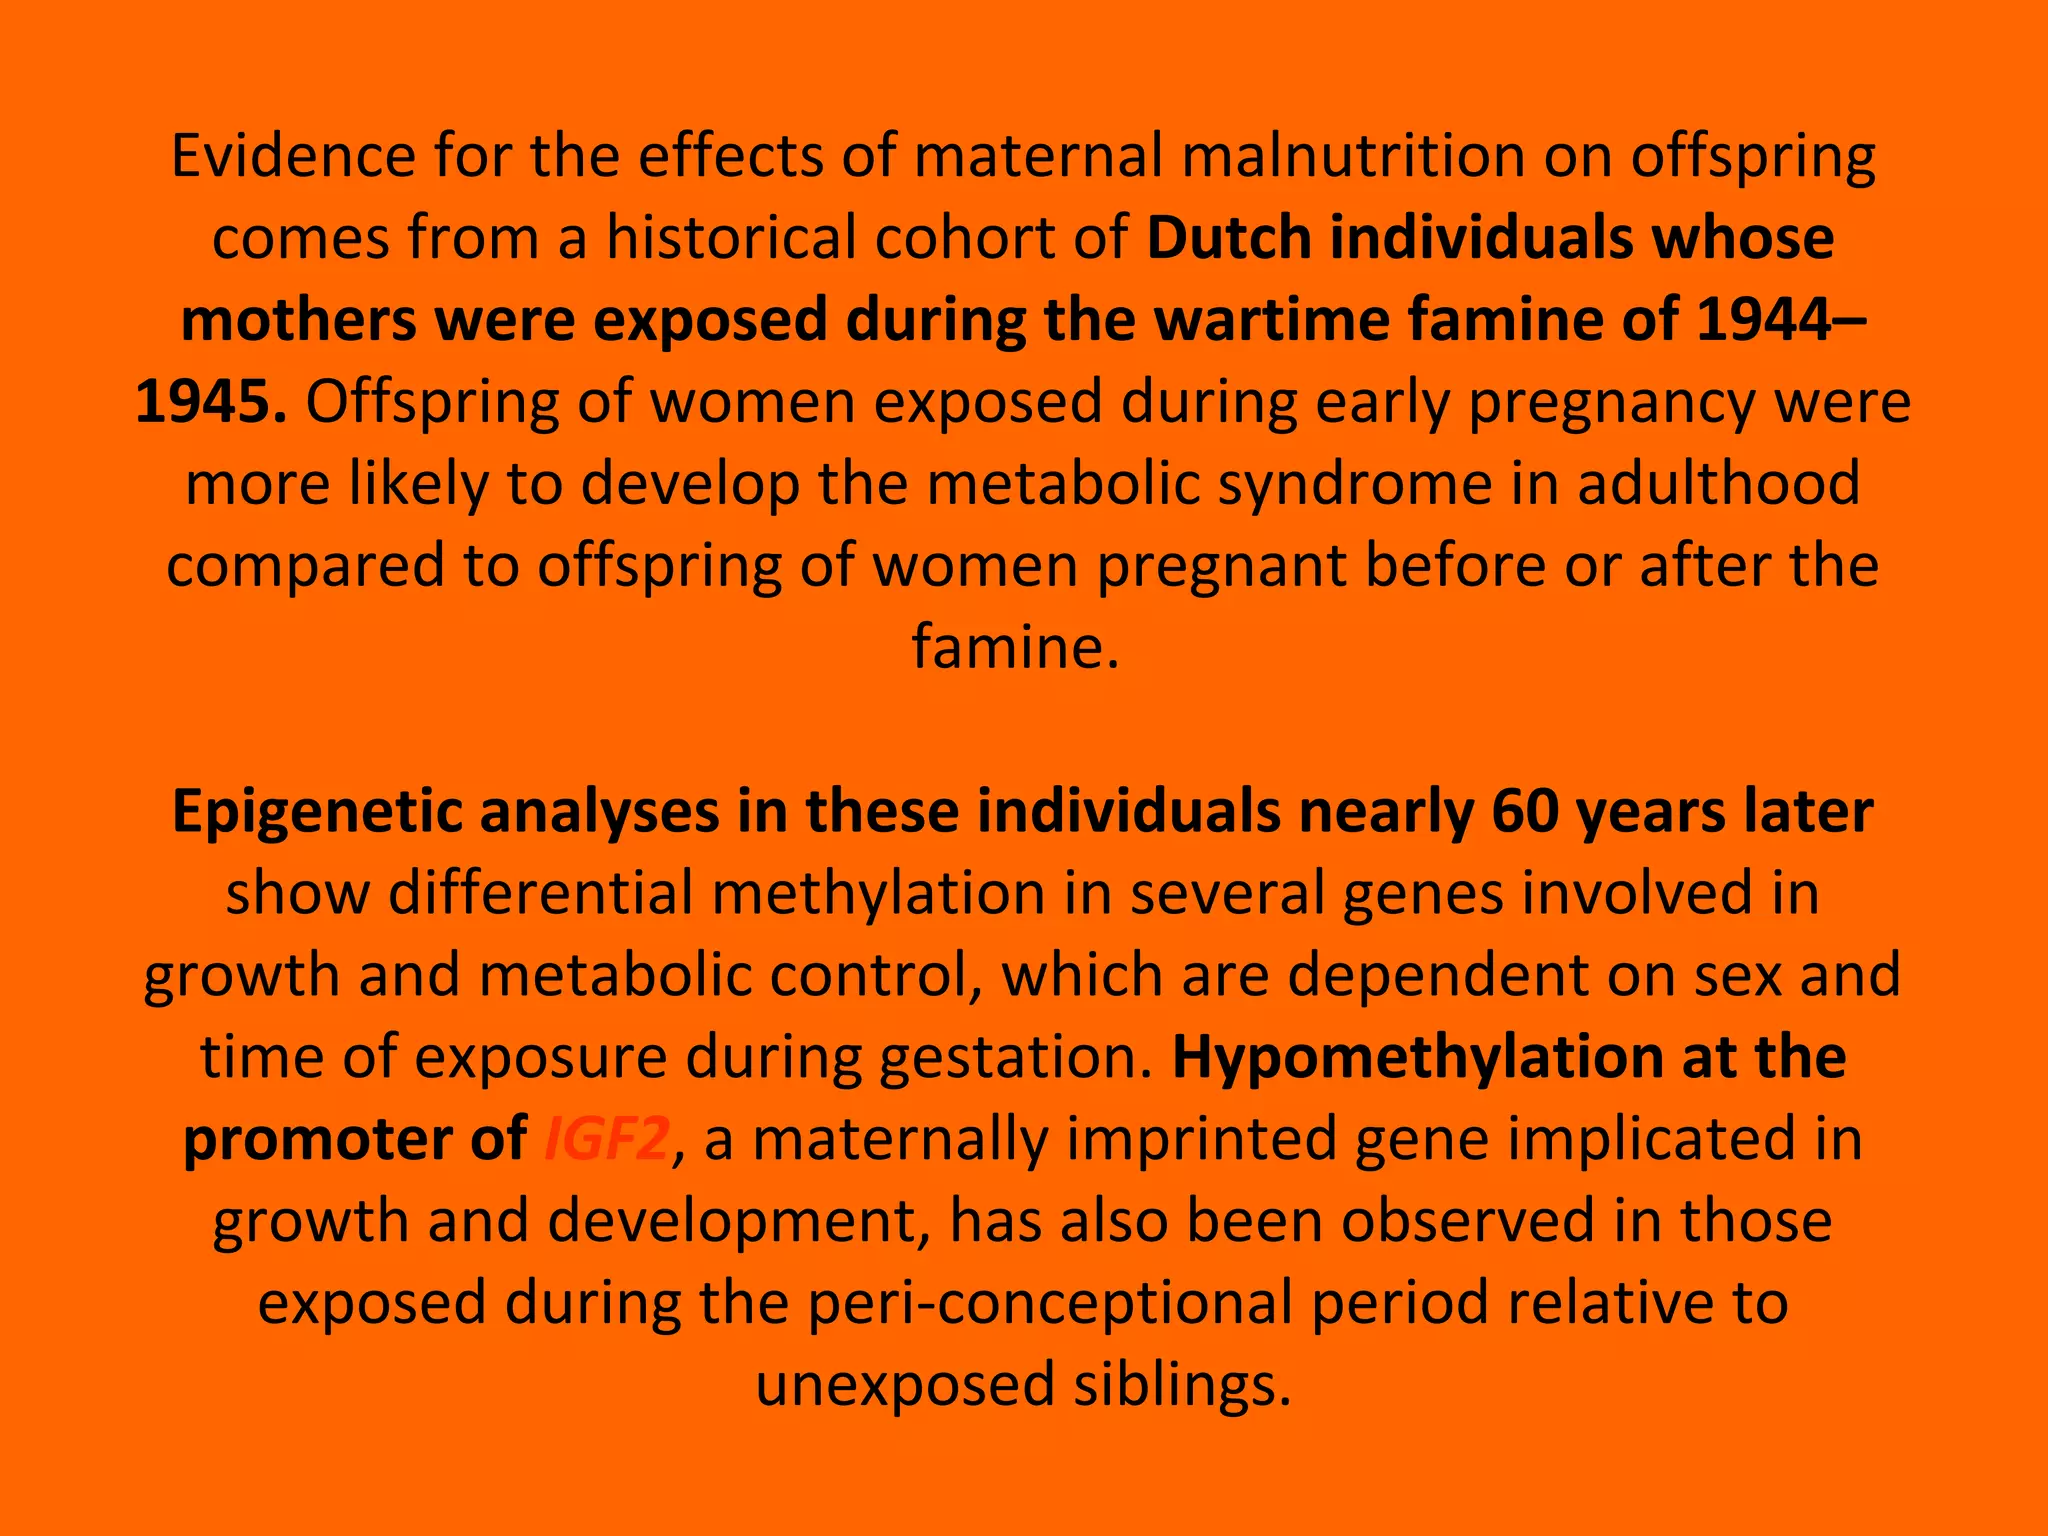
EPIGENETICS
“Inheritance” in images, from Darwin’s
“tree of life” to DNA’s iconic
crystallography to the epigenetic
dynamics
The iconic power of the double helix is related to its
heuristic simplicity, particularly as a mechanism to
explain inheritance.
However, the script needs to be interpreted and
receives meaning only from the interplay with the
environment (interpretation of the script).
The emphasis has been originally put on “variation”
(inherited mutations, common variants …),
i.e. an error in the script is at the basis of disease
Things become more complex with the discovery of
DNA’s “metabolism”, with transposable elements,
repair, methylation, miRNA, histone acetylation, i.e.
INTERPLAY WITH THE (internal and external)
ENVIRONMENT
What is Epigenetics?
• Epigenetics is the study of inherited changes in
phenotype (appearance) or gene expression caused by
mechanisms other than changes in the underlying DNA
sequence.
• These changes may remain through cell divisions for the
remainder of the cell's life and may also last for multiple
generations.
• Changes in gene expression that do not involve alterations
in DNA base sequence
MRC-HPA Centre for Environment and Health
Imperial College
London
Epigenetic Modifications
•DNA Methylation
•Histone Modification (e.g. Acetylation, methylation)
•Non-coding RNAs (e.g. microRNA)
•All Regulate Gene Expression
Epigenetic Modifications
•DNA Methylation
–C-5 position of cytosine in CpG
dinucleotides (Islands)
- When histones are tagged, or acetylated, chromatin is open
and genes are potentially active;
- When histones are not chemically tagged, deacetylated, the
chromatin condenses and genes silenced.
Epigenetic Modification: Histone Modifications
Epigenetic Modification: Non-coding RNAs
A new mechanism for gene
regulation
• RNA which is not used for making
proteins (non-coding RNA) can be
cleaved and
used to inhibit protein-coding
RNAs
•siRNAs, microRNAs (~22
Nucleotides; fine tune gene
Expression)
Epigenetic-Regulated Phenomena
•Cellular Differentiation
–Totipotent cells become pluripotent cells of the embyro
which differentiate into specific lineages
•X-chromosome Inactivation
–Gene expression on one of the female X-chromosomes is
downregulated
–DNA methylation and histone modifications
•Imprinting
–Epigenetic marking of a locus on the basis of parental origin
–Results in monoallelic gene expression
H19
IGF2*
H19*
IGF2
Paternal
Imprinting
Maternal
Imprinting
Parental Imprinting
Epigenetics and Cancer
1. DNA methylation
•Gene specific hypermethylation (eg RASSF1, MLH1)
•Genome-wide hypomethylation (4% down to 2-3% of all cytosines)
2.Histone Modifications
•Active vs Inactive histone marks
•Polycomb group gene silencing (H3-K27-me3)
•Growing data on the importance of epigenetics in the
aetiology and pathogenesis of cancer
Cancer Epigenetics Paradox: Global Loss of DNA methylation in addition to locus-specific
gain in methylation are causally linked to human cancer
Many cancer risk factors cause epigenetic modifications
DNA Methylation Influences Cancer Processes
DNA
Repair
Hormonal
Regulation
Carcinogen
Metabolism
Apoptosis
Differentiation
Cell Cycle
DNA
Methylation
Epigenetics and The Environment
•Epigenetic changes can be inherited mitotically in
somatic cells
•Pre-natal and early post-natal exposures can result
in changes in risk of developing disease
–Nutrition
–Xenobiotic chemicals
–Behavioural Factors
–Reproductive Factors, Hormonal Exposures
Epigenetics and The Environment
• Prenatal environment
• Famine exposure, Folic acid use (Tobi et al HMG 2009,Steegers-
Theunissen et al Plos One 2009)
• Adult methylome
• Smoking, Diet (Breitling AMHG 2011, Zhang Journal of Nutrition
2010)
• Cancer methylome
• Alcohol and folate (Christensen et al Plos genetics 2010)
• Methylation variability between monozygotic twins increases with
age (Fraga et al PNAS 2005)
Mapping sequences with differential DNA methylation
between MZ twins.
Fraga M F et al. PNAS 2005;102:10604-10609
1-3
H-MethylAcceptance(%)
100
50
0
Day of Depletion
6 69
Jacob et al J. Nutr. 128:1204, 1998
Dietary Folate Deficiency Causes Hypomethylation in Human
Lymphocytes
In Utero Nutritional Exposure and Changes in Offspring
Phenotype
Odds ratio for the metabolic syndrome according to birth weight among 407 men born in
Hertfordshire (adjusted for adult body mass index).
Hales C N , Barker D J P Br Med Bull 2001;60:5-20
Some examples from our research
Smoking and epigenetics
AHRR
1x10⁻⁵
1x10⁻⁷
Smoking intensity is directly correlated with hypomethylation at AHRR
and 2q37.1.
Methylation β-values are presented for non-smokers (0), former smokers (1)
and increasing intensities in current smokers as 2 (1-3 cigarettes per day), 3 (4-
8), 4 (9-13), 5 (14-18), 6 (19-23), 7 (24-28), 8 (29-33) and 9 (>34). The y-axis
represents methylation β-values with box and whisker plots showing the median
line, 25th-75th percentiles and whiskers showing the 95th percentile range for
each probe.
P=0.007
P=0.006
Smoking intensity is directly correlated with hypomethylation at AHRR
and 2q37.1. Shenker et al, Methylation and smoking in EPIC-Torino
(submitted)
.
The relevance of the findings or environmental epidemiology is due to
the key role played by AHR in th metabolism of dioxins, PAHs and other
environmental toxicants.
P=0.004
Rischio cumulativo di cancro del polmone nei non-fumatori e in fumatori che hanno cessato di fumare a
diverse età o non hanno cessato.
Vineis P et al. JNCI J Natl Cancer Inst 2004;96:99-106
© Oxford University Press
SES and epigenetics
Social inequalities in health
Gallo et al. PLoS One, 2012
Results: Total mortality among men with the highest education
level is reduced by 43% compared to men with the lowest
(HR 0.57, 95% C.I. 0.52–0.61); among women by 29% (HR 0.71,
95% C.I. 0.64–0.78).
The risk reduction was attenuated by 7%
in men and 3% in women by the introduction of smoking and
to a lesser extent (2% in men and 3% in women) by
introducing body mass index and additional explanatory
variables (alcohol consumption, leisure physical activity, fruit
and vegetable intake) (3% in men and 5% in women).
In the last years, research on SES has expanded with the aim of
identifying the biological mechanisms through which
socioeconomic status is embedded and eventually “gets under
the skin”
In humans, low socioeconomic status across the lifecourse has
been associated with greater diurnal cortisol production,
increased inflammatory activity, higher circulating antibodies
for several pathogens (suggesting dampened cell-mediated
immune response), reduction in prefrontal cortical grey matter
and greater amygdale reactivity to threat, among others.
Human and animal studies have shown that socioeconomic
status influences DNA Methylation and gene expression, in
particular across genome regions regulating the immune
function.
Social and financial adversities over the entire lifespan (and
more critically in early life) would program a “defensive”
phenotype that, through glucocorticoid receptor resistance,
would lead to exaggerated glucocorticoid levels and
uncontrolled inflammatory responses to challenges in adult life,
both increasing the risk of developing chronic diseases.
Dominance rank and expression level of pro-
inflammatory genes (macaques)
Tung et al. Social environment is associated with gene regulatory variation in the rhesus macaque immune system.
Proc Natl Acad Sci U S A. 2012 Apr 24;109(17):6490-5.
Unpublished data from the EPIC-Torino cohort (n=830)
(analysis by Silvia Stringhini)
Illumina 450K results under investigation
16 candidate genes have been selected by S.S. as being
implicated in psycho-social stress
Results after Bonferroni correction:
-1.5
-1
-0.5
0
0.5
1
MethylationdifferencebetweenSESextremes
(%)
NFATC1
 NFATC1 is one of the three genes
whose expression was more strongly
associated with social rank in
macaques (more expressed in
macaques with low social rank)
 NFATC1 gene is involved in the
expression of cytokine genes in T-
cells, especially in the induction of
the IL-2 or IL-4 gene transcription
 NFATC1 regulates not only the
activation and proliferation but also
the differentiation and programmed
death of T-lymphocytes as well as
lymphoid and non-lymphoid cells
SES and DNA methylation – EPIC Turin
Diet and epigenetics
Dutch Hunger Winter 1944-1945
•Famine in The Netherlands towards the end of WWII-caused by
Nazi occupation (blockade) and severe winter; led to severe
malnutrition in Dutch population
•Dutch Famine Birth Cohort Study-prospectively studies offspring
of mothers who were exposed to the famine
•Offspring shown to be increased risk of diabetes, obesity, CVD
•Offspring were smaller than those born to non-exposed mothers
and then the children of these offspring were also, on average,
smaller
–Suggestive of transgenerational inheritance-epigenetics
Difference in DNA methylation of CpG dinucleotides in siblings discordant for
periconceptional exposure to famine.
Tobi E W et al. Hum. Mol. Genet. 2009;18:4046-4053
•60 individuals pre-natally
exposed to famine compared
with matched, unexposed
siblings
•Investigated several genes
involved in metabolism
•Positive difference indicates
higher methylation level
among exposed individuals
Evidence for the effects of maternal malnutrition on offspring
comes from a historical cohort of Dutch individuals whose
mothers were exposed during the wartime famine of 1944–
1945. Offspring of women exposed during early pregnancy were
more likely to develop the metabolic syndrome in adulthood
compared to offspring of women pregnant before or after the
famine.
Epigenetic analyses in these individuals nearly 60 years later
show differential methylation in several genes involved in
growth and metabolic control, which are dependent on sex and
time of exposure during gestation. Hypomethylation at the
promoter of IGF2, a maternally imprinted gene implicated in
growth and development, has also been observed in those
exposed during the peri-conceptional period relative to
unexposed siblings.
•1-carbon metabolism is involved
in DNA synthesis and
methylation
 key for epigenetics
•1-C metabolism is highly related
to dietary intakes (e.g. folate,
Methionine…)
study of the association
between 1-C metabolism and
epigenetics through dietary
exposure
Lung cancer and 1-carbon metabolism in EPIC (Johansson,
Vineis, Brennan) – JAMA 2010
Analysis by quartiles
Vitamin B6 1·00 (reference)
0·76 (0·57 - 1·00)
0·54 (0·40 - 0·73)
0·30 (0·32 - 0·59)
ptrend
5
= 5x10⁻⁷
Methionine 1.00 (reference)
0·90 (0·69 - 1·18)
0·51 (0·38 - 0·69)
0·53 (0·40 - 0·72)
ptrend
5
= 2x10⁻⁶
<= 8 years > 8 years
Controls Cases OR 95% CI Controls Cases OR 95% CI
CDKN2A/P16 (Tumor Suppressor)
0 6 41 1.00 48 8 1.00
>0 9 28 0.42 (0.08-2.19) 35 15 2.02 (0.71-5.77)
RASSF1A (Tumor Suppressor)
<1.82 5 31 1.00 48 7 1.00
>=1.82 10 38 0.51 (0.11-2.39) 35 16 2.91 (0.98-8.61)
Odds ratios (OR) and 95% confidence intervals (CI) for methylation levels
(below/above median in controls) and lung cancer risk by time since blood
drawing (Vineis et al, Epigenetics 2010)
Methylation patterns in sentinel genes in peripheral blood cells
of heavy smokers: influence of cruciferous vegetables in an
intervention study
Scoccianti C, Vineis P et al, Epigenetics 2011
Intervention trial with 3 different diets in heavy smokers:
methylation of repeat sequences, tumour suppressor genes,
MTHFR and other genes.
These data suggest that a healthy diet may stabilize global
epigenetic (LINE-1 DNA methylation) patterns in peripheral white
blood cells, but do not provide specific evidence for potential
prevention of methylation changes in specific genes.
0.00
10.00
20.00
30.00
40.00
50.00
60.00
70.00
80.00
1111111111111111111111111111122222222222222222222222222222233333333333333333333333333333
Normal Enriched Supplemented
Dietary Groups
Mean%methylation
LINE T0
LINE T4
MLH1 T0
MLH1 T4
RASSF1A T0
RASSF1A T4
CDKN2A T0
CDKN2A T4
MTHFR T0
MTHFR T4
ARF T0
ARF T4
Epigenetics and disease prediction
Flanagan J, Vineis P et al. (Cancer Res, 2012).
Hypermethylation of ATM and other DNA repair genes
in breast cancer in four independent studies with pre-
clinical samples
Methylation of ATM and breast cancer.
Flanagan J, Vineis P et al. (Cancer Res,2012).
Chemicals and epigenetics
There is much more than genotoxicity - need to explore several
steps/segments of carcinogenic process
Simplified models of carcinogenesis (Vineis, Schatzkin, Potter,
Carcinogenesis 2010)
Model 1 Model 2 Model 3 Model 4
“mutational” “DNA instability” “non-genotoxic” “Darwinian”
Chemical carcinogens Familiarity Clonal expansion/ Clonal expansion/
Viruses Genome instability Epigenetics Cell selection
Tobacco and lung Colon cancer Diet, hormones Beta-carotene,
HPV Retinoblastoma folate,
chemotherapy
DNA adducts CI, MI, MMR, Rb, Methylation Selective advantage
mutations BRCA1, TSG histone acetylation
oncogenes
Mathematical models:
Armitage-Doll Knudson Moolgavkar Nowak
Thank you

Epigenetics

  • 1.
  • 2.
    “Inheritance” in images,from Darwin’s “tree of life” to DNA’s iconic crystallography to the epigenetic dynamics
  • 3.
    The iconic powerof the double helix is related to its heuristic simplicity, particularly as a mechanism to explain inheritance. However, the script needs to be interpreted and receives meaning only from the interplay with the environment (interpretation of the script).
  • 4.
    The emphasis hasbeen originally put on “variation” (inherited mutations, common variants …), i.e. an error in the script is at the basis of disease Things become more complex with the discovery of DNA’s “metabolism”, with transposable elements, repair, methylation, miRNA, histone acetylation, i.e. INTERPLAY WITH THE (internal and external) ENVIRONMENT
  • 5.
    What is Epigenetics? •Epigenetics is the study of inherited changes in phenotype (appearance) or gene expression caused by mechanisms other than changes in the underlying DNA sequence. • These changes may remain through cell divisions for the remainder of the cell's life and may also last for multiple generations. • Changes in gene expression that do not involve alterations in DNA base sequence
  • 7.
    MRC-HPA Centre forEnvironment and Health Imperial College London
  • 8.
    Epigenetic Modifications •DNA Methylation •HistoneModification (e.g. Acetylation, methylation) •Non-coding RNAs (e.g. microRNA) •All Regulate Gene Expression
  • 9.
    Epigenetic Modifications •DNA Methylation –C-5position of cytosine in CpG dinucleotides (Islands)
  • 10.
    - When histonesare tagged, or acetylated, chromatin is open and genes are potentially active; - When histones are not chemically tagged, deacetylated, the chromatin condenses and genes silenced. Epigenetic Modification: Histone Modifications
  • 11.
    Epigenetic Modification: Non-codingRNAs A new mechanism for gene regulation • RNA which is not used for making proteins (non-coding RNA) can be cleaved and used to inhibit protein-coding RNAs •siRNAs, microRNAs (~22 Nucleotides; fine tune gene Expression)
  • 12.
    Epigenetic-Regulated Phenomena •Cellular Differentiation –Totipotentcells become pluripotent cells of the embyro which differentiate into specific lineages •X-chromosome Inactivation –Gene expression on one of the female X-chromosomes is downregulated –DNA methylation and histone modifications •Imprinting –Epigenetic marking of a locus on the basis of parental origin –Results in monoallelic gene expression
  • 13.
  • 15.
    Epigenetics and Cancer 1.DNA methylation •Gene specific hypermethylation (eg RASSF1, MLH1) •Genome-wide hypomethylation (4% down to 2-3% of all cytosines) 2.Histone Modifications •Active vs Inactive histone marks •Polycomb group gene silencing (H3-K27-me3) •Growing data on the importance of epigenetics in the aetiology and pathogenesis of cancer Cancer Epigenetics Paradox: Global Loss of DNA methylation in addition to locus-specific gain in methylation are causally linked to human cancer Many cancer risk factors cause epigenetic modifications
  • 16.
    DNA Methylation InfluencesCancer Processes DNA Repair Hormonal Regulation Carcinogen Metabolism Apoptosis Differentiation Cell Cycle DNA Methylation
  • 17.
    Epigenetics and TheEnvironment •Epigenetic changes can be inherited mitotically in somatic cells •Pre-natal and early post-natal exposures can result in changes in risk of developing disease –Nutrition –Xenobiotic chemicals –Behavioural Factors –Reproductive Factors, Hormonal Exposures
  • 18.
    Epigenetics and TheEnvironment • Prenatal environment • Famine exposure, Folic acid use (Tobi et al HMG 2009,Steegers- Theunissen et al Plos One 2009) • Adult methylome • Smoking, Diet (Breitling AMHG 2011, Zhang Journal of Nutrition 2010) • Cancer methylome • Alcohol and folate (Christensen et al Plos genetics 2010) • Methylation variability between monozygotic twins increases with age (Fraga et al PNAS 2005)
  • 19.
    Mapping sequences withdifferential DNA methylation between MZ twins. Fraga M F et al. PNAS 2005;102:10604-10609
  • 20.
    1-3 H-MethylAcceptance(%) 100 50 0 Day of Depletion 669 Jacob et al J. Nutr. 128:1204, 1998 Dietary Folate Deficiency Causes Hypomethylation in Human Lymphocytes
  • 21.
    In Utero NutritionalExposure and Changes in Offspring Phenotype
  • 23.
    Odds ratio forthe metabolic syndrome according to birth weight among 407 men born in Hertfordshire (adjusted for adult body mass index). Hales C N , Barker D J P Br Med Bull 2001;60:5-20
  • 24.
    Some examples fromour research Smoking and epigenetics
  • 25.
  • 26.
    Smoking intensity isdirectly correlated with hypomethylation at AHRR and 2q37.1. Methylation β-values are presented for non-smokers (0), former smokers (1) and increasing intensities in current smokers as 2 (1-3 cigarettes per day), 3 (4- 8), 4 (9-13), 5 (14-18), 6 (19-23), 7 (24-28), 8 (29-33) and 9 (>34). The y-axis represents methylation β-values with box and whisker plots showing the median line, 25th-75th percentiles and whiskers showing the 95th percentile range for each probe.
  • 27.
    P=0.007 P=0.006 Smoking intensity isdirectly correlated with hypomethylation at AHRR and 2q37.1. Shenker et al, Methylation and smoking in EPIC-Torino (submitted) . The relevance of the findings or environmental epidemiology is due to the key role played by AHR in th metabolism of dioxins, PAHs and other environmental toxicants. P=0.004
  • 28.
    Rischio cumulativo dicancro del polmone nei non-fumatori e in fumatori che hanno cessato di fumare a diverse età o non hanno cessato. Vineis P et al. JNCI J Natl Cancer Inst 2004;96:99-106 © Oxford University Press
  • 29.
  • 30.
  • 31.
    Gallo et al.PLoS One, 2012 Results: Total mortality among men with the highest education level is reduced by 43% compared to men with the lowest (HR 0.57, 95% C.I. 0.52–0.61); among women by 29% (HR 0.71, 95% C.I. 0.64–0.78). The risk reduction was attenuated by 7% in men and 3% in women by the introduction of smoking and to a lesser extent (2% in men and 3% in women) by introducing body mass index and additional explanatory variables (alcohol consumption, leisure physical activity, fruit and vegetable intake) (3% in men and 5% in women).
  • 33.
    In the lastyears, research on SES has expanded with the aim of identifying the biological mechanisms through which socioeconomic status is embedded and eventually “gets under the skin” In humans, low socioeconomic status across the lifecourse has been associated with greater diurnal cortisol production, increased inflammatory activity, higher circulating antibodies for several pathogens (suggesting dampened cell-mediated immune response), reduction in prefrontal cortical grey matter and greater amygdale reactivity to threat, among others.
  • 34.
    Human and animalstudies have shown that socioeconomic status influences DNA Methylation and gene expression, in particular across genome regions regulating the immune function. Social and financial adversities over the entire lifespan (and more critically in early life) would program a “defensive” phenotype that, through glucocorticoid receptor resistance, would lead to exaggerated glucocorticoid levels and uncontrolled inflammatory responses to challenges in adult life, both increasing the risk of developing chronic diseases.
  • 35.
    Dominance rank andexpression level of pro- inflammatory genes (macaques) Tung et al. Social environment is associated with gene regulatory variation in the rhesus macaque immune system. Proc Natl Acad Sci U S A. 2012 Apr 24;109(17):6490-5.
  • 36.
    Unpublished data fromthe EPIC-Torino cohort (n=830) (analysis by Silvia Stringhini) Illumina 450K results under investigation 16 candidate genes have been selected by S.S. as being implicated in psycho-social stress Results after Bonferroni correction:
  • 37.
    -1.5 -1 -0.5 0 0.5 1 MethylationdifferencebetweenSESextremes (%) NFATC1  NFATC1 isone of the three genes whose expression was more strongly associated with social rank in macaques (more expressed in macaques with low social rank)  NFATC1 gene is involved in the expression of cytokine genes in T- cells, especially in the induction of the IL-2 or IL-4 gene transcription  NFATC1 regulates not only the activation and proliferation but also the differentiation and programmed death of T-lymphocytes as well as lymphoid and non-lymphoid cells SES and DNA methylation – EPIC Turin
  • 38.
  • 39.
    Dutch Hunger Winter1944-1945 •Famine in The Netherlands towards the end of WWII-caused by Nazi occupation (blockade) and severe winter; led to severe malnutrition in Dutch population •Dutch Famine Birth Cohort Study-prospectively studies offspring of mothers who were exposed to the famine •Offspring shown to be increased risk of diabetes, obesity, CVD •Offspring were smaller than those born to non-exposed mothers and then the children of these offspring were also, on average, smaller –Suggestive of transgenerational inheritance-epigenetics
  • 40.
    Difference in DNAmethylation of CpG dinucleotides in siblings discordant for periconceptional exposure to famine. Tobi E W et al. Hum. Mol. Genet. 2009;18:4046-4053 •60 individuals pre-natally exposed to famine compared with matched, unexposed siblings •Investigated several genes involved in metabolism •Positive difference indicates higher methylation level among exposed individuals
  • 41.
    Evidence for theeffects of maternal malnutrition on offspring comes from a historical cohort of Dutch individuals whose mothers were exposed during the wartime famine of 1944– 1945. Offspring of women exposed during early pregnancy were more likely to develop the metabolic syndrome in adulthood compared to offspring of women pregnant before or after the famine. Epigenetic analyses in these individuals nearly 60 years later show differential methylation in several genes involved in growth and metabolic control, which are dependent on sex and time of exposure during gestation. Hypomethylation at the promoter of IGF2, a maternally imprinted gene implicated in growth and development, has also been observed in those exposed during the peri-conceptional period relative to unexposed siblings.
  • 42.
    •1-carbon metabolism isinvolved in DNA synthesis and methylation  key for epigenetics •1-C metabolism is highly related to dietary intakes (e.g. folate, Methionine…) study of the association between 1-C metabolism and epigenetics through dietary exposure
  • 43.
    Lung cancer and1-carbon metabolism in EPIC (Johansson, Vineis, Brennan) – JAMA 2010 Analysis by quartiles Vitamin B6 1·00 (reference) 0·76 (0·57 - 1·00) 0·54 (0·40 - 0·73) 0·30 (0·32 - 0·59) ptrend 5 = 5x10⁻⁷ Methionine 1.00 (reference) 0·90 (0·69 - 1·18) 0·51 (0·38 - 0·69) 0·53 (0·40 - 0·72) ptrend 5 = 2x10⁻⁶
  • 44.
    <= 8 years> 8 years Controls Cases OR 95% CI Controls Cases OR 95% CI CDKN2A/P16 (Tumor Suppressor) 0 6 41 1.00 48 8 1.00 >0 9 28 0.42 (0.08-2.19) 35 15 2.02 (0.71-5.77) RASSF1A (Tumor Suppressor) <1.82 5 31 1.00 48 7 1.00 >=1.82 10 38 0.51 (0.11-2.39) 35 16 2.91 (0.98-8.61) Odds ratios (OR) and 95% confidence intervals (CI) for methylation levels (below/above median in controls) and lung cancer risk by time since blood drawing (Vineis et al, Epigenetics 2010)
  • 45.
    Methylation patterns insentinel genes in peripheral blood cells of heavy smokers: influence of cruciferous vegetables in an intervention study Scoccianti C, Vineis P et al, Epigenetics 2011 Intervention trial with 3 different diets in heavy smokers: methylation of repeat sequences, tumour suppressor genes, MTHFR and other genes. These data suggest that a healthy diet may stabilize global epigenetic (LINE-1 DNA methylation) patterns in peripheral white blood cells, but do not provide specific evidence for potential prevention of methylation changes in specific genes.
  • 46.
    0.00 10.00 20.00 30.00 40.00 50.00 60.00 70.00 80.00 1111111111111111111111111111122222222222222222222222222222233333333333333333333333333333 Normal Enriched Supplemented DietaryGroups Mean%methylation LINE T0 LINE T4 MLH1 T0 MLH1 T4 RASSF1A T0 RASSF1A T4 CDKN2A T0 CDKN2A T4 MTHFR T0 MTHFR T4 ARF T0 ARF T4
  • 47.
  • 48.
    Flanagan J, VineisP et al. (Cancer Res, 2012). Hypermethylation of ATM and other DNA repair genes in breast cancer in four independent studies with pre- clinical samples
  • 49.
    Methylation of ATMand breast cancer. Flanagan J, Vineis P et al. (Cancer Res,2012).
  • 50.
  • 53.
    There is muchmore than genotoxicity - need to explore several steps/segments of carcinogenic process Simplified models of carcinogenesis (Vineis, Schatzkin, Potter, Carcinogenesis 2010) Model 1 Model 2 Model 3 Model 4 “mutational” “DNA instability” “non-genotoxic” “Darwinian” Chemical carcinogens Familiarity Clonal expansion/ Clonal expansion/ Viruses Genome instability Epigenetics Cell selection Tobacco and lung Colon cancer Diet, hormones Beta-carotene, HPV Retinoblastoma folate, chemotherapy DNA adducts CI, MI, MMR, Rb, Methylation Selective advantage mutations BRCA1, TSG histone acetylation oncogenes Mathematical models: Armitage-Doll Knudson Moolgavkar Nowak
  • 54.

Editor's Notes

  • #29 Figure 3. Smoking Intensity is directly correlated with hypomethylation at AHRR and 2q37.1. Methylation Beta values are presented for Never smokers (0), Former smokers (1) and increasing intensities in current smokers from 2 (1-3 cigarettes per day), 3 (4-8), 4 (9-13), 5(14-18), 6(19-23), 7(24-28), 8(29-33), 9(&amp;gt;34). Y-axis represents Methylation Beta values with box and whisker plots showing the median line, 25th-75th percentiles and whiskers showing the 95th percentile range for each probe. General linear regression adjusting for age and batch, in smokers only, was used to investigate the interaction between methylation and smoking intensity (p-value for each probe is shown within the plot). Never smokers and former smokers are plotted only for comparison.
  • #42 Difference in DNA methylation of CpG dinucleotides in siblings discordant for periconceptional exposure to famine. Bars in the figures represent the average absolute within-pair difference in DNA methylation and their standard errors for CpG dinucleotides. A positive difference indicates a higher methylation level among exposed individuals. The exact location of the CpG dinucleotides can be found using Supplementary Material, Table S1. (A) The absolute within-pair difference for CpG dinucleotides for which a significant overall difference of the locus in DNA methylation was observed. (B) As in (A), but for men. Only loci showing a significant interaction between sex and exposure are depicted. (C) As in (B), but for women only.