Downloaded 161 times
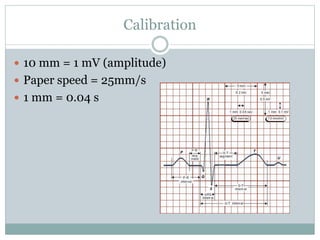
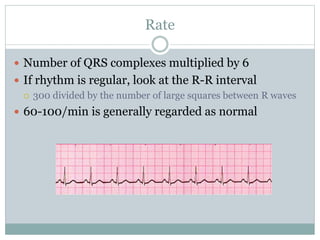
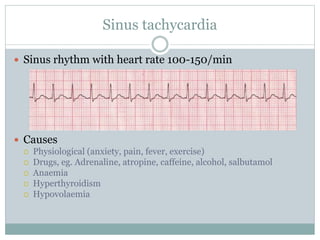
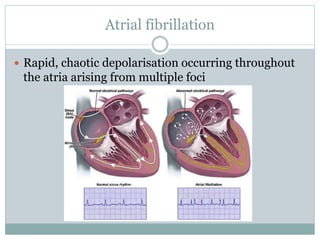
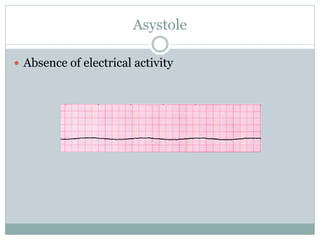
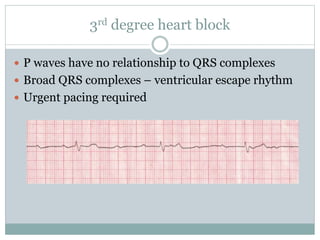
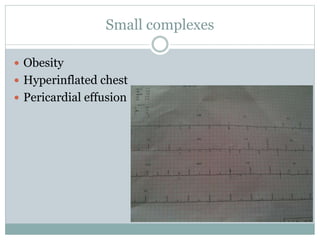
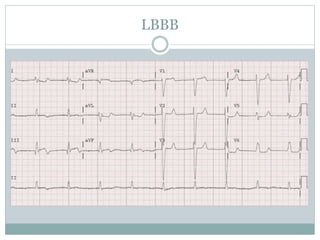
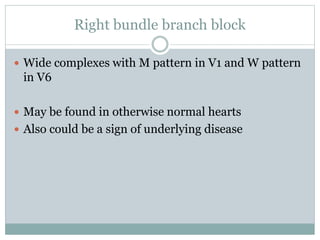
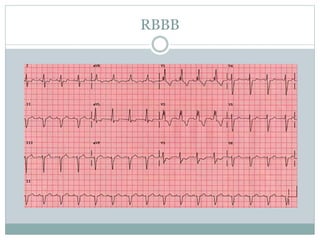
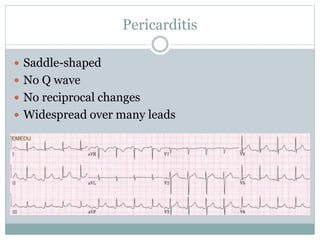
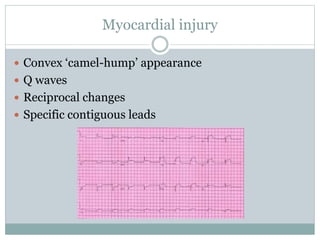

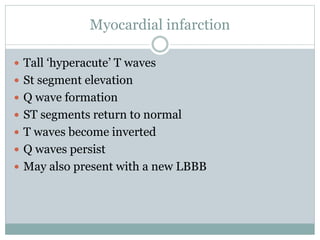
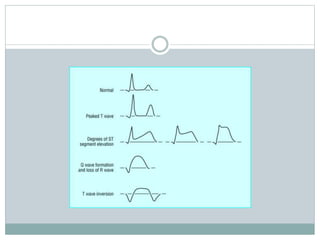
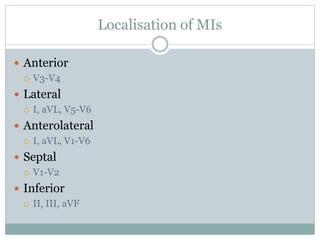
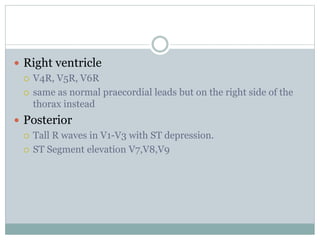
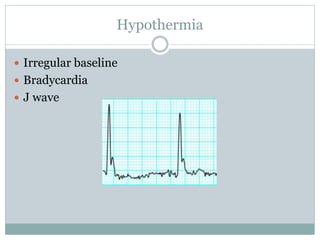

This document provides an overview of how to interpret common ECG abnormalities through 3 sentences or less summaries: 1) It outlines how to measure rate, rhythm, intervals, complexes, and waves on an ECG and identifies what is considered normal. 2) Key abnormal rhythms, rates, intervals, and waves are defined along with their potential causes, such as sinus bradycardia, atrial fibrillation, various heart blocks, ventricular tachycardia, ST segment changes, T wave inversions, bundle branch blocks, and more. 3) Methods for localizing myocardial infarctions and abnormalities seen in conditions like hyperkalemia and hypothermia are also summarized.


![Hypothalamus short ppt by Dr. Neha [PT].pptx](https://cdn.slidesharecdn.com/ss_thumbnails/hypothalamusbydr-260124145759-b9f94a93-thumbnail.jpg?width=640&height=640&fit=bounds)


