Systems Analysis
• Focusis the logical view of the
system, not the physical
• “What” the system is to accomplish,
not how
• Tools:
–data flow diagrams
–data dictionary
–process specification
–entity-relationship diagrams
3.
Data Flow Diagram:
"anetwork representation of a system.
The system may be automated, manual, or
mixed. The DFD portrays the system in
terms of its component pieces, with all
interfaces among the components
indicated."
- Tom DeMarco
hence DFDs:
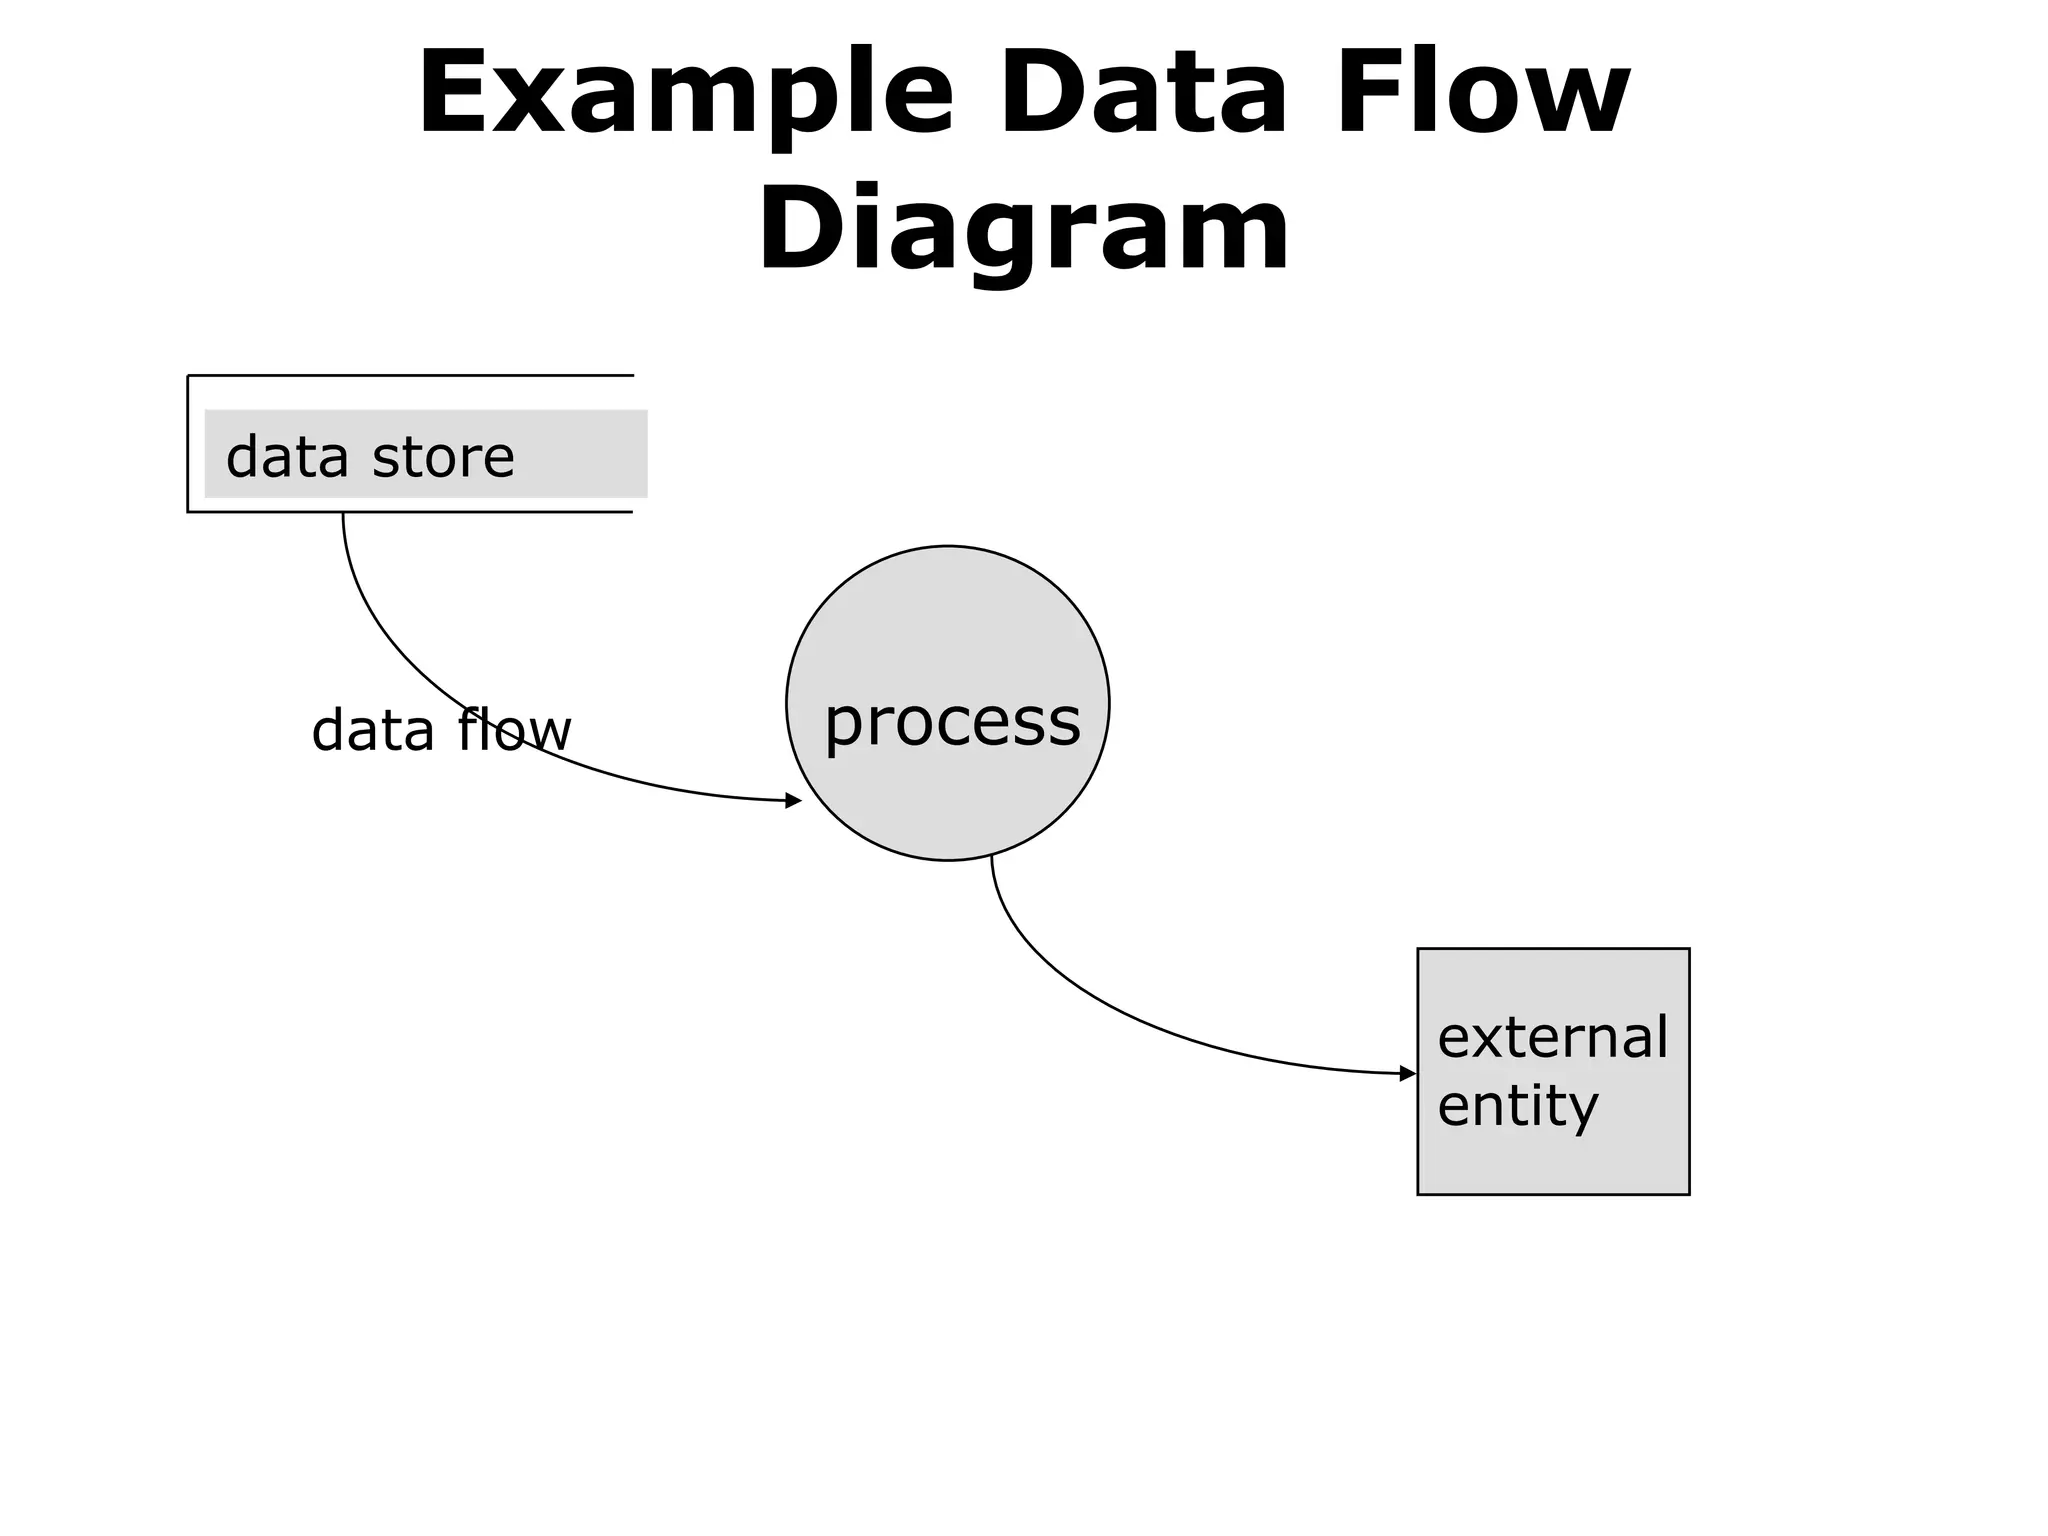
focus on the movement of data between
external entities and processes, and
between processes and data stores
Data Flow Diagramsare:
• Used to perform structured analysis
to determine logical requirements
• A graphical tool, useful for
communicating with users,
managers, and other IS personnel
• Useful for analyzing existing as well
as proposed systems
• A relatively simple technique to learn
and use
6.
Why Conduct Process
Modeling?
•Understand components of
current logical or physical
system for purpose of rebuilding
in a different physical
form/technology, possibly with
some changed functionality
• Find inefficiencies in current
system
• Re-engineer current system
7.
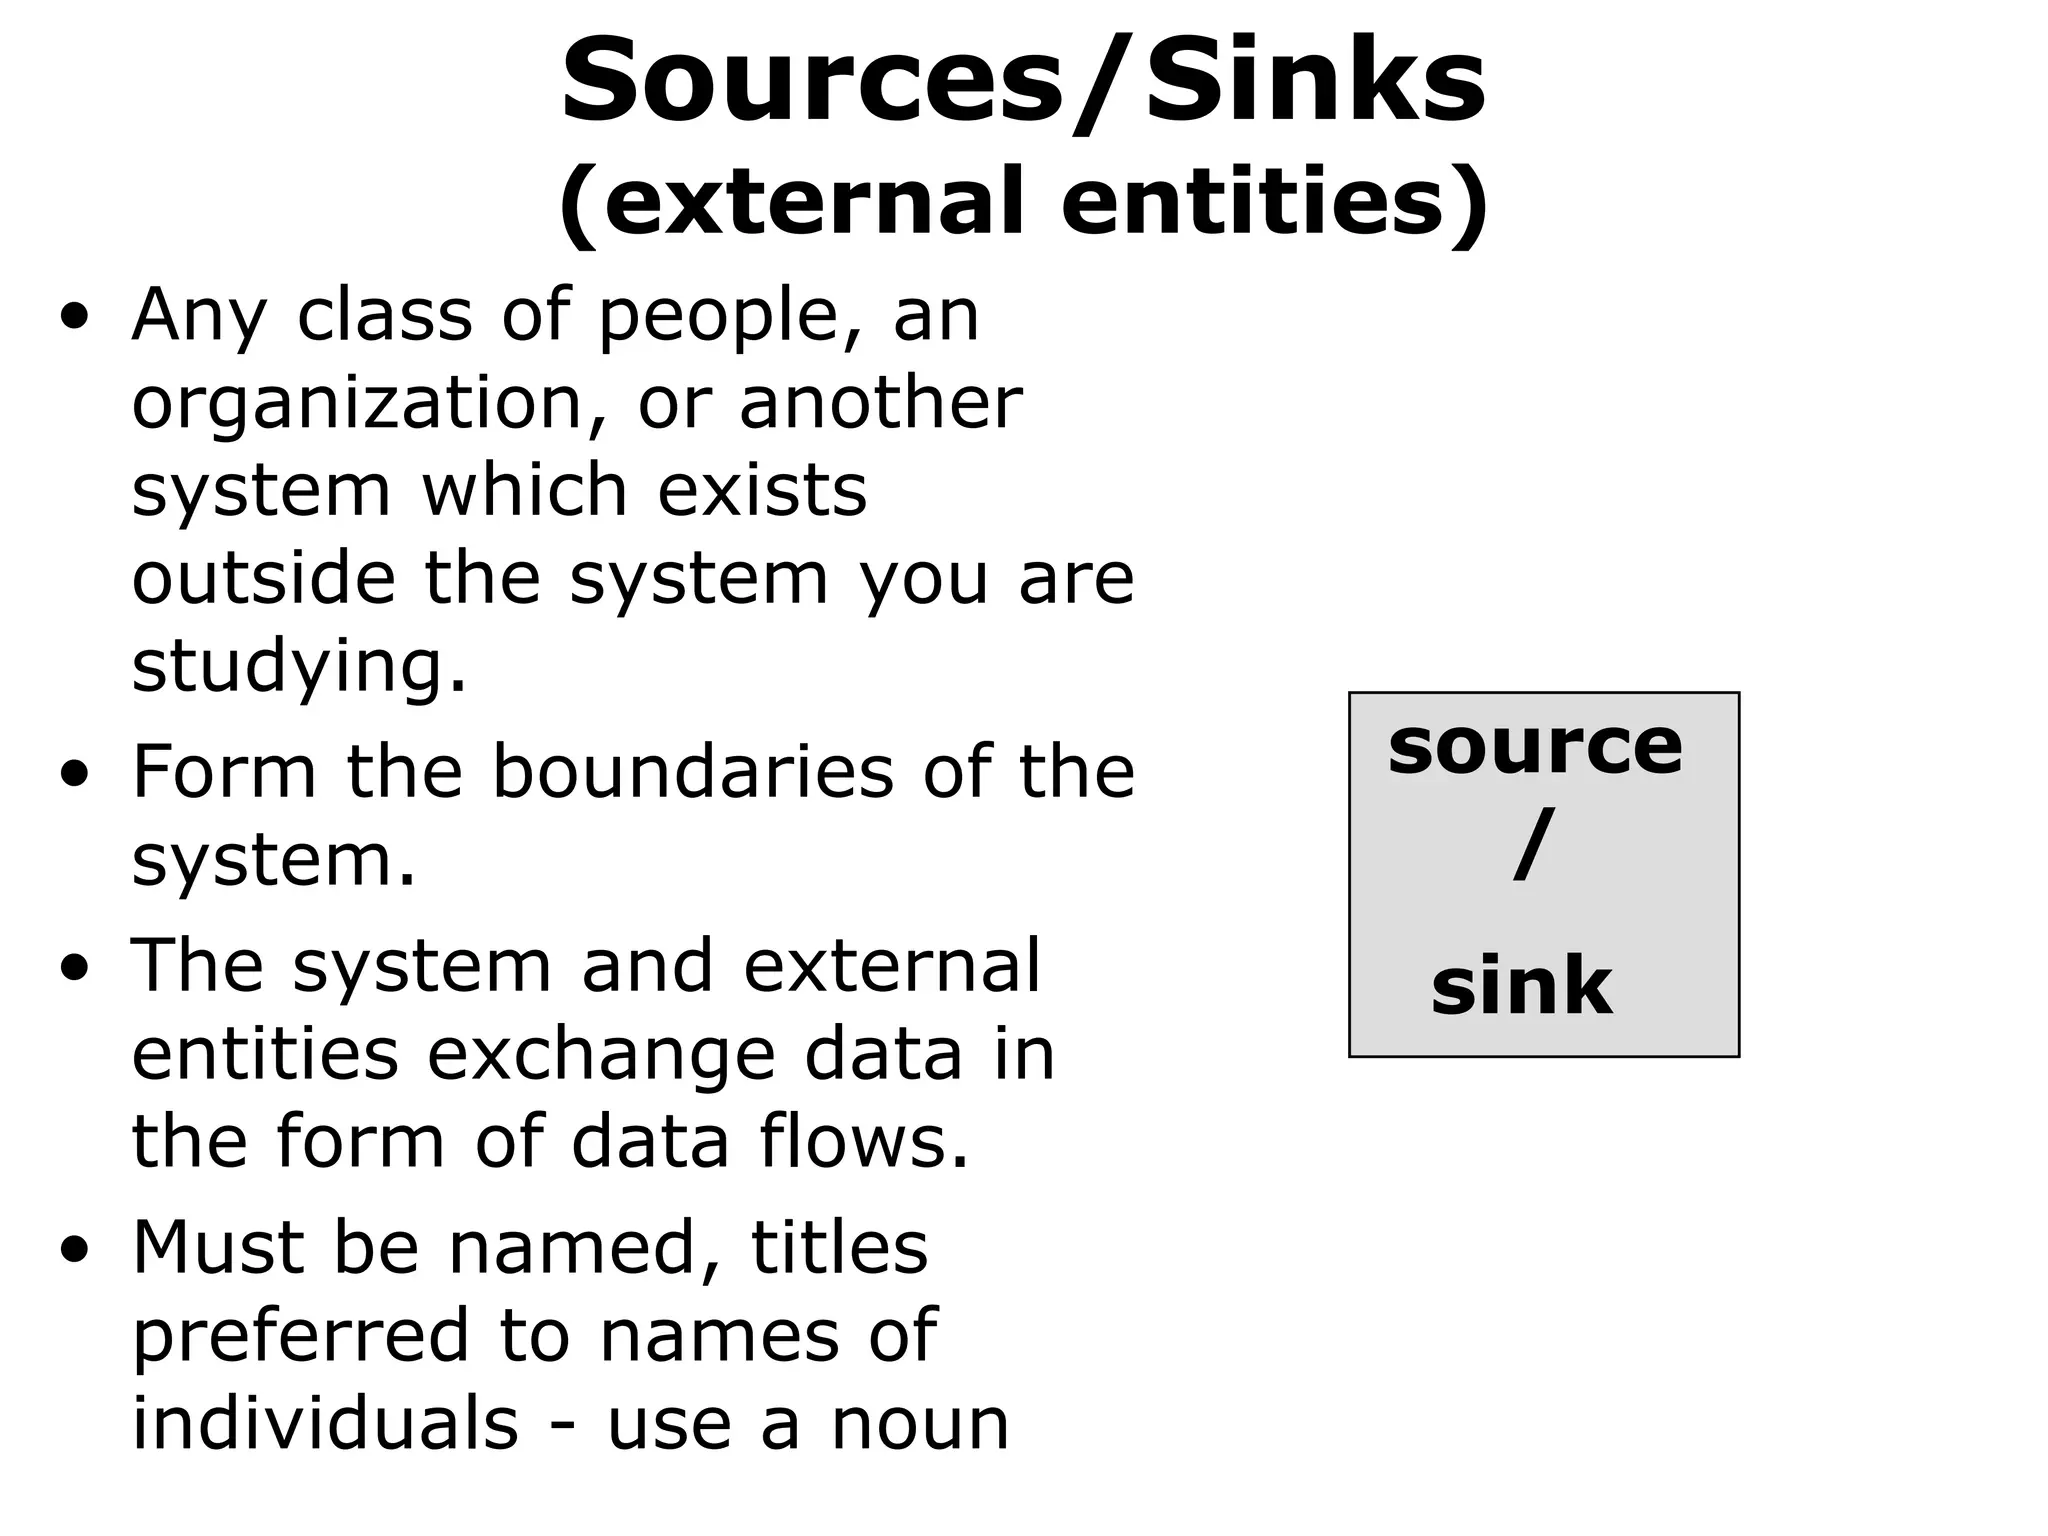
Sources/Sinks
(external entities)
• Anyclass of people, an
organization, or another
system which exists
outside the system you are
studying.
• Form the boundaries of the
system.
• The system and external
entities exchange data in
the form of data flows.
• Must be named, titles
preferred to names of
individuals - use a noun
source
/
sink
8.
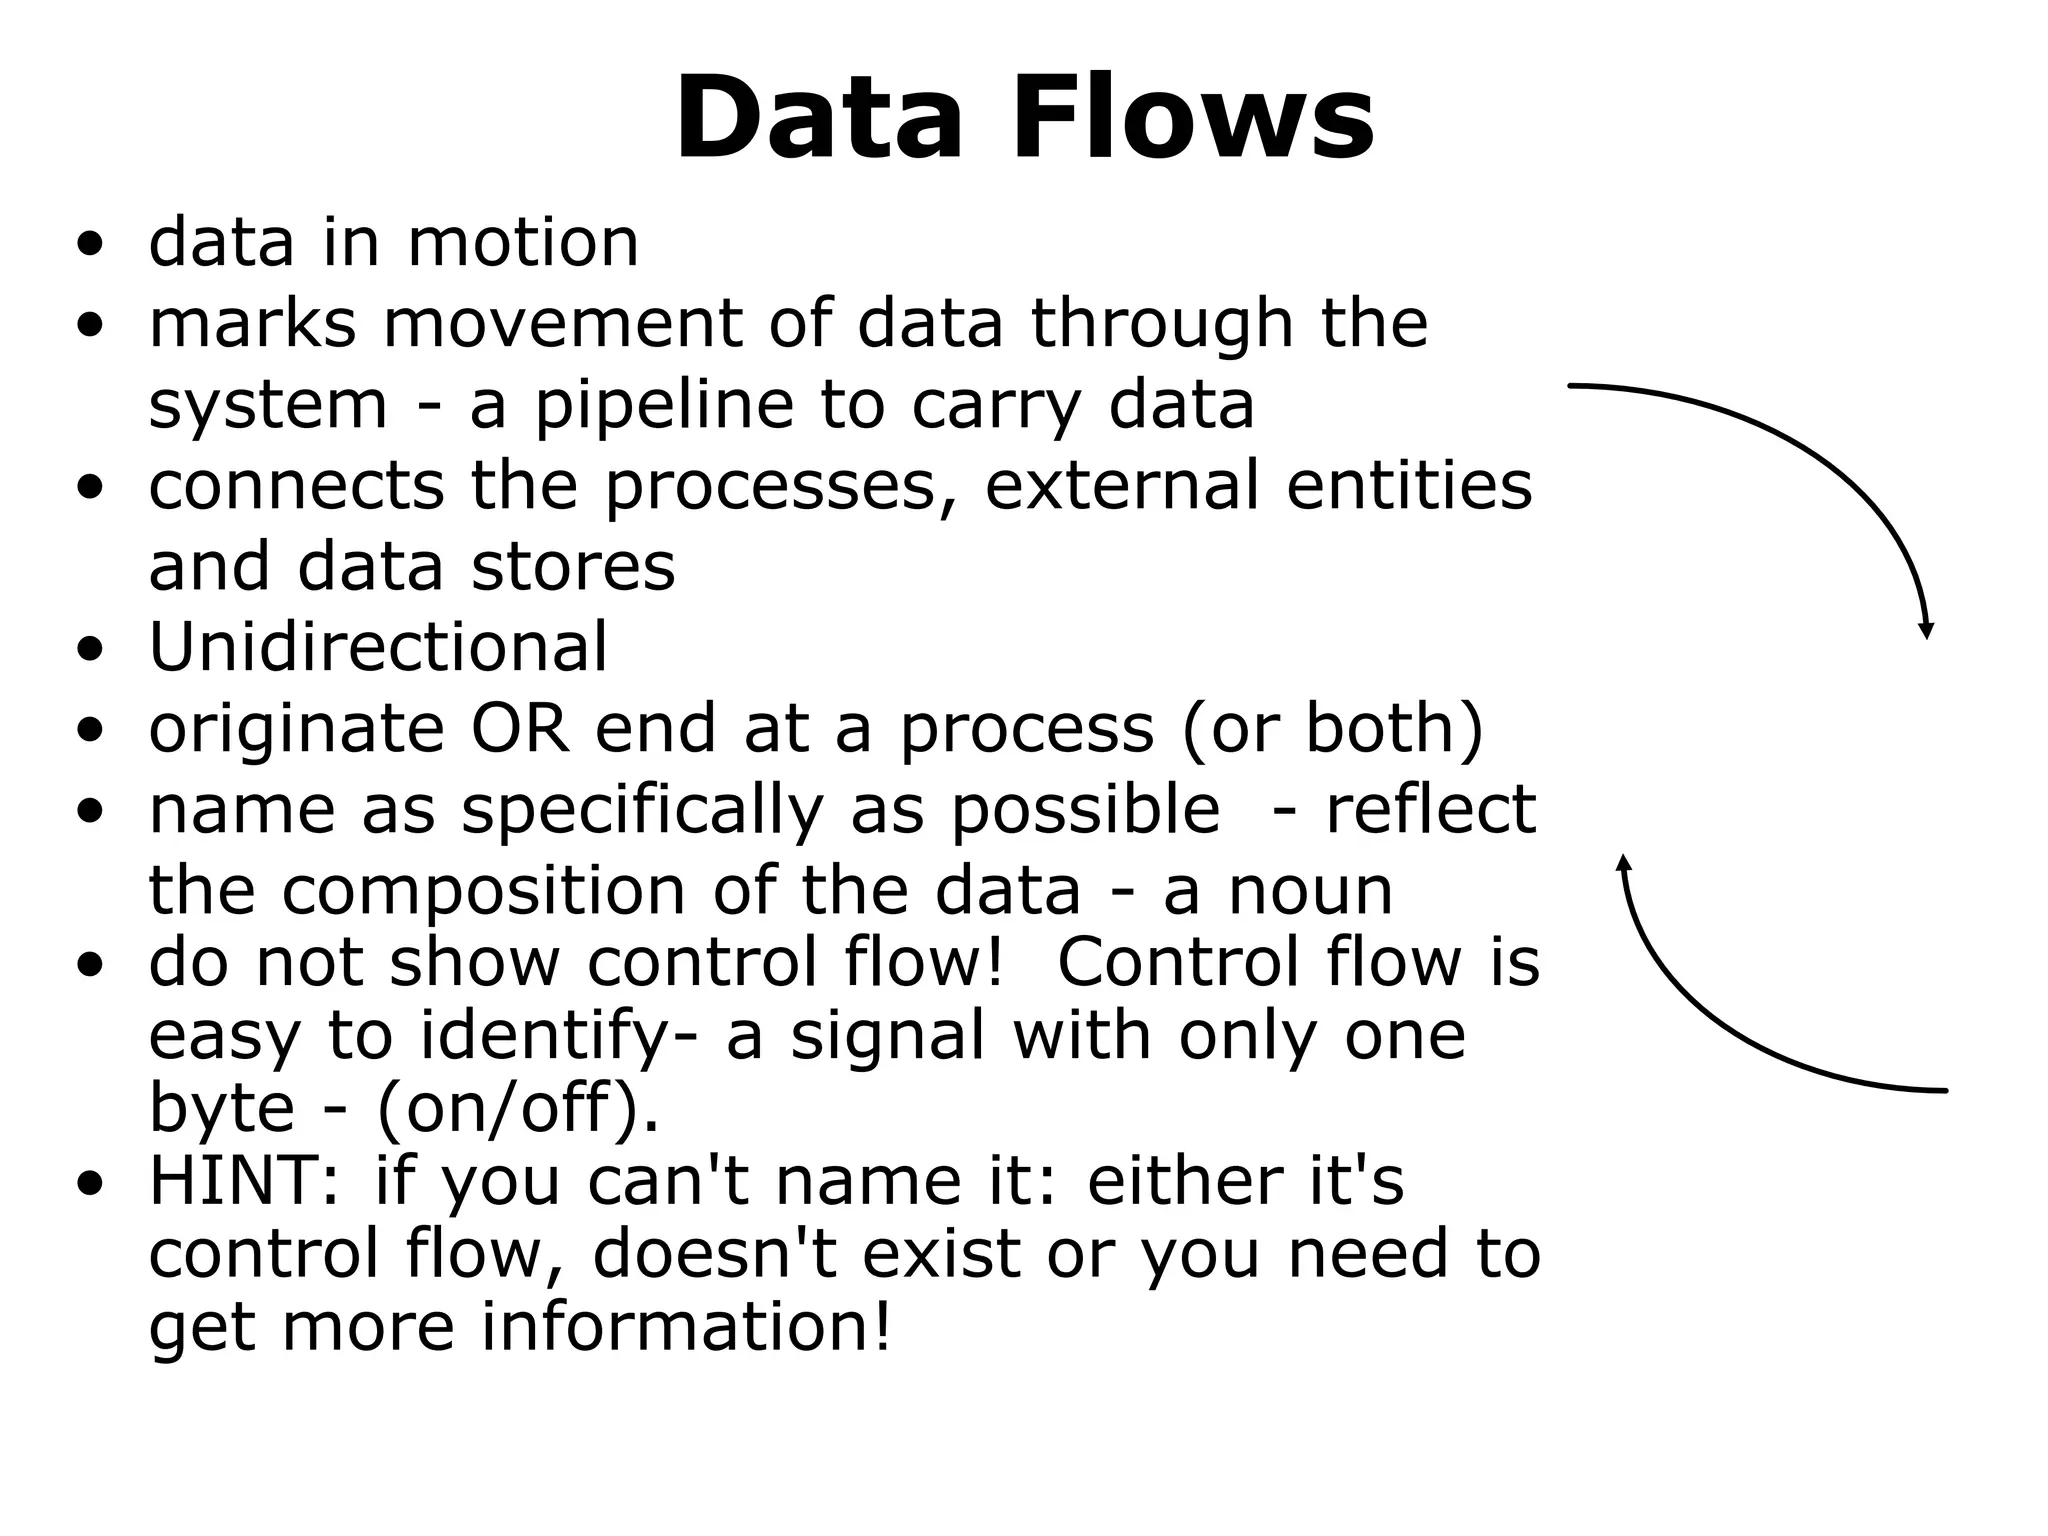
Data Flows
• datain motion
• marks movement of data through the
system - a pipeline to carry data
• connects the processes, external entities
and data stores
• Unidirectional
• originate OR end at a process (or both)
• name as specifically as possible - reflect
the composition of the data - a noun
• do not show control flow! Control flow is
easy to identify- a signal with only one
byte - (on/off).
• HINT: if you can't name it: either it's
control flow, doesn't exist or you need to
get more information!
9.
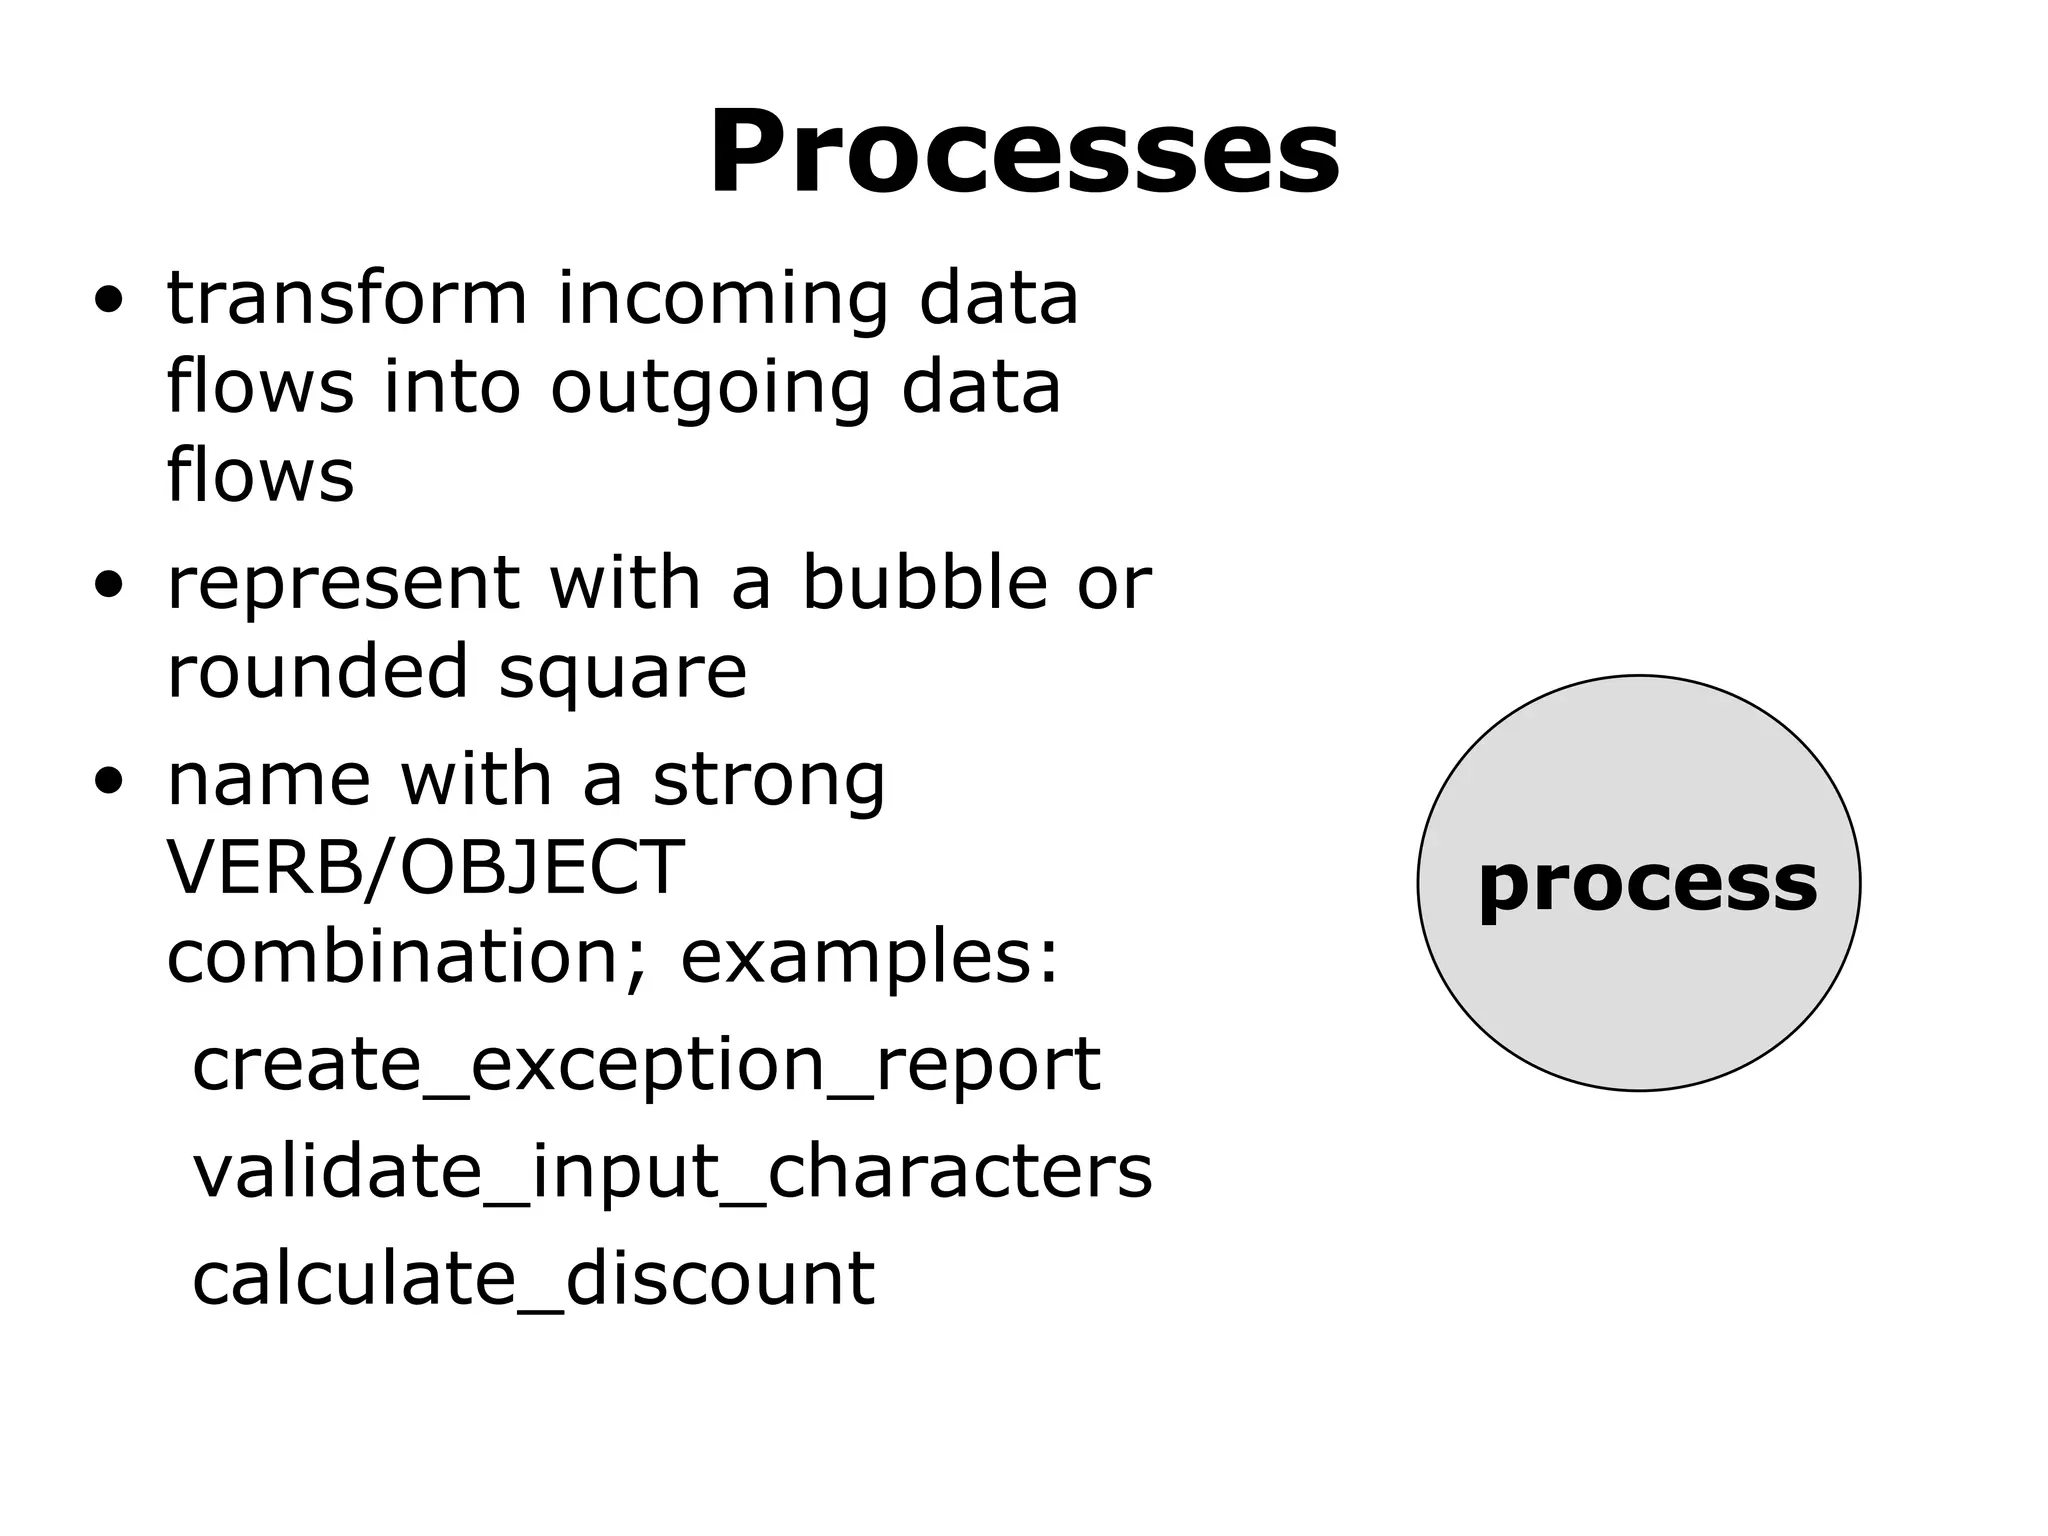
Processes
• transform incomingdata
flows into outgoing data
flows
• represent with a bubble or
rounded square
• name with a strong
VERB/OBJECT
combination; examples:
create_exception_report
validate_input_characters
calculate_discount
process
10.
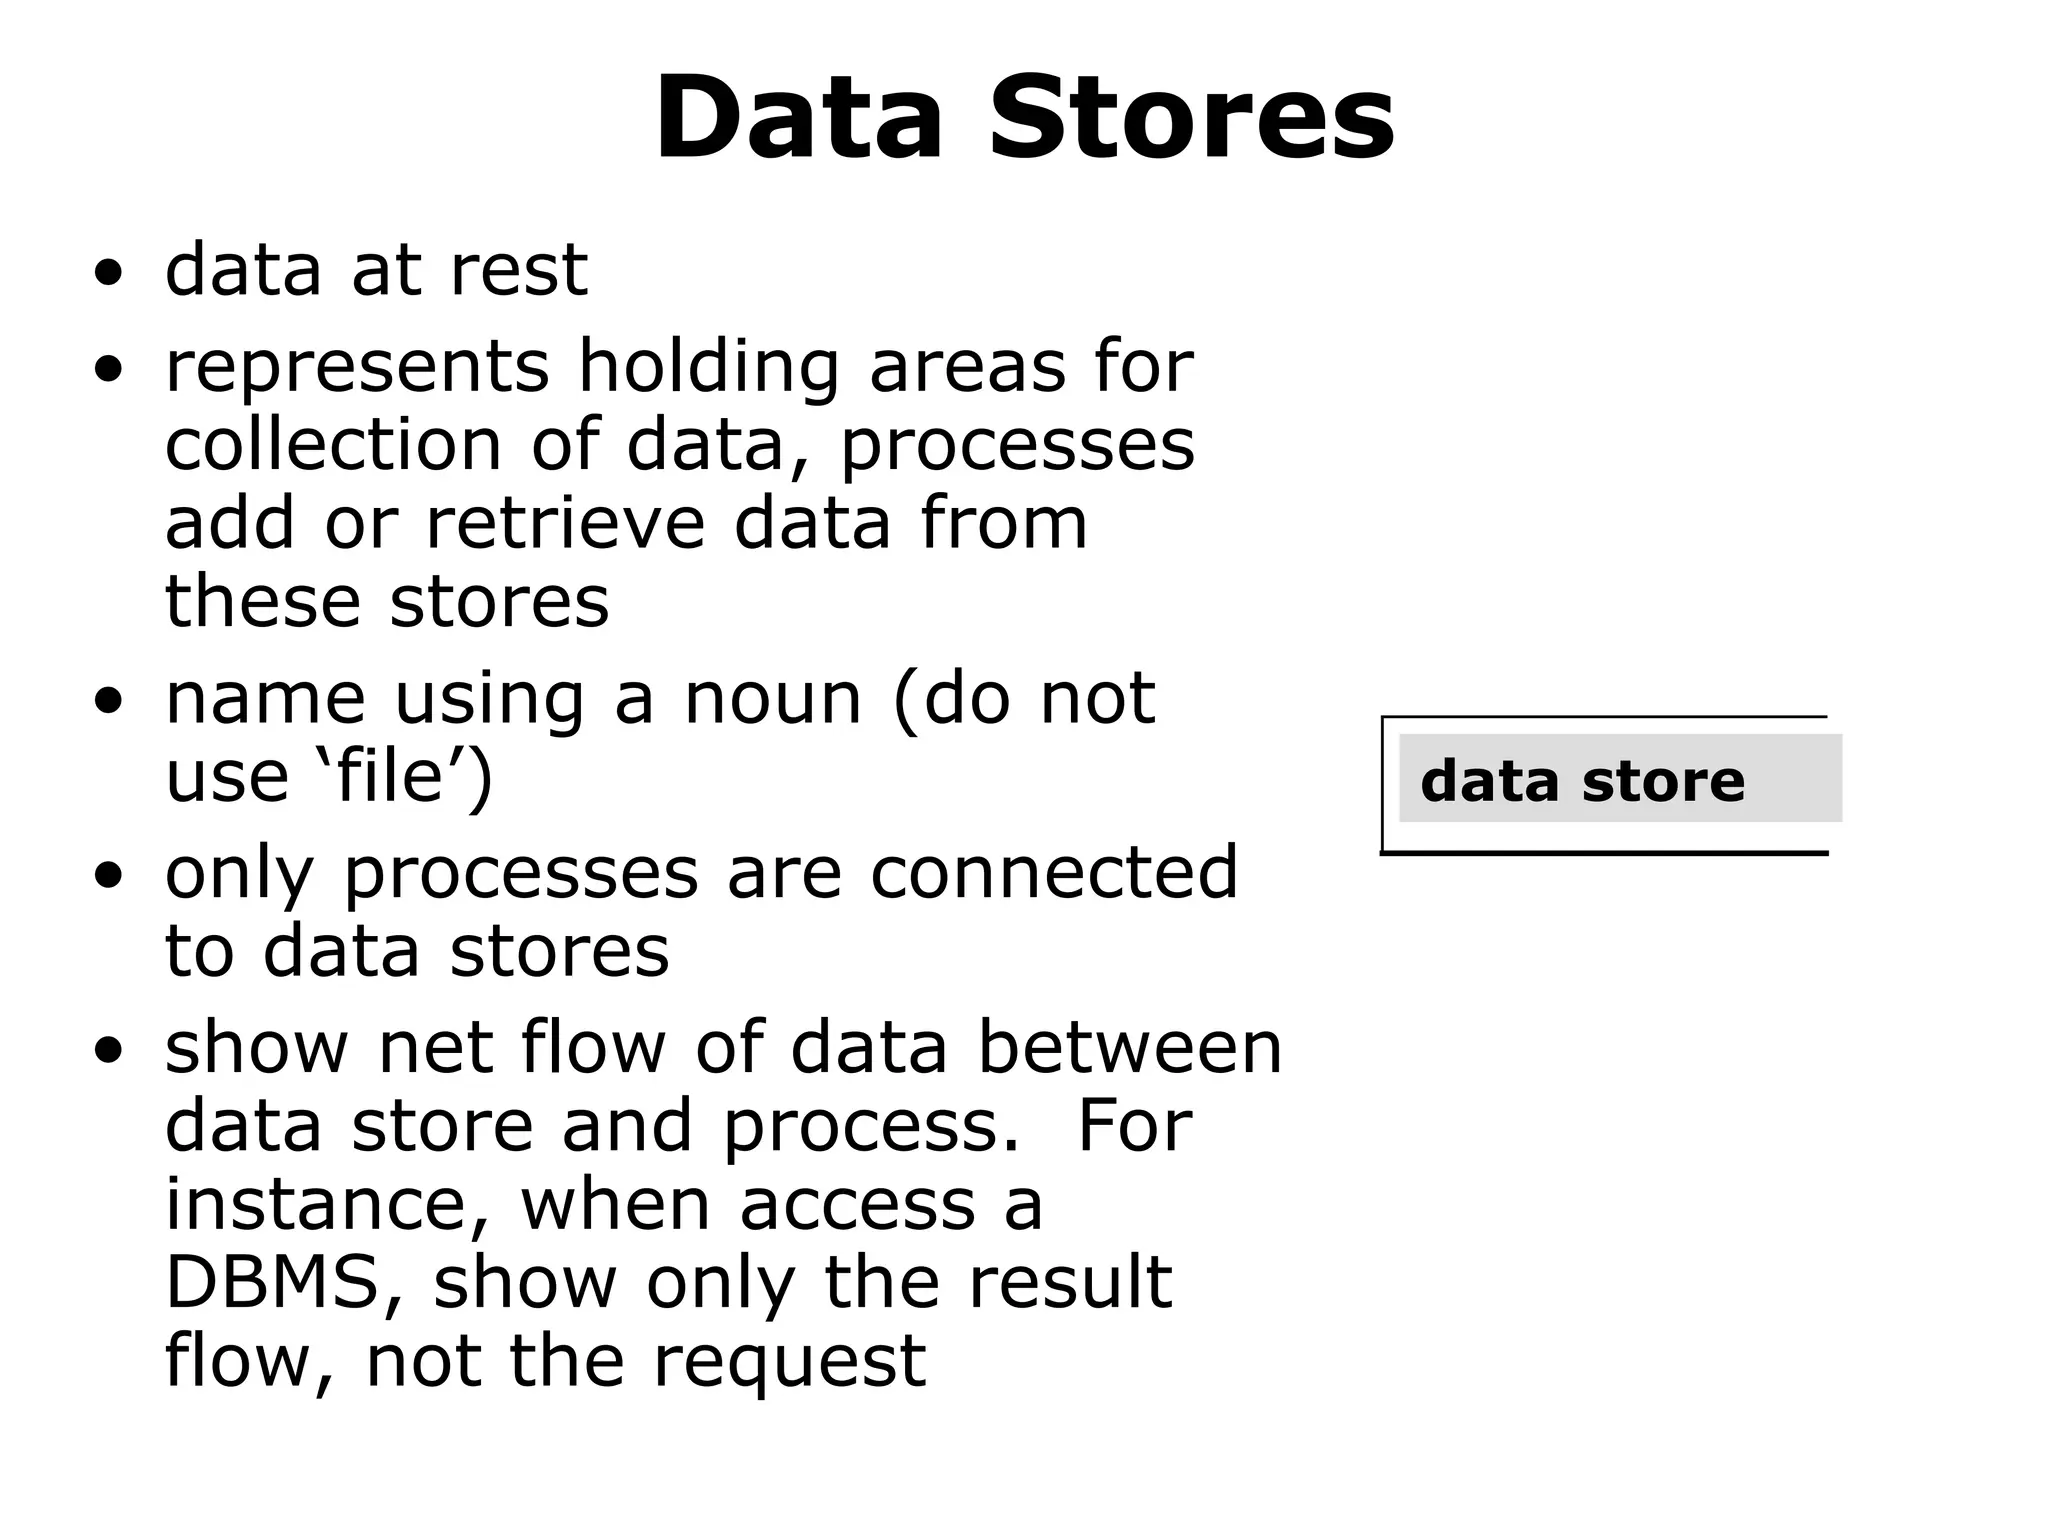
Data Stores
• dataat rest
• represents holding areas for
collection of data, processes
add or retrieve data from
these stores
• name using a noun (do not
use ‘file’)
• only processes are connected
to data stores
• show net flow of data between
data store and process. For
instance, when access a
DBMS, show only the result
flow, not the request
data store
11.
Data Flow DiagramDon’ts
1. BLACK HOLES
2. MIRACLES
3. Let it get too COMPLEX: 7 ± 2 processes
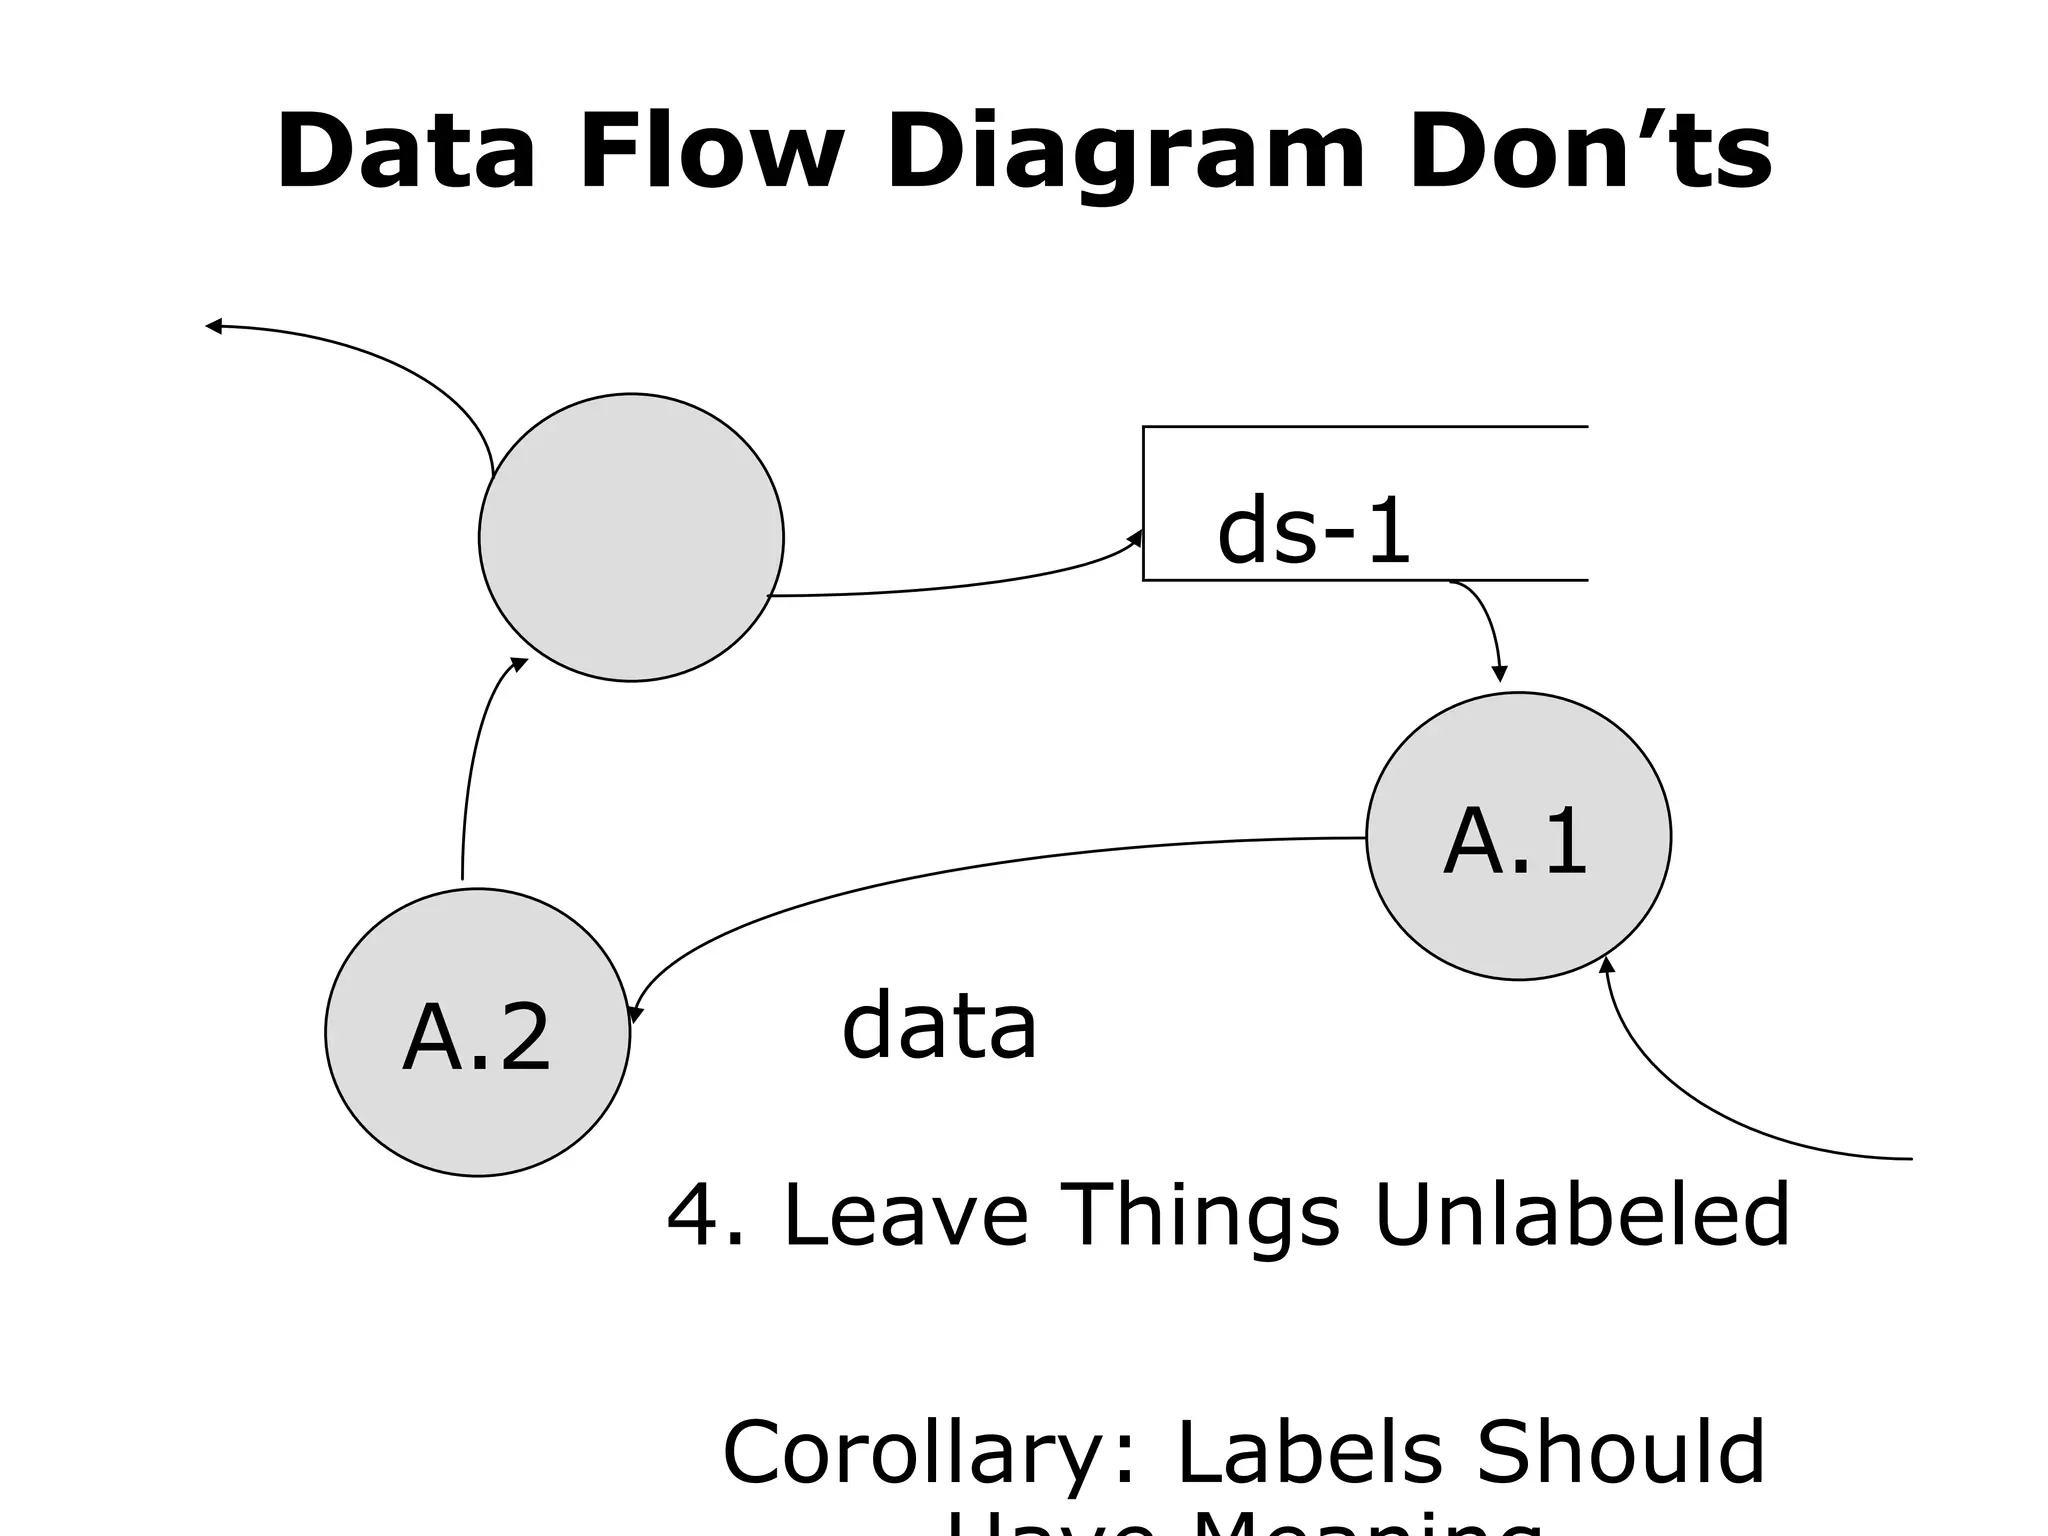
4. Leave things UNLABELED
(corollary: labels should have meaning)
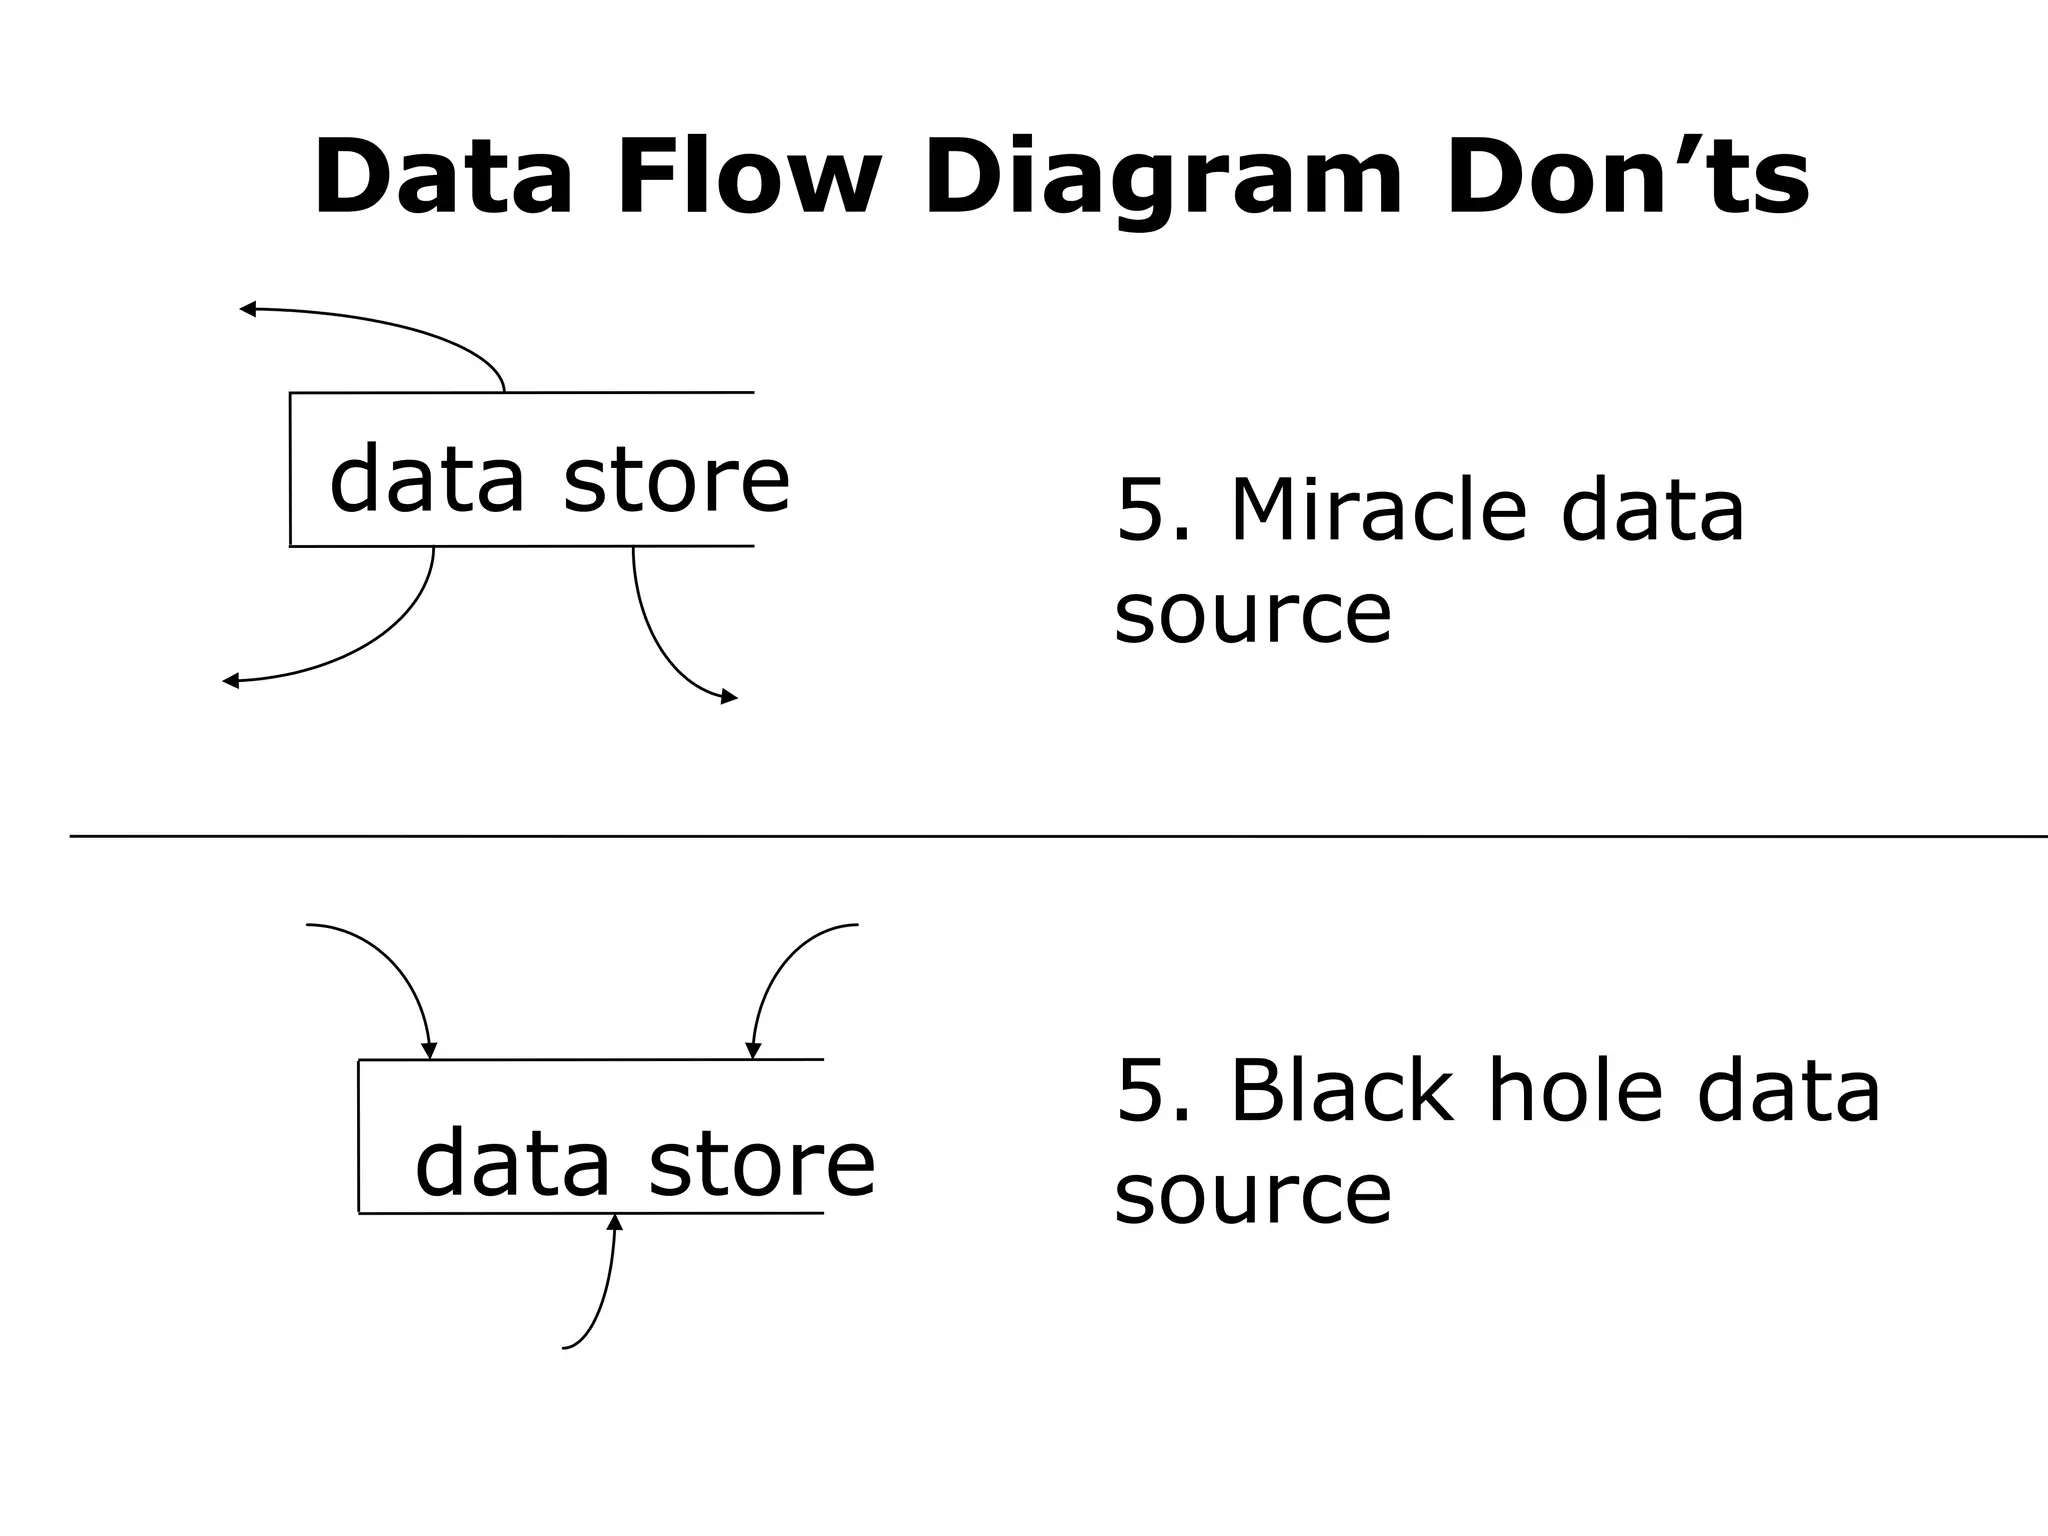
5. Data stores that are “SOURCES” or
“SINKS”
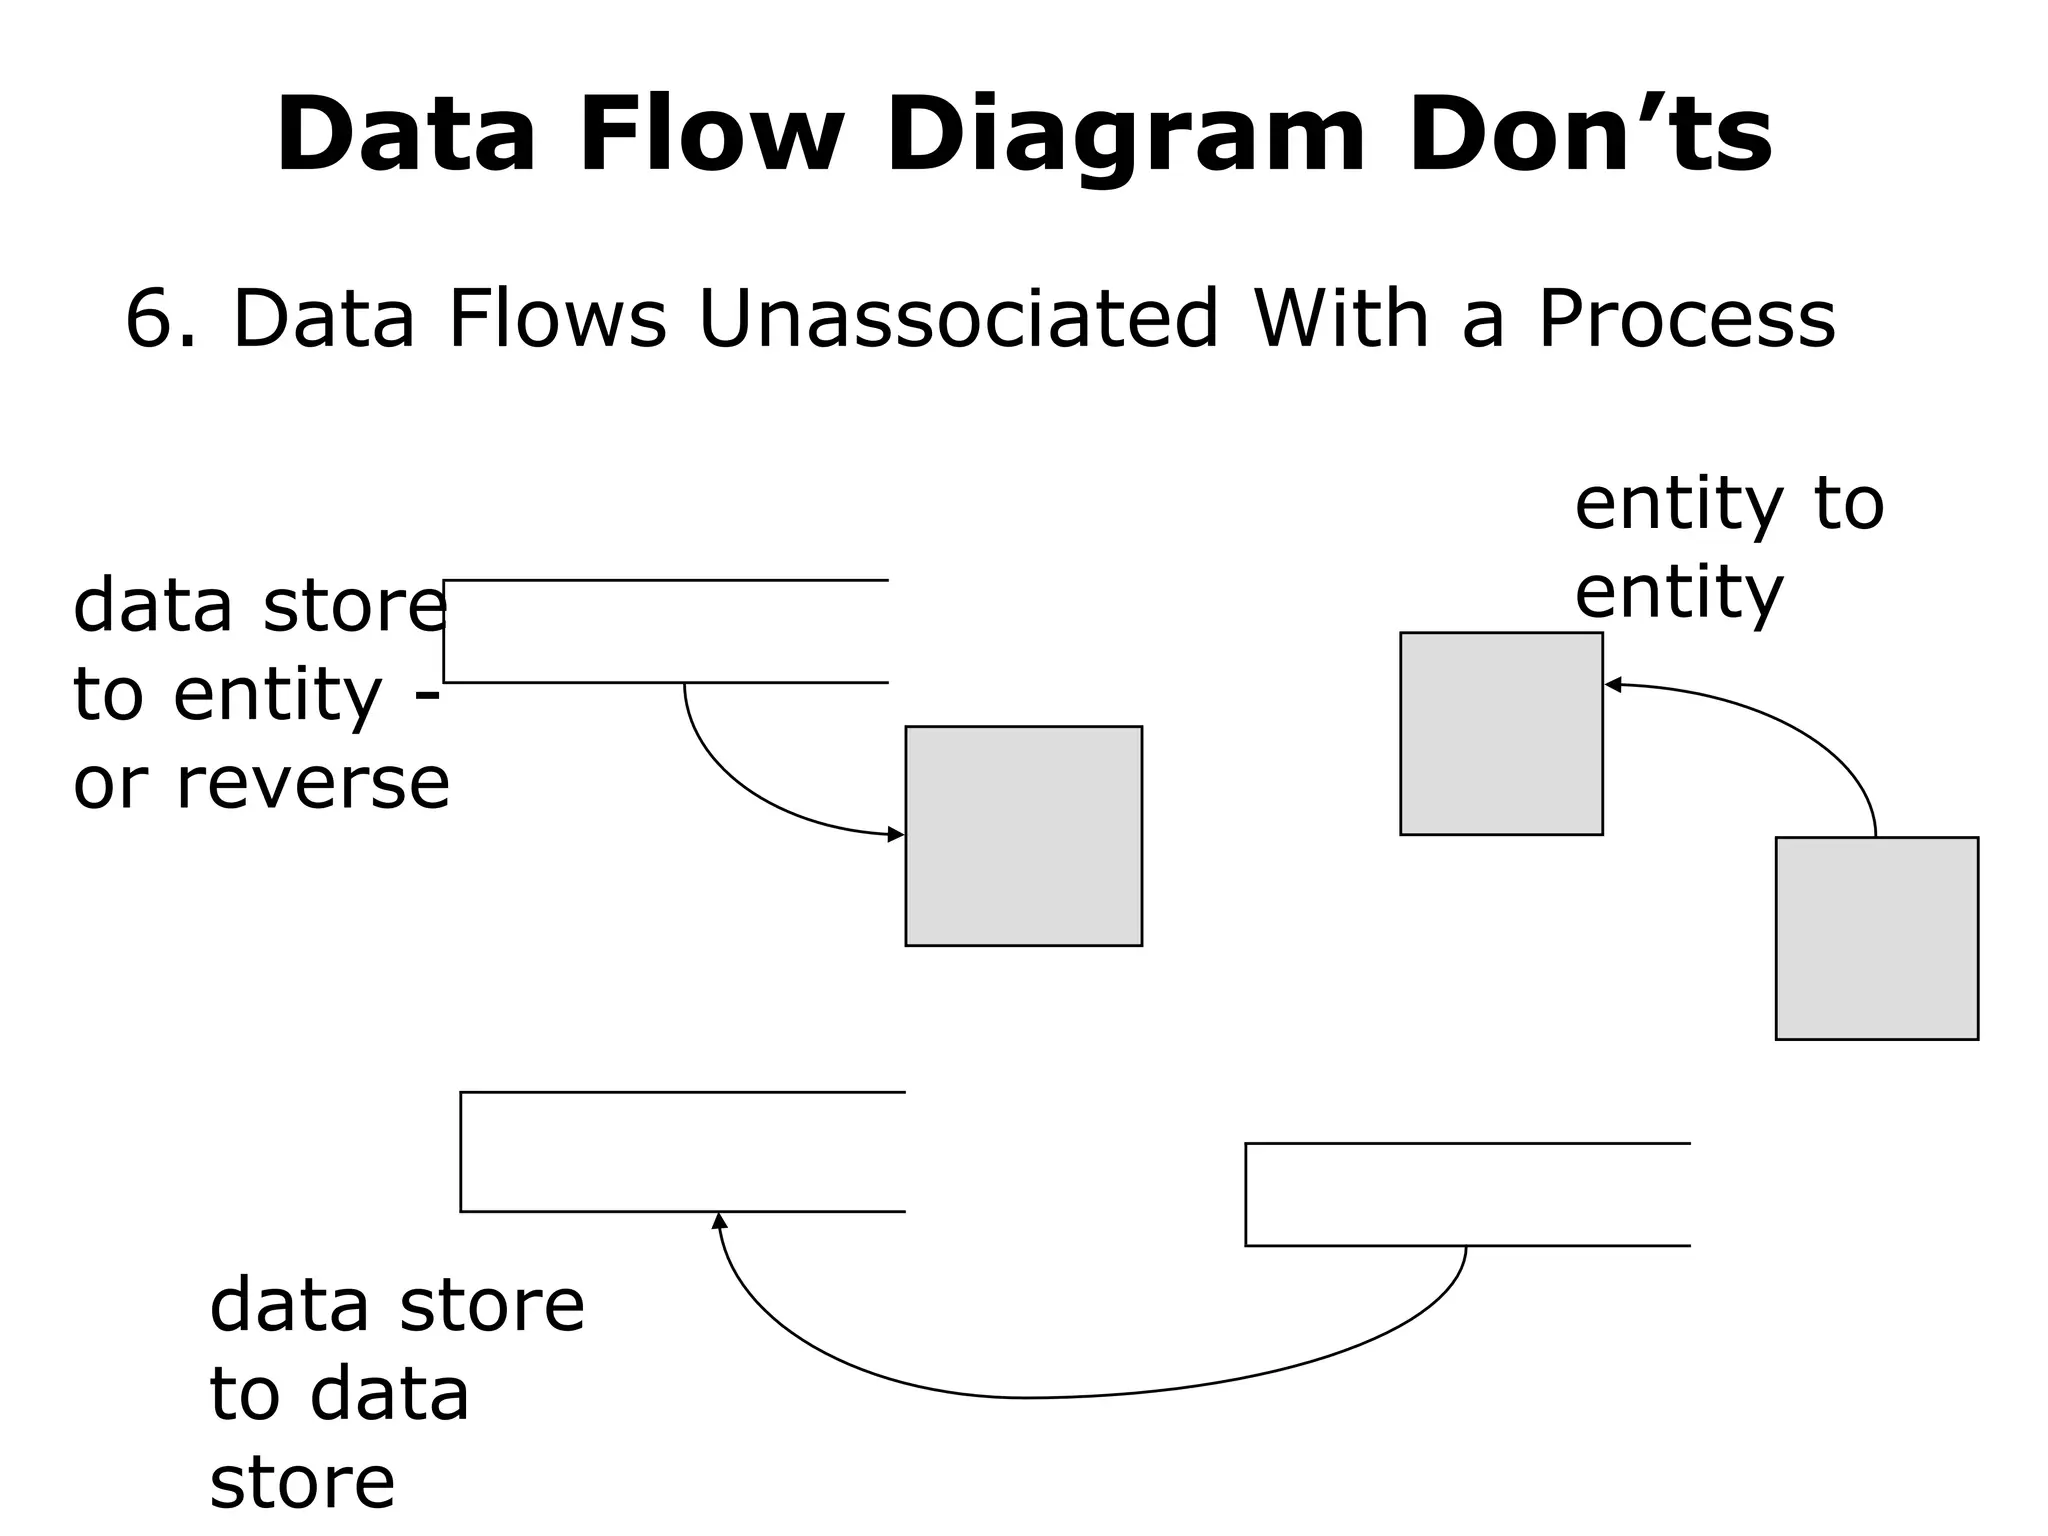
6. Data flows that are UNASSOCIATED with
a PROCESS
7. Expect your diagram to be “perfect” the
first time!
12.
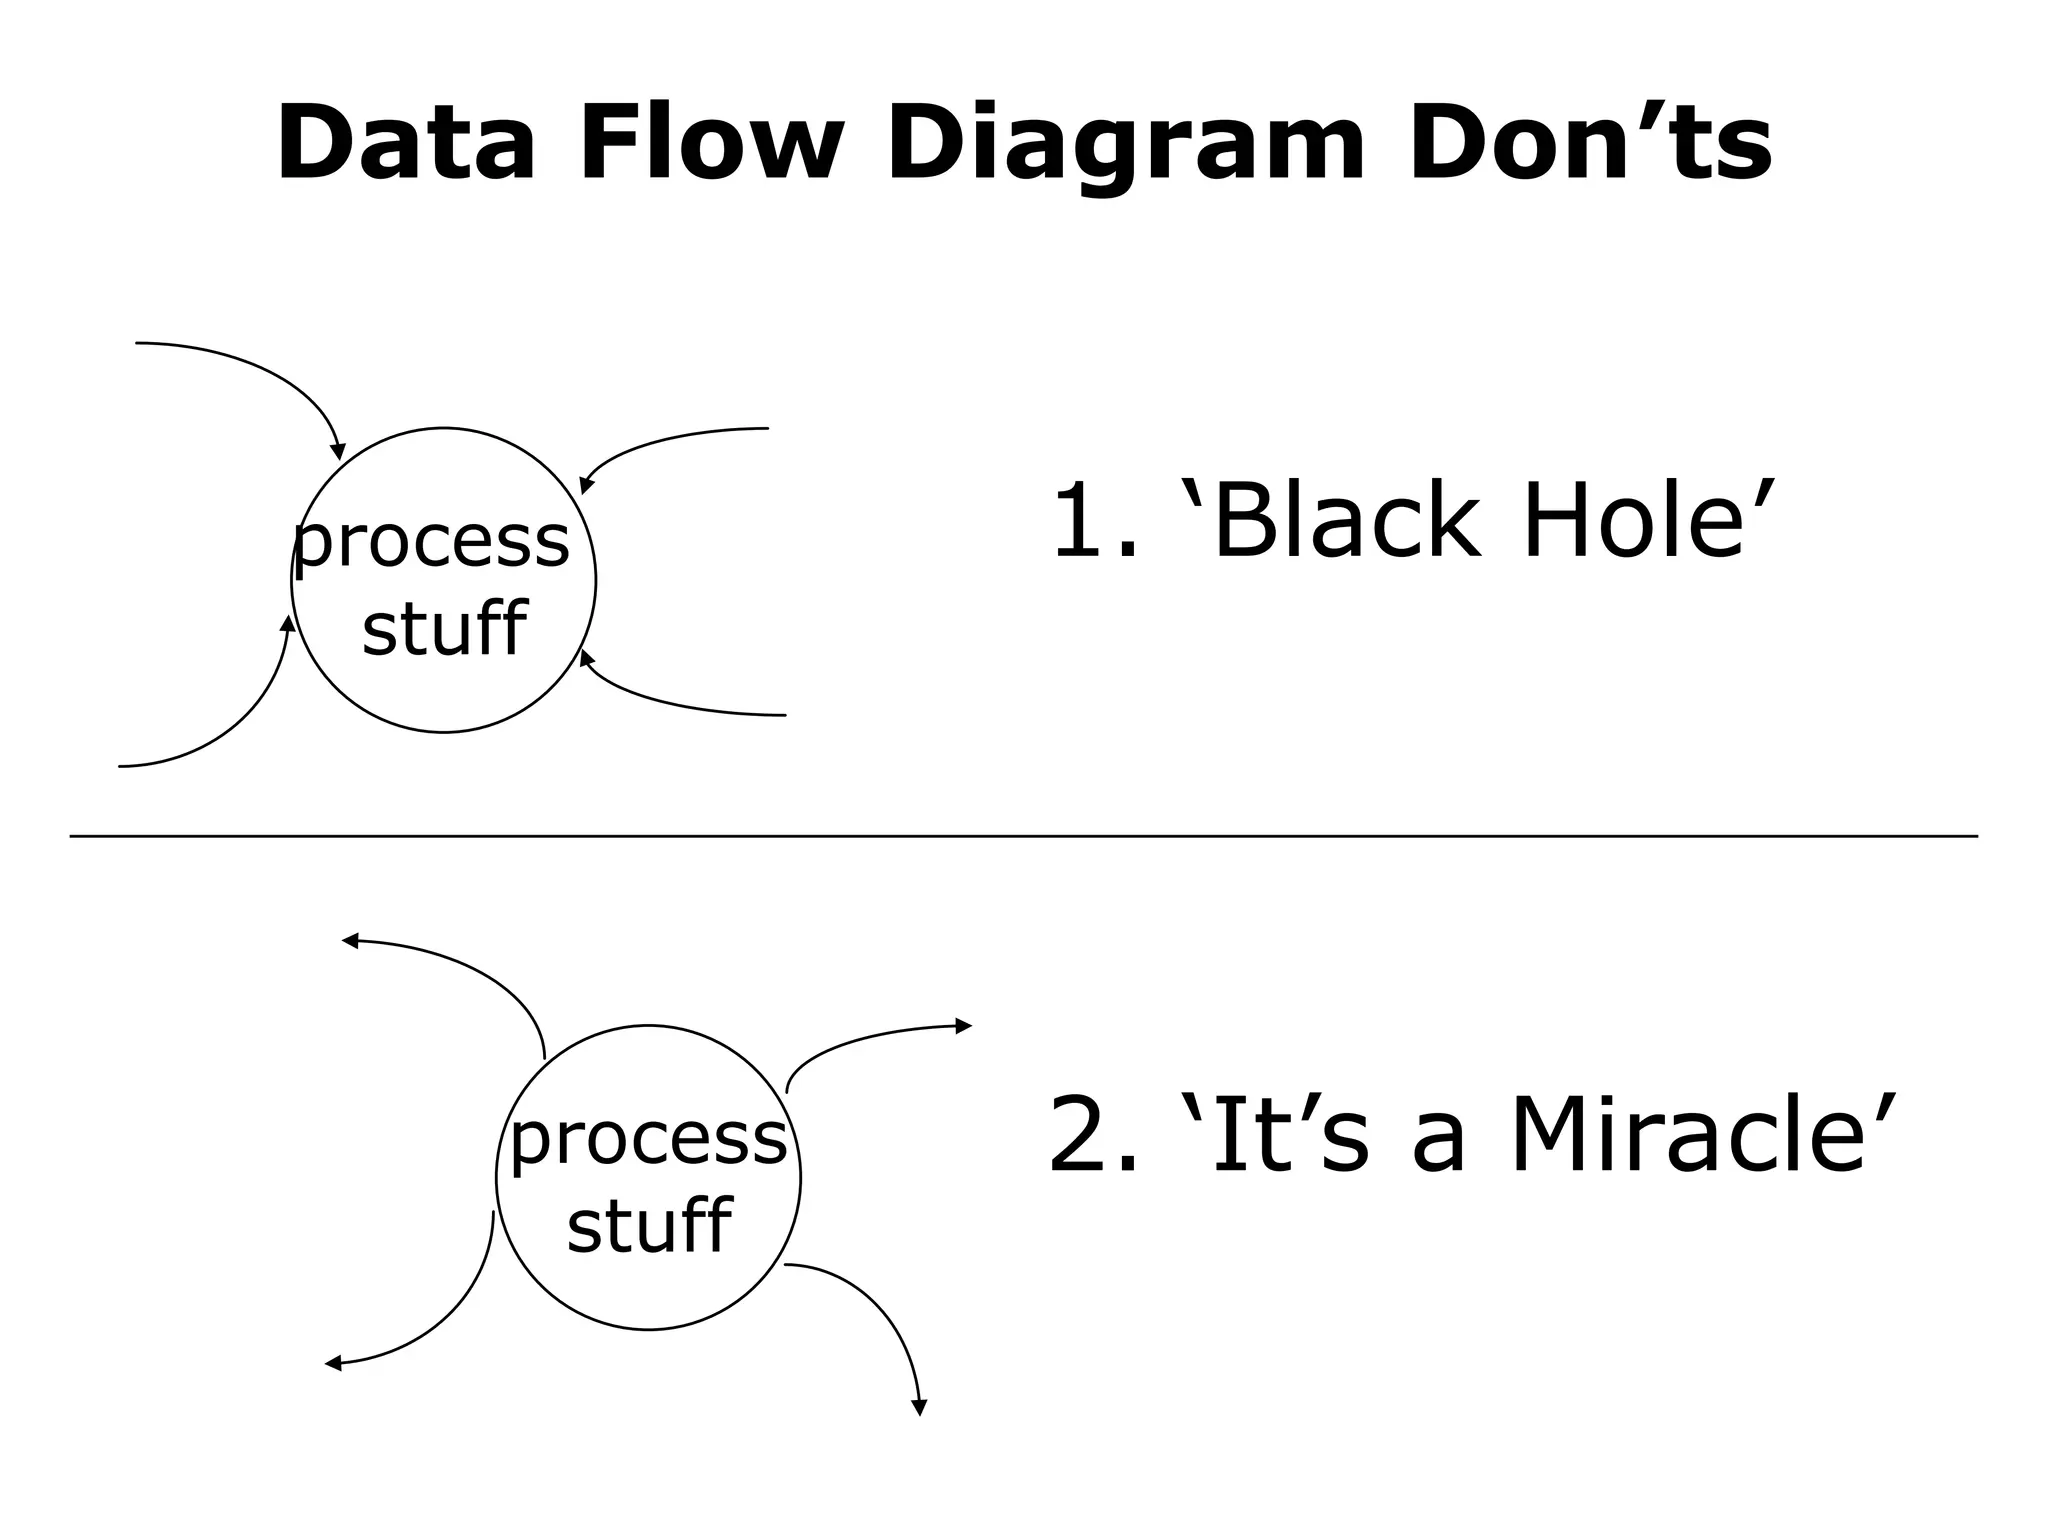
Data Flow DiagramDon’ts
process
stuff
1. ‘Black Hole’
process
stuff
2. ‘It’s a Miracle’
13.
Data Flow DiagramDon’ts
A.2
A.1
ds-1
data
4. Leave Things Unlabeled
Corollary: Labels Should
14.
Data Flow DiagramDon’ts
data store 5. Miracle data
source
data store
5. Black hole data
source
15.
Data Flow DiagramDon’ts
6. Data Flows Unassociated With a Process
entity to
entity
data store
to entity -
or reverse
data store
to data
store
16.
Diagramming A System
•multiple DFDs are required to
represent a system
• DFDs are created at increasing
levels of detail
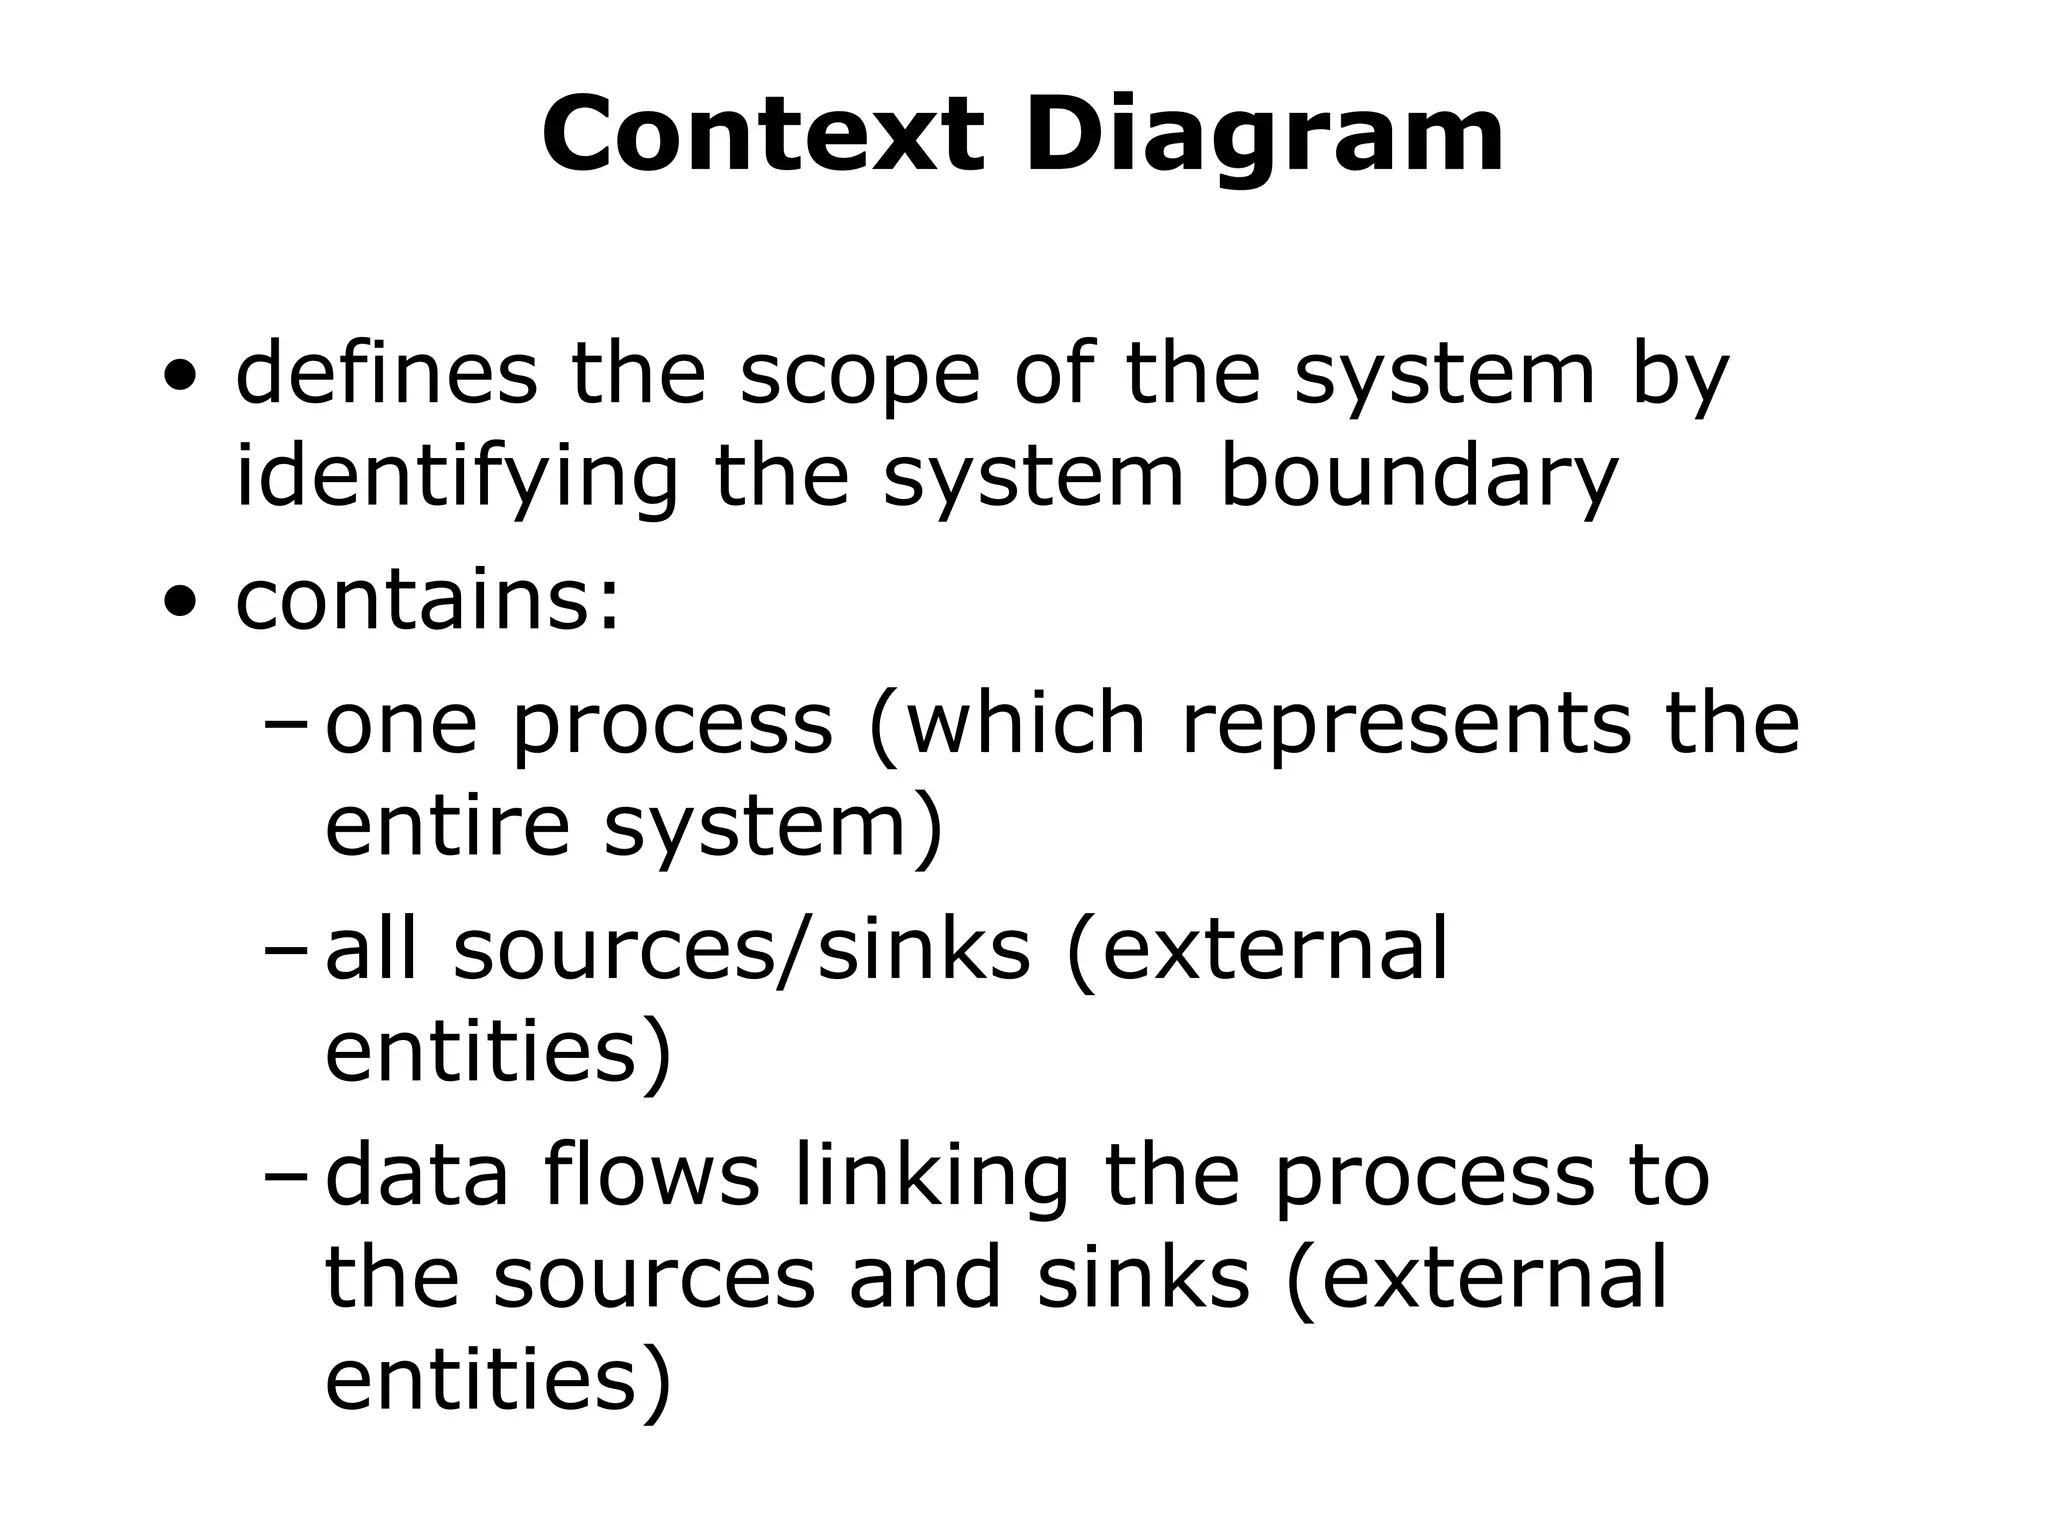
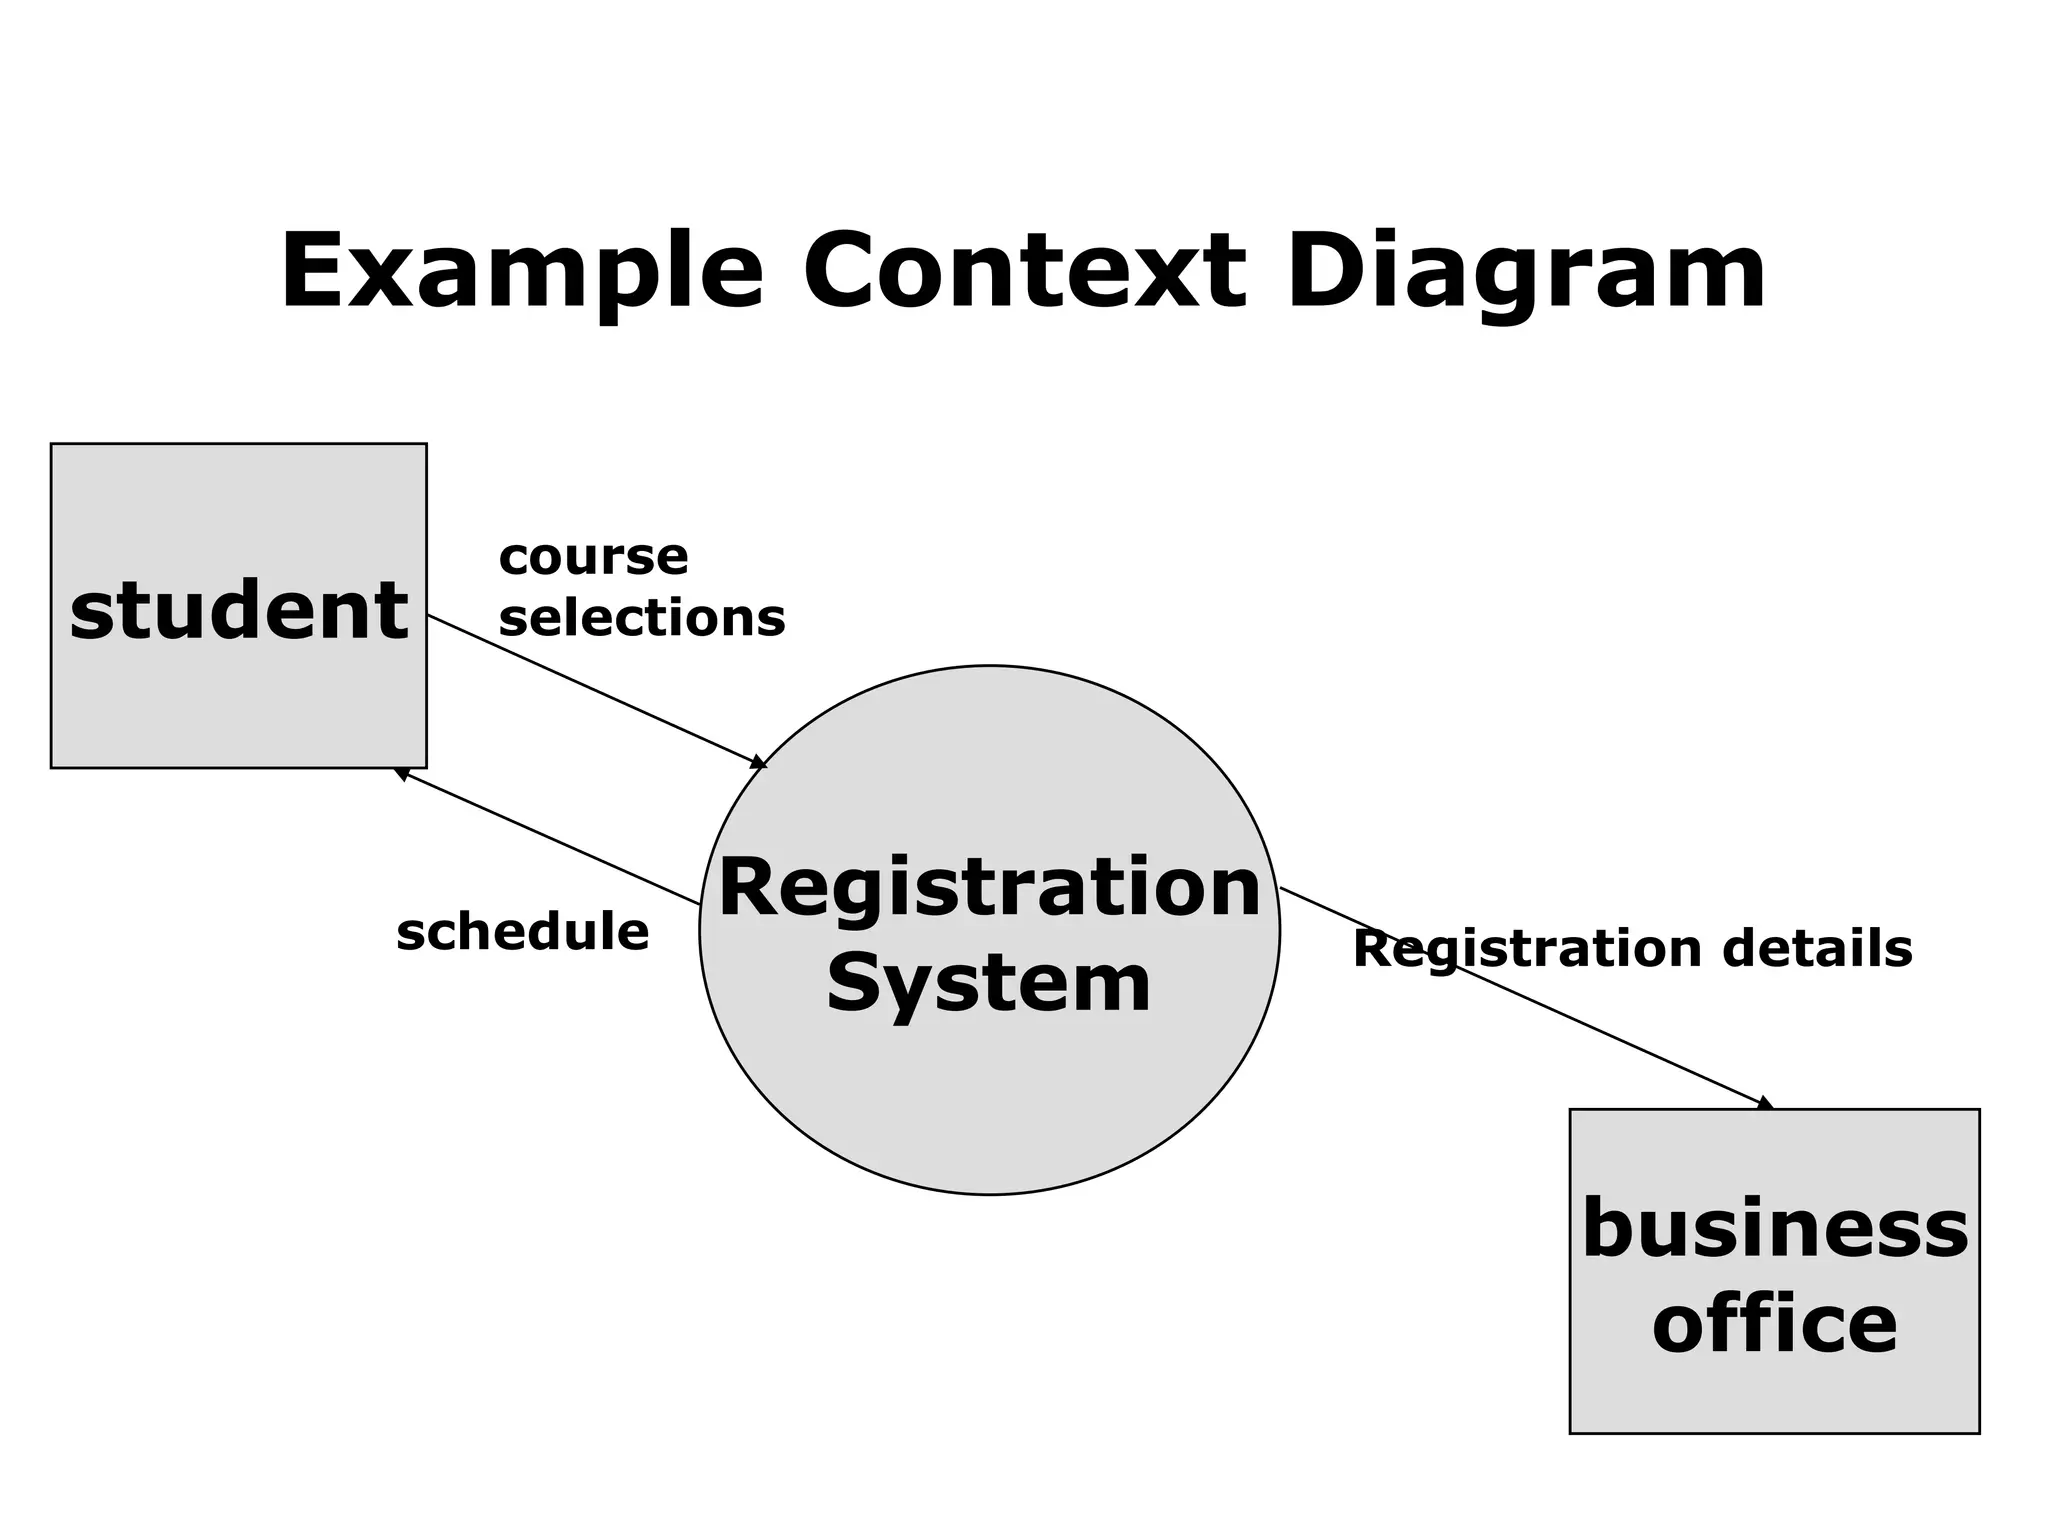
Context Diagram
• definesthe scope of the system by
identifying the system boundary
• contains:
–one process (which represents the
entire system)
–all sources/sinks (external
entities)
–data flows linking the process to
the sources and sinks (external
entities)
Constructing a Context
Diagram
•identify and list sources/sinks
(external entities)
• identify and list inputs to and
outputs from sources/sinks
(external entities)
• create context diagram
21.
Level-0 Diagram
• describesthe overall processing of the
system
• show one process for each major
processing step or functional
requirement
• data flows from the context appear on
system diagram also (level balancing)
• can show a single data store to represent
all data in aggregate at this level
• can draw duplicate sources, sinks and
data stores to increase legibility
22.
Drawing a Level-0Diagram
• list the major data stores
• list major business steps
• draw a segment for each business
step
• assemble into single DFD
• re-organize until satisfied
• number processes
23.
Functional Decomposition
• similarto a series of more detailed maps
• iterative process of breaking the
description of a system into finer and
finer detail to create a set of charts in
which one process on a given chart is
explained in greater detail on another
chart
• referred to as exploding, partitioning, or
leveling
• must use your judgment to decide what
goes on each level
• show error and exception handling on
lower levels (if at all)
24.
Lower Level Diagrams
•explode the processes shown on the
level-0 diagram
• each process is represented by its own
DFD
• balance data
– data flows on upper level appear on lower
level, or
– data flows on upper level are broken into
component pieces with components
shown on lower level
• each lower level shows greater and
greater detail
• follow numbering convention
25.
Balancing DFDs
• conservedata from level to level -
inputs and outputs on the higher
level must appears somewhere on
the lower level
26.
Advanced Rules
• Compositedata flow on one level can be
split into its component data flows on the
next level - but new data cannot be added
and all data in the composite must be
included in the sub-flows
• The inputs to a process must be sufficient
to produce the outputs.
• Lowest level DFDs may add new data
flows to represent exception handling,
i.e., error messages
• May repeat data stores or sources/sink to
avoid crossing lines
27.
Additional Guidelines
• theinputs to a process are different
from the outputs of that process
• objects in a set of DFDs have unique
names
• do not change data flow names on lower
levels unless you are decomposing a
data flow into component pieces.
• never explode a single process into
another single process. If you cannot
partition the process, then the lower
level DFD is not needed.
• expect to iterate, put down the DFD and
go back to it a few times to create
something satisfactory.
28.
Other Questions aboutLower
level diagrams
1. How deep? (how many levels?)
– if the process has only one input or one
output, probably cannot partition further;
– can you describe the process in English in
about 1/2 page?
2. How broad? (how many processes on a
level?)
– 7 ± two is a reasonable heuristic
– may temporarily place much of the system
on a single diagram then re-draw into
separate levels
29.
Quality Guidelines
• Completeness
–all components included & in project
dictionary
• Consistency
– between levels: balancing, leveling
• Timing considerations
– assume system never starts and never stops
• Iterative nature
– revisions are common
• Drawing primitives (lowest level)
– when to stop?
Editor's Notes
#6 The reason we do process modeling is to improve the operation of a system, not just to change its physical form.
Start with understanding
Then analyze for improvements or where to add new functionality
Then specificy re-engineered system
BE SURE TO QUESTION ALL ASSUMPTIONS, ESPECIALLY THOSE WHICH ARE IMPLICIT IN CURRENT SYSTEM
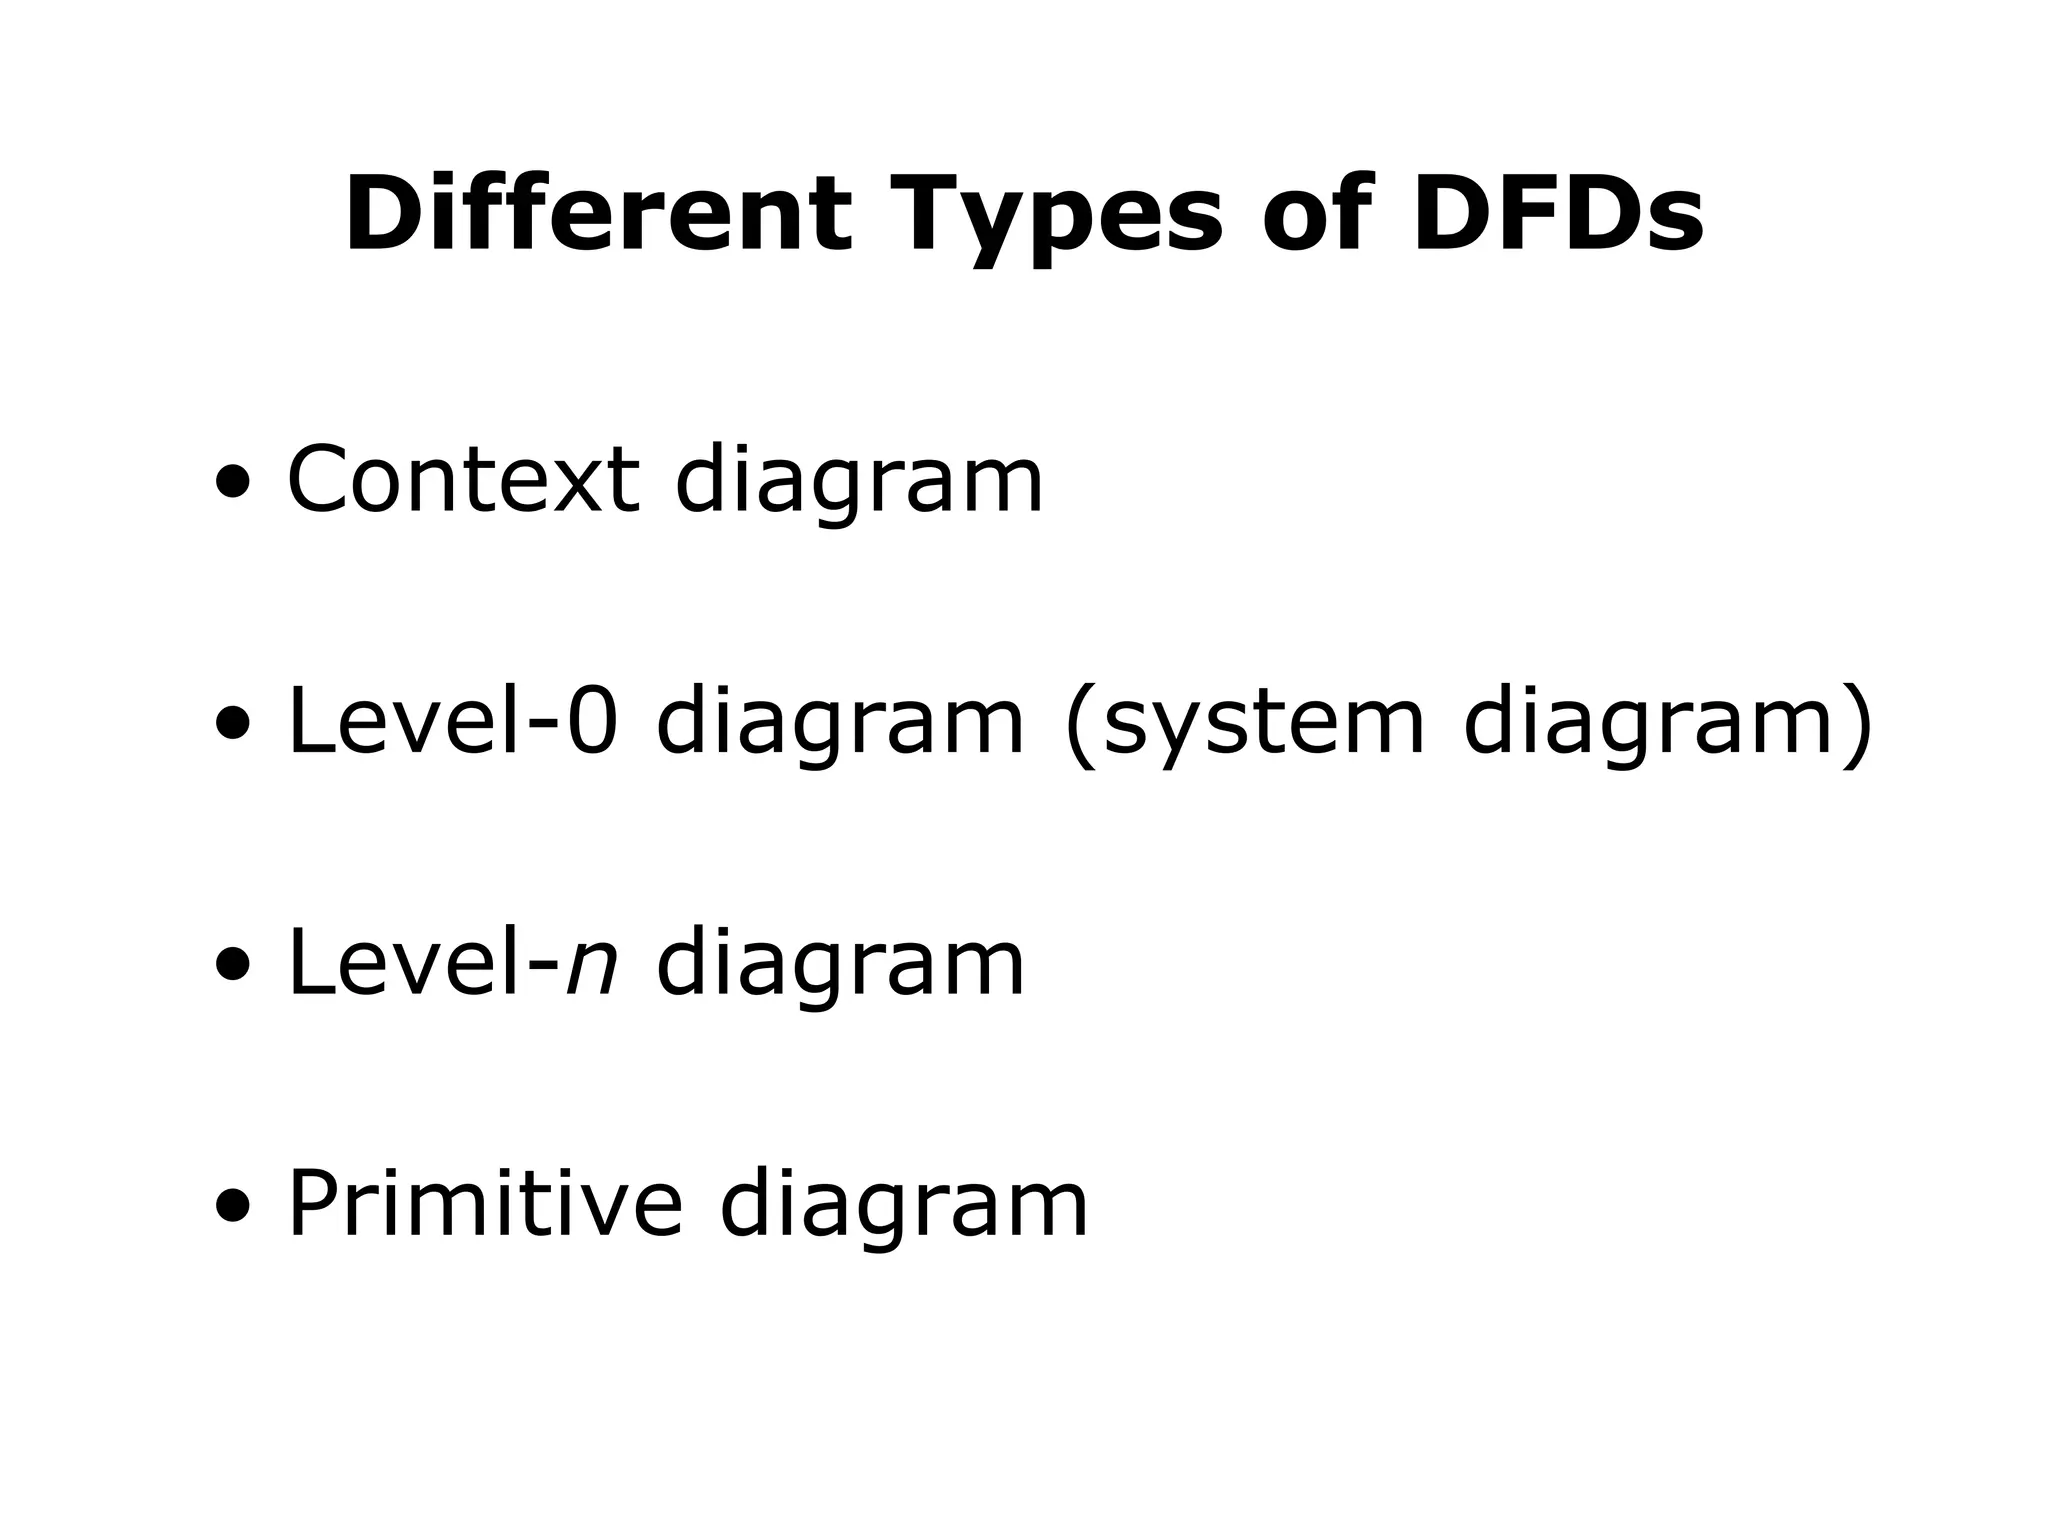
#17 Context:
- One process
- Shows interactions with environment
- No internal details
Level-0
- Major processing steps
- Processes similar to “main menu” items
Level-n
- Detail of one process from next highest level
Primitive
- Lowest level
- Each process usually has a single output
- Further detail of each process shown by a logic model