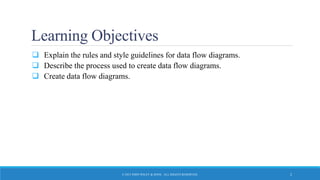
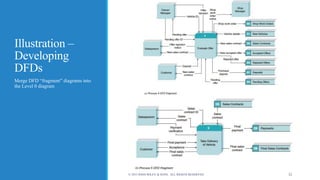
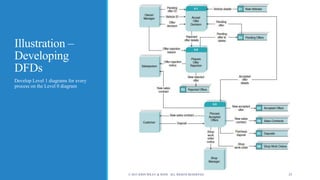
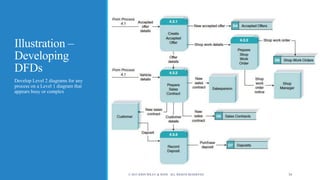
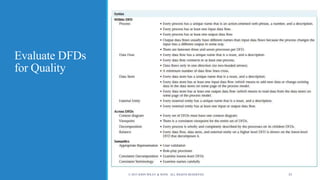
Process Modeling
SYSTEMS ANALYSIS AND DESIGN, 6TH EDITION
DENNIS, WIXOM, AND ROTH
© 2015 JOHN WILEY & SONS. ALL RIGHTS RESERVED. 1Roberta M. Roth
Learning Objectives
 Explain the rules and style guidelines for data flow diagrams.
 Describe the process used to create data flow diagrams.
 Create data flow diagrams.
© 2015 JOHN WILEY & SONS. ALL RIGHTS RESERVED. 2
Key Definitions
 Process model
o A formal way of representing how a business process operates
o Illustrate activities that are performed and how data moves between
them
o Logical process models describe processes without suggesting how
they are conducted.
o Physical process models include process implementation information
 Data flow diagramming
o A popular technique for creating process models
© 2015 JOHN WILEY & SONS. ALL RIGHTS RESERVED. 3
Data Flow Diagrams
WHAT DO DFDS TELL US?
© 2015 JOHN WILEY & SONS. ALL RIGHTS RESERVED. 4
Reading a Data
Flow Diagram
© 2015 JOHN WILEY & SONS. ALL RIGHTS RESERVED. 5
DFD Elements
 Process
o An activity or function performed for a specific
business reason
o Can be manual or computerized
o Includes the following:
• A number
• A name (verb phrase)
• A description
• At least one output data flow
• At least one input data flow
© 2015 JOHN WILEY & SONS. ALL RIGHTS RESERVED. 6
DFD Elements, con’t.
 Process, con’t.
o Logical process models omit any processes that
simply move or route data and leave the data
unchanged.
o You do include logical processes that:
• Perform computations (e.g., calculate grade point average)
• Make decisions (e.g., determine availability of ordered
products)
• Sort, filter or otherwise summarize data (e.g., identify overdue
invoices)
• Organize data into useful information (e.g., generate a report or
answer a question)
• Trigger other processes (e.g., turn on the furnace or instruct a
robot)
• Use stored data (create, read, update or delete a record)
© 2015 JOHN WILEY & SONS. ALL RIGHTS RESERVED. 7
DFD Elements, con’t.
 Data flow
o A single piece of data or a logical collection of data
o Data Flow names describe the content of the data
flow but not how it is implemented
o Always starts or ends at a process
o Includes the following:
• A name (noun)
• Description
• One or more connections to a process
© 2015 JOHN WILEY & SONS. ALL RIGHTS RESERVED. 8
DFD Elements, con’t.
 Data flow, con’t.
o A data flow is data in motion.
• an input of data to a process, or the output of data (or
information) from a process.
• the creation, deletion, or update of data in a file or database
(called a data store on the DFD).
• A data flow is depicted as a solid-line with arrow.
• Control flows (non-data flows) trigger processes, such as ‘time
to run the weekly payroll’
• The control flow is depicted as a dashed-line with arrow.
© 2015 JOHN WILEY & SONS. ALL RIGHTS RESERVED. 9
DFD Elements, con’t.
 Data Store
o Most information systems capture data for later use.
o A data store is a collection of data that is stored in
some way
o Include the following:
• A number
• A name (noun)
• Description
• One or more input data flows (somewhere in process model)
• One or more output data flows (somewhere in process model)
© 2015 JOHN WILEY & SONS. ALL RIGHTS RESERVED. 10
DFD Elements, con’t.
 Data Store, con’t.
o If data flows are data in motion, think of data stores
as data at rest.
o Data stores should describe “things” about which the
business wants to store data.
o Data flows leaving the data store are data retrievals
o Data flows entering the data store are updates or new
data added
© 2015 JOHN WILEY & SONS. ALL RIGHTS RESERVED. 11
DFD Elements, con’t.
 External entity
o A person, organization, or system that is external
to the system
o Has interactions with the system (adds data to
system or recieves data from system)
o Include the following:
• A name (noun)
• Description
© 2015 JOHN WILEY & SONS. ALL RIGHTS RESERVED. 12
Depicting Business Processes with DFDs
 Business processes are too complex to be shown on a single
DFD
 A deliberate hierarchy is created with multiple “levels” of
DFDs
 To build the hierarchy, use Decomposition
o Child diagrams show a portion of the parent diagram in greater detail
DFD Hierarchy
o Context Diagram decomposes into
Level 0 diagram
© 2015 JOHN WILEY & SONS. ALL RIGHTS RESERVED. 14
DFD Hierarchy
o Processes on Level 0 diagram each
decompose into separate Level 1
diagrams
o Processes on Level 1 diagrams may
or may not be decomposed into
separate Level 2 diagrams.
o Processes are decomposed until
each process is a single-purpose,
primitive process.
© 2015 JOHN WILEY & SONS. ALL RIGHTS RESERVED. 15
Balancing
 Ensures that information presented at one level of a DFD is
accurately represented in the next level DFD.
 Data flows on parent diagram are carried down to child
diagram.
 Child diagram adds new processes and new data flows
© 2015 JOHN WILEY & SONS. ALL RIGHTS RESERVED. 16
Context Diagram
 Top-level DFD in every process model
 Shows the context into which the business process fits
 Shows the overall business process as just one process
(process ‘zero’)
 Shows all the external entities that receive information from
or contribute information to the system
© 2015 JOHN WILEY & SONS. ALL RIGHTS RESERVED. 17
Level O
Diagram
 Shows all the major processes that comprise the overall
system – the internal components of process 0
 Shows how the major processes are interrelated by data
flows
 Shows external entities and the major processes with which
they interact
 Adds stored data via the data stores
© 2015 JOHN WILEY & SONS. ALL RIGHTS RESERVED. 18
Level 1
Diagrams
 Create one level 1 diagram for every major process on the
level 0 diagram
 Shows the internal processes that comprise a single process
on the level 0 diagram
 Shows how information moves to and from each of these
processes
 If a parent process is decomposed into, say, three child
processes, the these three child processes wholly and
completely make up the parent process
Level 2 Diagrams
 Shows all processes that comprise a single
process on the level 1 diagram
 Shows how information moves to and from each
of these processes
 Level 2 diagrams may not be needed for all level
1 processes
 Correctly numbering each process helps the user
understand where the process fits into the overall
system
Diagram Numbering
 Correctly numbering each process helps the user
understand where the process fits into the overall
hierarchy
o Context Diagram is always “Process 0”
o Level 0 processes are always numbered with integer
value (1, 2, 3, etc.)
o Level 1 processes always have one “dot”: parent
number “dot” unique number (1.1, 1.2, 1.3, etc.)
o Level 2 processes always have two “dots”: parent
number “dot” unique number (1.1.1, 1.1.2, 1.1.3, etc.)
Alternative Data Flows
 Where a process can produce different data flows given
different conditions
 We show both data flows and use the process description to
explain why they are alternatives
 Tip -- alternative data flows often accompany processes with
IF statements
Process Descriptions
 Text-based process descriptions provide more information
about the process than the DFD alone
 CASE tools enable easy creation of descriptions
 If the logic underlying the process is quite complex, more
detail may be needed in the form of
o Structured English
o Decision trees
o Decision tables
CASE Entry of
Process
Description
© 2015 JOHN WILEY & SONS. ALL RIGHTS RESERVED. 24
Your Turn
 At this point in the process it is easy to lose track of the “big
picture”.
 Describe the contribution of data flows, data stores, and
processes to a process model.
 Describe in your own words the relationship between the
DFDs and the ultimate new application being developed.
© 2015 JOHN WILEY & SONS. ALL RIGHTS RESERVED. 25
Creating Data Flow
Diagrams
HOW DFDS ARE DEVELOPED
© 2015 JOHN WILEY & SONS. ALL RIGHTS RESERVED. 26
Steps in Building DFDs
 Build the context diagram
o Identify the external entities and the major inflows they supply and the
outflows they receive
 Identify all major processes encompassed by the Context
Diagram
o Each major event / use case is “handled” by a process
 Create DFD “fragments” for each event / use case
o Each DFD fragment is a mini-diagram showing the process and the
external entities and data stores with which it interacts.
© 2015 JOHN WILEY & SONS. ALL RIGHTS RESERVED. 27
Steps in Building DFDs, con’t.
 Organize DFD fragments into level 0 diagram
 Decompose each level 0 process into a level 1 diagram;
decompose level 1 processes into level 2 diagrams as needed;
etc.
 Validate DFDs with user to ensure completeness and correctness
© 2015 JOHN WILEY & SONS. ALL RIGHTS RESERVED. 28
Integrating Use Cases
 DFDs start with events, use cases and the requirements
definition
 The DFDs often flow directly from the use cases
o Names of use cases become major processes on the Level 0 diagram
o Steps in the use case become processes on the Level 1 diagram
o Inputs and outputs become data flows on the Level 1 diagram (and
below)
© 2015 JOHN WILEY & SONS. ALL RIGHTS RESERVED. 29
Illustration –
Developing
DFDs
Creating the Context Diagram
© 2015 JOHN WILEY & SONS. ALL RIGHTS RESERVED. 30
Illustration –
Developing
DFDs
Create a DFD “fragment” based on a
use case
© 2015 JOHN WILEY & SONS. ALL RIGHTS RESERVED. 31
Illustration –
Developing
DFDs
Merge DFD “fragment” diagrams into
the Level 0 diagram
© 2015 JOHN WILEY & SONS. ALL RIGHTS RESERVED. 32
Illustration –
Developing
DFDs
Develop Level 1 diagrams for every
process on the Level 0 diagram
© 2015 JOHN WILEY & SONS. ALL RIGHTS RESERVED. 33
Illustration –
Developing
DFDs
Develop Level 2 diagrams for any
process on a Level 1 diagram that
appears busy or complex
© 2015 JOHN WILEY & SONS. ALL RIGHTS RESERVED. 34
Evaluate DFDs
for Quality
© 2015 JOHN WILEY & SONS. ALL RIGHTS RESERVED. 35
Common DFD Errors
 Syntax errors – violating “drawing” rules
o Every data flow must connect to a process.
o Every process must have at least one inflow and one outflow.
 Semantics errors – errors in the meaning of the diagrams
o Walk-through diagrams with users
o Verify that inputs shown are logically sufficient to produce the
outputs
o Check for consistent levels of decomposition
o Check for consistent use of terminology
© 2015 JOHN WILEY & SONS. ALL RIGHTS RESERVED. 36

Module 2 Unit 3

  • 1.
    Process Modeling SYSTEMS ANALYSISAND DESIGN, 6TH EDITION DENNIS, WIXOM, AND ROTH © 2015 JOHN WILEY & SONS. ALL RIGHTS RESERVED. 1Roberta M. Roth
  • 2.
    Learning Objectives  Explainthe rules and style guidelines for data flow diagrams.  Describe the process used to create data flow diagrams.  Create data flow diagrams. © 2015 JOHN WILEY & SONS. ALL RIGHTS RESERVED. 2
  • 3.
    Key Definitions  Processmodel o A formal way of representing how a business process operates o Illustrate activities that are performed and how data moves between them o Logical process models describe processes without suggesting how they are conducted. o Physical process models include process implementation information  Data flow diagramming o A popular technique for creating process models © 2015 JOHN WILEY & SONS. ALL RIGHTS RESERVED. 3
  • 4.
    Data Flow Diagrams WHATDO DFDS TELL US? © 2015 JOHN WILEY & SONS. ALL RIGHTS RESERVED. 4
  • 5.
    Reading a Data FlowDiagram © 2015 JOHN WILEY & SONS. ALL RIGHTS RESERVED. 5
  • 6.
    DFD Elements  Process oAn activity or function performed for a specific business reason o Can be manual or computerized o Includes the following: • A number • A name (verb phrase) • A description • At least one output data flow • At least one input data flow © 2015 JOHN WILEY & SONS. ALL RIGHTS RESERVED. 6
  • 7.
    DFD Elements, con’t. Process, con’t. o Logical process models omit any processes that simply move or route data and leave the data unchanged. o You do include logical processes that: • Perform computations (e.g., calculate grade point average) • Make decisions (e.g., determine availability of ordered products) • Sort, filter or otherwise summarize data (e.g., identify overdue invoices) • Organize data into useful information (e.g., generate a report or answer a question) • Trigger other processes (e.g., turn on the furnace or instruct a robot) • Use stored data (create, read, update or delete a record) © 2015 JOHN WILEY & SONS. ALL RIGHTS RESERVED. 7
  • 8.
    DFD Elements, con’t. Data flow o A single piece of data or a logical collection of data o Data Flow names describe the content of the data flow but not how it is implemented o Always starts or ends at a process o Includes the following: • A name (noun) • Description • One or more connections to a process © 2015 JOHN WILEY & SONS. ALL RIGHTS RESERVED. 8
  • 9.
    DFD Elements, con’t. Data flow, con’t. o A data flow is data in motion. • an input of data to a process, or the output of data (or information) from a process. • the creation, deletion, or update of data in a file or database (called a data store on the DFD). • A data flow is depicted as a solid-line with arrow. • Control flows (non-data flows) trigger processes, such as ‘time to run the weekly payroll’ • The control flow is depicted as a dashed-line with arrow. © 2015 JOHN WILEY & SONS. ALL RIGHTS RESERVED. 9
  • 10.
    DFD Elements, con’t. Data Store o Most information systems capture data for later use. o A data store is a collection of data that is stored in some way o Include the following: • A number • A name (noun) • Description • One or more input data flows (somewhere in process model) • One or more output data flows (somewhere in process model) © 2015 JOHN WILEY & SONS. ALL RIGHTS RESERVED. 10
  • 11.
    DFD Elements, con’t. Data Store, con’t. o If data flows are data in motion, think of data stores as data at rest. o Data stores should describe “things” about which the business wants to store data. o Data flows leaving the data store are data retrievals o Data flows entering the data store are updates or new data added © 2015 JOHN WILEY & SONS. ALL RIGHTS RESERVED. 11
  • 12.
    DFD Elements, con’t. External entity o A person, organization, or system that is external to the system o Has interactions with the system (adds data to system or recieves data from system) o Include the following: • A name (noun) • Description © 2015 JOHN WILEY & SONS. ALL RIGHTS RESERVED. 12
  • 13.
    Depicting Business Processeswith DFDs  Business processes are too complex to be shown on a single DFD  A deliberate hierarchy is created with multiple “levels” of DFDs  To build the hierarchy, use Decomposition o Child diagrams show a portion of the parent diagram in greater detail
  • 14.
    DFD Hierarchy o ContextDiagram decomposes into Level 0 diagram © 2015 JOHN WILEY & SONS. ALL RIGHTS RESERVED. 14
  • 15.
    DFD Hierarchy o Processeson Level 0 diagram each decompose into separate Level 1 diagrams o Processes on Level 1 diagrams may or may not be decomposed into separate Level 2 diagrams. o Processes are decomposed until each process is a single-purpose, primitive process. © 2015 JOHN WILEY & SONS. ALL RIGHTS RESERVED. 15
  • 16.
    Balancing  Ensures thatinformation presented at one level of a DFD is accurately represented in the next level DFD.  Data flows on parent diagram are carried down to child diagram.  Child diagram adds new processes and new data flows © 2015 JOHN WILEY & SONS. ALL RIGHTS RESERVED. 16
  • 17.
    Context Diagram  Top-levelDFD in every process model  Shows the context into which the business process fits  Shows the overall business process as just one process (process ‘zero’)  Shows all the external entities that receive information from or contribute information to the system © 2015 JOHN WILEY & SONS. ALL RIGHTS RESERVED. 17
  • 18.
    Level O Diagram  Showsall the major processes that comprise the overall system – the internal components of process 0  Shows how the major processes are interrelated by data flows  Shows external entities and the major processes with which they interact  Adds stored data via the data stores © 2015 JOHN WILEY & SONS. ALL RIGHTS RESERVED. 18
  • 19.
    Level 1 Diagrams  Createone level 1 diagram for every major process on the level 0 diagram  Shows the internal processes that comprise a single process on the level 0 diagram  Shows how information moves to and from each of these processes  If a parent process is decomposed into, say, three child processes, the these three child processes wholly and completely make up the parent process
  • 20.
    Level 2 Diagrams Shows all processes that comprise a single process on the level 1 diagram  Shows how information moves to and from each of these processes  Level 2 diagrams may not be needed for all level 1 processes  Correctly numbering each process helps the user understand where the process fits into the overall system
  • 21.
    Diagram Numbering  Correctlynumbering each process helps the user understand where the process fits into the overall hierarchy o Context Diagram is always “Process 0” o Level 0 processes are always numbered with integer value (1, 2, 3, etc.) o Level 1 processes always have one “dot”: parent number “dot” unique number (1.1, 1.2, 1.3, etc.) o Level 2 processes always have two “dots”: parent number “dot” unique number (1.1.1, 1.1.2, 1.1.3, etc.)
  • 22.
    Alternative Data Flows Where a process can produce different data flows given different conditions  We show both data flows and use the process description to explain why they are alternatives  Tip -- alternative data flows often accompany processes with IF statements
  • 23.
    Process Descriptions  Text-basedprocess descriptions provide more information about the process than the DFD alone  CASE tools enable easy creation of descriptions  If the logic underlying the process is quite complex, more detail may be needed in the form of o Structured English o Decision trees o Decision tables
  • 24.
    CASE Entry of Process Description ©2015 JOHN WILEY & SONS. ALL RIGHTS RESERVED. 24
  • 25.
    Your Turn  Atthis point in the process it is easy to lose track of the “big picture”.  Describe the contribution of data flows, data stores, and processes to a process model.  Describe in your own words the relationship between the DFDs and the ultimate new application being developed. © 2015 JOHN WILEY & SONS. ALL RIGHTS RESERVED. 25
  • 26.
    Creating Data Flow Diagrams HOWDFDS ARE DEVELOPED © 2015 JOHN WILEY & SONS. ALL RIGHTS RESERVED. 26
  • 27.
    Steps in BuildingDFDs  Build the context diagram o Identify the external entities and the major inflows they supply and the outflows they receive  Identify all major processes encompassed by the Context Diagram o Each major event / use case is “handled” by a process  Create DFD “fragments” for each event / use case o Each DFD fragment is a mini-diagram showing the process and the external entities and data stores with which it interacts. © 2015 JOHN WILEY & SONS. ALL RIGHTS RESERVED. 27
  • 28.
    Steps in BuildingDFDs, con’t.  Organize DFD fragments into level 0 diagram  Decompose each level 0 process into a level 1 diagram; decompose level 1 processes into level 2 diagrams as needed; etc.  Validate DFDs with user to ensure completeness and correctness © 2015 JOHN WILEY & SONS. ALL RIGHTS RESERVED. 28
  • 29.
    Integrating Use Cases DFDs start with events, use cases and the requirements definition  The DFDs often flow directly from the use cases o Names of use cases become major processes on the Level 0 diagram o Steps in the use case become processes on the Level 1 diagram o Inputs and outputs become data flows on the Level 1 diagram (and below) © 2015 JOHN WILEY & SONS. ALL RIGHTS RESERVED. 29
  • 30.
    Illustration – Developing DFDs Creating theContext Diagram © 2015 JOHN WILEY & SONS. ALL RIGHTS RESERVED. 30
  • 31.
    Illustration – Developing DFDs Create aDFD “fragment” based on a use case © 2015 JOHN WILEY & SONS. ALL RIGHTS RESERVED. 31
  • 32.
    Illustration – Developing DFDs Merge DFD“fragment” diagrams into the Level 0 diagram © 2015 JOHN WILEY & SONS. ALL RIGHTS RESERVED. 32
  • 33.
    Illustration – Developing DFDs Develop Level1 diagrams for every process on the Level 0 diagram © 2015 JOHN WILEY & SONS. ALL RIGHTS RESERVED. 33
  • 34.
    Illustration – Developing DFDs Develop Level2 diagrams for any process on a Level 1 diagram that appears busy or complex © 2015 JOHN WILEY & SONS. ALL RIGHTS RESERVED. 34
  • 35.
    Evaluate DFDs for Quality ©2015 JOHN WILEY & SONS. ALL RIGHTS RESERVED. 35
  • 36.
    Common DFD Errors Syntax errors – violating “drawing” rules o Every data flow must connect to a process. o Every process must have at least one inflow and one outflow.  Semantics errors – errors in the meaning of the diagrams o Walk-through diagrams with users o Verify that inputs shown are logically sufficient to produce the outputs o Check for consistent levels of decomposition o Check for consistent use of terminology © 2015 JOHN WILEY & SONS. ALL RIGHTS RESERVED. 36