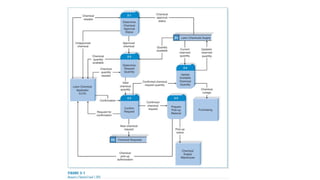
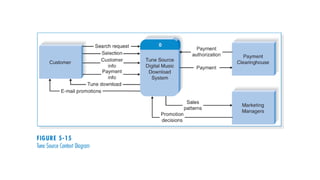
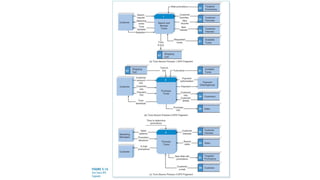
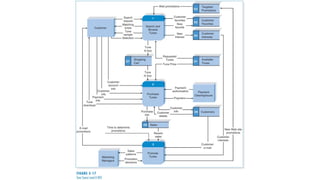
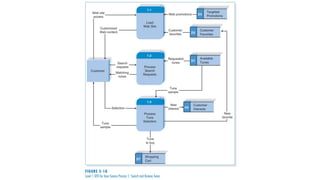
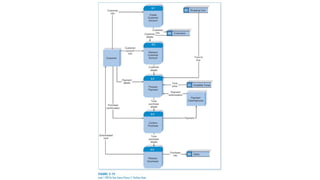
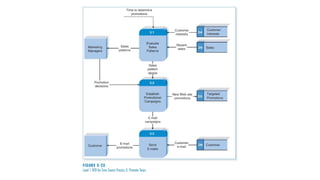
PROCESS MODELING
Objectives:
• Understand and follow rules and guidelines for DFDs.
• Learn the step-by-step process to create DFDs.
• Apply concepts by creating various levels of DFDs.
Process Modeling?
• It’s a visual (graphical) way to show how a business system works.
• It helps to understand what activities are done and how data moves
between them.
• It can be used to represent the current system (as-is) or the future
system (to-be).
• External Entities / Source & Sink
• Process
• Data Flow
• Data Store
Components of DFDs
External Entity:
LCA (Lawn Chemical Applicator) is the main user.
He/she starts the process by asking for a chemical.
Main Steps (Processes 2.1 to 2.5):
2.1 Determine Chemical Approval Status
• Checks if the chemical is approved or not.
• It looks into a storage file called Lawn Chemicals Supply.
• If not approved, it sends back a rejection.
• If approved, it moves to the next step.
2.2 Determine Request Quantity
• Tells the LCA how much chemical is available.
• LCA then says how much they want.
• If the request is okay (not too much), the system accepts it.
Main Steps (Processes 2.1 to 2.5):
2.3 Confirm Request
• Confirms the request made by LCA.
• Saves the request in a storage called Chemical Requests.
• Tells LCA that the request is confirmed.
2.4 Update Available Chemical Quantity
• Reserves the amount of chemical requested so others can't take it.
• Updates the storage to reflect the new available quantity.
• If there’s not enough, it informs Purchasing about a chemical shortage.
Main Steps (Processes 2.1 to 2.5):
2.5 Prepare Pick-up Material
• Prepares the pick-up info.
• Notifies the Chemical Supply Warehouse to get the chemical ready.
• Sends pick-up authorization to the LCA.
Data Stores:
• D1: Lawn Chemicals Supply – where info about chemical stock and
approval is kept.
• D2: Chemical Requests – where confirmed requests are saved.
Elements of DFD
Symbols in DFDs
1. Process
• A business function or activity that transforms inputs into outputs.
• Starts with a verb + ends with a noun (e.g., Determine Quantity).
• Requirements:
• Has a number, name, and description
• Must have at least one input and one output data flow
• Symbols:
• Gane & Sarson: Rounded rectangle with label and number
• DeMarco/Yourdon: Oval
2. Data Flow
• Represents movement of data between processes, data stores, and
external entities.
• Noun (e.g., Customer Info)
• Requirements:
• Must connect to a process
• Can flow to or from data stores or external entities
• Symbol: Arrow with label (→)
3. Data Store
• A collection of data that is stored for later use.
• Noun (e.g., Inventory)
• Requirements:
• Has a number, name, and description
• Has input and/or output data flows
• Symbols:
• Gane & Sarson: Open-ended rectangle
• DeMarco/Yourdon: Two parallel lines
4. External Entity
• A person, organization, or system outside the scope of the system
that interacts with it.
• Noun (e.g., Customer, Bank)
• Requirements: Has a name and description
• Symbol: Square/Rectangle
Levels of DFDs
1. Context diagram
A context diagram is the top-level (highest level) view of a system. It
shows:
• The entire system as a single process
• The external entities (people, other systems) that interact with the
system
• The data flows going into and out of the system
Step 1 : Identify Process - name of the system.
Step 2 : Identify External Entities – stakeholders, and draw it around the perimeter
of the page.
Step 3 : Identify Data Flows
** Remember the Rules:
• Follow naming conventions.
• Do not represent detail data flows as from entity to entity.
Context Diagram
• Guidelines for Drawing DFDs
• Draw the context diagram so that it fits on one page
• Use the name of the information system as the process name in the context diagram
• Use unique names within each set of symbols
• Do not cross lines
• Provide a unique name and reference number for each process
• Ensure that the model is accurate, easy to understand, and meets the needs of its
users
Creating a Set of DFDs
1. Context diagram
Creating a Set of DFDs
2
FIGURE 5-13 Context diagram
DFD for an order system
• Step 1: Draw a Context
Diagram
Basic Data Flow Diagramming Rules
Common Mistakes in DFD
Slide 21 (of 21)
2. Level 0 DFD?
• A Level 0 Data Flow Diagram (DFD) is the next step after the context
diagram. It:
• Breaks down the single process (process 0) from the context diagram
into major sub-processes (e.g., 1, 2, 3).
• Shows data stores (where information is stored within the system).
• Includes external entities and data flows, just like the context
diagram.
• Provides more internal detail of how the system works.
• Also called child diagram
• Is exploded from parent diagram
• When drawn, should be
• leveled
• also called exploded, partitioned and decomposed
• drawn in a series of increasingly detailed diagrams until desired degree of
detail is reached
• balanced
• maintain consistency among the entire series of diagrams
Also called Lower-level diagrams
Step 1 : Identify related process – main functionalities/ sub-modules
Step 2 : Identify Data Flows to/from External Entities to/from identified processes,
at the same time identify Data Store needed
Step(s) to Draw
Data Flow Diagram Level 0
2. Level 0 DFD?
2. Level 0 DFD?
• Balancing means the inputs and outputs of a higher-level diagram (like the
context diagram) should match the flows in the next level (like the Level 0 DFD).
In this figure:
• Inputs and outputs to/from external entities (X, Y, Z) in the context diagram also
appear in the Level 0 DFD.
• The internal structure of process 0 is shown using processes 1, 2, and 3.
• New internal flows (A and B) are added to show how these sub-processes
connect.
• D1 is introduced because now we are zooming into the system’s internal
storage.
Creating Level 0 DFD
3
FIGURE 5-16 Diagram 0 DFD for the order system
• Step 2: Draw a Diagram 0 DFD
• If same data flows in both
directions, you can use a double-
headed arrow
• Diagram 0 is an exploded view of
process 0
• Parent diagram
• Child diagram
• A second class of DFD mistakes arise when the outputs from one processing step
do not match its inputs.
• It is not A processing step may have input flows but no output flows. This situation is
sometimes called a black hole.
• A processing step may have output flows but no input flows. This situation is
sometimes called a miracle.
• A processing step may have outputs that are greater than the sum of its inputs - e.g.,
its inputs could not produce the output shown. This situation is sometimes referred
to as a grey hole.
• hard to list situations in which this might occur:
Diagramming Mistakes in DFD
Let’s find the mistakes!
1. Process 1.0 (P2) has only inputs, making it a “black hole”.
2. Data flow DF5 should not move directly from source E1 to data store DS1 without first going through a
process.
3. Data flow DF1 should not move directly from source E1 to sink E2 without first going through a process.
3. Level 1 DFD
• A Level 1 Data Flow Diagram (DFD) is a more detailed breakdown of
one of the processes from the Level 0 DFD.
• Each major process from the Level 0 DFD is decomposed into sub-
processes.
• These sub-processes are numbered based on their parent.
(For example: process 2 from the Level 0 DFD becomes 2.1, 2.2, 2.3 in
the Level 1 DFD.)
• It shows how data moves between these sub-processes and data
stores, but does not always show where data originates or goes
outside the process — for that, we refer to the Level 0 DFD.
3. Level 1 DFD
3. Level 1 DFD
• Balancing means that the inputs and outputs of Process 2 in the Level
0 diagram match what we see in this Level 1 diagram.
• Level 0 shows:
• Inputs: B, M
• Outputs: A, N, Y
• Interaction with Data Store D1
Creating Level 1 DFD
FIGURE 5-17 Diagram 1 DFD shows
details of the FILLORDER process in
the order system
• Step 3: Draw the Lower
Level Diagrams
• Must use leveling and
balancing techniques
• Leveling examples
• Uses a series of
increasingly detailed
DFDs to describe an
information
system
• Exploding, partitioning,
or decomposing
Creating Level 1 DFD
4
FIGURE 5-19 The order system diagram 0 is shown at the top of the figure, and exploded diagram 3 DFD (for the
APPLY PAYMENT process) is shown at the bottom. The two DFDs are balanced because the child diagram at the
bottom has the same input and output flows as the parent process 3 shown at the top
Creating Level 1 DFD
4
FIGURE 5-21 In the next level of
detail, the process 0 black box reveals
three processes, two data stores, and
four internal data flows — all of which
are shown inside the dashed line
FIGURE 5-20 Example of a parent
DFD diagram, showing process 0 as a
black box
Process Decomposition
4.1
Record
Time
Worked
4.2
Calculat
e
Payroll
4.3
Pay
Employ
ee
3.1
Produce
Purchas
e Order
3.2
Receive
Items
3.3
Pay
Vendor
2.1
Serve
Product
2.2
Produce
Product
2.3
Store
Product
1.1
Record
Order
1.2
Receive
Paymen
t
2.0
Producti
on
1.0
Sale
3.0
Procure-
ment
4.0
Payroll
0.0
Lemonad
e System
Level 0 Level 1
Context Level
4. Level 2 DFD
• A Level 2 Data Flow Diagram is a further breakdown of a single
process from a Level 1 DFD.
• It gives even more detail about what happens inside a specific
process.
• Each process in this level is numbered with two decimal points, e.g.,
2.2.1, 2.2.2, 2.2.3, meaning these are parts of Process 2.2.
4. Level 2 DFD
4. Level 2 DFD
• This Level 2 diagram is balanced with the Level 1 DFD for Process 2.2
because:
• It has the same inputs (H, K) and outputs (C, G).
• It still interacts with Data Store D1 (N).
• The internal workings are just shown in more detail — nothing is
added or missing in terms of what goes in or comes out of Process
2.2.
Examples
Interview: Sarah (systems analyst) and Hal
(owner, Holiday Travel Vehicles)
• The interview with Hal (business owner) provides a clear picture of
how Holiday Travel Vehicles operates.
• Here's a concise breakdown of the business processes, requests,
and system requirements based on the discussion with Sarah, the
systems analyst:
BUSINESS SUMMARY
Core Business:
Selling new and used recreational vehicles (RVs) and trailers, with
seasonal inventory management and customer customization.
MAJOR BUSINESS PROCESSES
1. Vehicle Ordering and Inventory
• Order Placement: Vehicles are ordered from 5 main suppliers.
• Vehicle Arrival & Recording:
• When new vehicles arrive, details like VIN, model, year, cost, etc., are
recorded using a New Vehicle Form and stored physically in a file cabinet.
MAJOR BUSINESS PROCESSES
2. Sales Process
a. Customer Interaction
• Customers browse without data
collection until they decide on a vehicle.
• An Offer Form is filled once the customer
chooses a vehicle.
b. Offer Evaluation
• Offer includes:
• Customer name
• Vehicle chosen
• Offered price
• Trade-in vehicle details (if any)
Trade-in value is determined by a
Used Vehicle Manager.
Owner (Hal) reviews the offer
using:
• New Vehicle Form (for vehicle
cost)
• Green Book (for trade-in value)
• If changes are needed, a new
Offer Form is written; old ones are
destroyed or stored for follow-up.
MAJOR BUSINESS PROCESSES
3. Sales Finalization
• Upon Offer Acceptance:
• A Sales Contract is filled out with:
• Full customer details
• Vehicle + trade-in info
• Dealer-installed options
• Final price, taxes, deposit
• Salesperson info (for commission)
Financing:
• Customer arranges their own financing;
HTV refers them to local banks.
Records:
• Vehicle Purchase Record is created and
combined with the New Vehicle Form.
• Stored by customer name for future
reference.
Shop Work Order: Issued for
prep/installation of dealer options.
MAJOR BUSINESS PROCESSES
4. Vehicle Delivery
• Customer brings payment and trade-in vehicle.
• Final walkthrough and signature.
• Receives vehicle keys + a copy of Sales Contract.
• Records (Sales Contract + Purchase Record) are finalized.
MAJOR BUSINESS PROCESSES
5. Trade-In Processing
• A Used Vehicle Form is completed with trade-in info.
• If needed, a shop work order is created to prep the used vehicle for
resale.
6. Bookkeeping
• After final delivery, sales data (price, taxes, fees) are recorded in a
Sales Ledger for bookkeeping.
BUSINESS REQUEST
Hal and HTV are seeking:
• A new information system to improve efficiency, accuracy, and
record-keeping.
• Better handling of vehicle inventory, customer offers, trade-ins, and
finalized sales.
• Eliminate manual/paper forms and physical filing.
• Facilitate communication among staff (salespeople, owner, used
vehicle manager, shop, and bookkeeper).
SYSTEM REQUIREMENTS (Functional
Requirements)
1. Inventory Management:
• Record and track new vehicle data on arrival.
• Manage trade-in vehicle details and condition.
2. Sales Support:
• Create and manage offer forms digitally.
• Retrieve vehicle and trade-in details during negotiations.
• Store and access customer-specific offers.
3. Offer Evaluation:
• Support owner decision-making with easy access to vehicle cost and trade-in values.
• Track rejected, pending, and accepted offers.
SYSTEM REQUIREMENTS (Functional
Requirements)
4. Sales Contract & Delivery:
• Generate formal contracts.
• Capture all sale-related info: vehicle, customer, pricing, options.
• Track delivery status and customer confirmation.
5. Shop Integration:
• Automatically generate work orders for dealer-installed options or
trade-in prep.
6. Bookkeeping Integration:
• Record sales data, taxes, and fees in a sales ledger system.
SYSTEM REQUIREMENTS (Functional
Requirements)
7. Reporting & Follow-Up:
• Generate reports for sales, inventory, and customer activity.
• Track follow-up actions for rejected offers.
SYSTEM REQUIREMENTS (Non- Functional
Requirements)
• User-friendly interface for non-technical staff.
• Secure access controls (e.g., only managers can accept/reject offers).
• Data integrity and backup for legal and financial safety.
• Integration capability with external systems (e.g., banks, accounting
tools).
Use case
Context Diagram
Creating Data Flow Diagram Fragments
Creating Level 0 DFD
• A Level 0 DFD (also called a context-level diagram) gives a high-level
overview of a system’s main processes, data flows, data stores, and
external entities.
• It's one level deeper than the context diagram, showing the major
sub-processes but still abstracting away detailed logic.
Creating Level 1 DFD
• A Level 1 DFD takes each major process from the Level 0 DFD and
breaks it down into smaller steps.
• Each step in a use case becomes its own process on the Level 1 DFD.
• Inputs and outputs of those steps become data flows.
• External entities (e.g., Customer, Salesperson) and data stores (e.g.,
Pending Offers, Payments) are often included to make the diagram
easier to understand.
Example I tunes
Assignment
To understand and apply Data Flow Diagrams (DFDs), use case modeling,
and scenario writing for a real-world system. You will analyze, model, and
document a system using Context Diagram, Level 0, Level 1, and Level 2
DFDs, along with use case diagrams and scenarios.
Choose One System to Model:
1. Garage Management System
2. Currency Exchange System
Part 1: System Analysis
Task 1.1: Describe the System
• Write a brief overview of your chosen system.
• Identify the main goals (e.g., managing vehicle services, currency
transactions).
Task 1.2: Identify System Actors
• List all users or systems that interact with your system (e.g., customer,
mechanic, cashier, teller).
• Briefly describe their roles.
Part 2: Use Case Modeling
Task 2.2: Write Use Case Descriptions
• Choose 3 use cases and write a detailed description for each:
• Use Case Name
• Actor(s)
• Preconditions
• Main Flow (step-by-step)
• Alternate Flows (if any)
• Postconditions
Part 3: Data Flow Diagram Development
Task 3.1: Create a Context Diagram
• Show your entire system as one process.
• Include all external entities and the major data flows.
Task 3.2: Create a Level 0 DFD
• Break the system into 4–6 main processes.
• Connect processes to data stores and external entities.
• Label all data flows clearly.
Task 3.3: Create a Level 1 DFD
• Choose one process from Level 0.
• Break it into sub-processes.
• Include all relevant data stores and flows.
Task 3.4 (Optional for bonus): Create a Level 2 DFD
• Pick a sub-process from Level 1 and break it down further.
• Ideal for complex parts like "Manage Service" or "Process Transaction".
Part 4: Data Modeling
Task 4.1: Identify Data Stores
• List all data stores (e.g., Customer Info, Vehicle Records, Transactions).
• Describe the type of data in each.
Task 4.2: Describe Data Flows
• Write 5 examples of data flows.
• What data is moving?
• From where to where?
• Why is it needed?
Assignment (Garage Management System)
Use Cases:
a. Book Service Appointment
b. Receive Vehicle
c. Assign Mechanic
d. Perform Service
e. Generate Bill
f. Process Payment
Entities:
• Customer
• Receptionist
• Mechanic
• Cashier
• Manager
Assignment (Currency Exchange System)
Use Cases:
a. Register Customer
b. Currency Rate Lookup
c. Initiate Exchange Transaction
d. Confirm Transaction
e. Generate Receipt
Entities:
• Customer
• Teller
• System Admin
THANKYOU

Mastering Process Modeling: A Visual Guide to Data Flow Diagrams

  • 1.
  • 2.
    Objectives: • Understand andfollow rules and guidelines for DFDs. • Learn the step-by-step process to create DFDs. • Apply concepts by creating various levels of DFDs.
  • 3.
    Process Modeling? • It’sa visual (graphical) way to show how a business system works. • It helps to understand what activities are done and how data moves between them. • It can be used to represent the current system (as-is) or the future system (to-be).
  • 4.
    • External Entities/ Source & Sink • Process • Data Flow • Data Store Components of DFDs
  • 6.
    External Entity: LCA (LawnChemical Applicator) is the main user. He/she starts the process by asking for a chemical.
  • 7.
    Main Steps (Processes2.1 to 2.5): 2.1 Determine Chemical Approval Status • Checks if the chemical is approved or not. • It looks into a storage file called Lawn Chemicals Supply. • If not approved, it sends back a rejection. • If approved, it moves to the next step. 2.2 Determine Request Quantity • Tells the LCA how much chemical is available. • LCA then says how much they want. • If the request is okay (not too much), the system accepts it.
  • 8.
    Main Steps (Processes2.1 to 2.5): 2.3 Confirm Request • Confirms the request made by LCA. • Saves the request in a storage called Chemical Requests. • Tells LCA that the request is confirmed. 2.4 Update Available Chemical Quantity • Reserves the amount of chemical requested so others can't take it. • Updates the storage to reflect the new available quantity. • If there’s not enough, it informs Purchasing about a chemical shortage.
  • 9.
    Main Steps (Processes2.1 to 2.5): 2.5 Prepare Pick-up Material • Prepares the pick-up info. • Notifies the Chemical Supply Warehouse to get the chemical ready. • Sends pick-up authorization to the LCA.
  • 10.
    Data Stores: • D1:Lawn Chemicals Supply – where info about chemical stock and approval is kept. • D2: Chemical Requests – where confirmed requests are saved.
  • 11.
  • 14.
  • 15.
    1. Process • Abusiness function or activity that transforms inputs into outputs. • Starts with a verb + ends with a noun (e.g., Determine Quantity). • Requirements: • Has a number, name, and description • Must have at least one input and one output data flow • Symbols: • Gane & Sarson: Rounded rectangle with label and number • DeMarco/Yourdon: Oval
  • 16.
    2. Data Flow •Represents movement of data between processes, data stores, and external entities. • Noun (e.g., Customer Info) • Requirements: • Must connect to a process • Can flow to or from data stores or external entities • Symbol: Arrow with label (→)
  • 17.
    3. Data Store •A collection of data that is stored for later use. • Noun (e.g., Inventory) • Requirements: • Has a number, name, and description • Has input and/or output data flows • Symbols: • Gane & Sarson: Open-ended rectangle • DeMarco/Yourdon: Two parallel lines
  • 18.
    4. External Entity •A person, organization, or system outside the scope of the system that interacts with it. • Noun (e.g., Customer, Bank) • Requirements: Has a name and description • Symbol: Square/Rectangle
  • 19.
  • 20.
    1. Context diagram Acontext diagram is the top-level (highest level) view of a system. It shows: • The entire system as a single process • The external entities (people, other systems) that interact with the system • The data flows going into and out of the system
  • 21.
    Step 1 :Identify Process - name of the system. Step 2 : Identify External Entities – stakeholders, and draw it around the perimeter of the page. Step 3 : Identify Data Flows ** Remember the Rules: • Follow naming conventions. • Do not represent detail data flows as from entity to entity. Context Diagram
  • 22.
    • Guidelines forDrawing DFDs • Draw the context diagram so that it fits on one page • Use the name of the information system as the process name in the context diagram • Use unique names within each set of symbols • Do not cross lines • Provide a unique name and reference number for each process • Ensure that the model is accurate, easy to understand, and meets the needs of its users Creating a Set of DFDs
  • 23.
  • 24.
    Creating a Setof DFDs 2 FIGURE 5-13 Context diagram DFD for an order system • Step 1: Draw a Context Diagram
  • 25.
    Basic Data FlowDiagramming Rules
  • 26.
    Common Mistakes inDFD Slide 21 (of 21)
  • 27.
    2. Level 0DFD? • A Level 0 Data Flow Diagram (DFD) is the next step after the context diagram. It: • Breaks down the single process (process 0) from the context diagram into major sub-processes (e.g., 1, 2, 3). • Shows data stores (where information is stored within the system). • Includes external entities and data flows, just like the context diagram. • Provides more internal detail of how the system works.
  • 28.
    • Also calledchild diagram • Is exploded from parent diagram • When drawn, should be • leveled • also called exploded, partitioned and decomposed • drawn in a series of increasingly detailed diagrams until desired degree of detail is reached • balanced • maintain consistency among the entire series of diagrams Also called Lower-level diagrams
  • 29.
    Step 1 :Identify related process – main functionalities/ sub-modules Step 2 : Identify Data Flows to/from External Entities to/from identified processes, at the same time identify Data Store needed Step(s) to Draw Data Flow Diagram Level 0
  • 30.
  • 31.
    2. Level 0DFD? • Balancing means the inputs and outputs of a higher-level diagram (like the context diagram) should match the flows in the next level (like the Level 0 DFD). In this figure: • Inputs and outputs to/from external entities (X, Y, Z) in the context diagram also appear in the Level 0 DFD. • The internal structure of process 0 is shown using processes 1, 2, and 3. • New internal flows (A and B) are added to show how these sub-processes connect. • D1 is introduced because now we are zooming into the system’s internal storage.
  • 32.
    Creating Level 0DFD 3 FIGURE 5-16 Diagram 0 DFD for the order system • Step 2: Draw a Diagram 0 DFD • If same data flows in both directions, you can use a double- headed arrow • Diagram 0 is an exploded view of process 0 • Parent diagram • Child diagram
  • 33.
    • A secondclass of DFD mistakes arise when the outputs from one processing step do not match its inputs. • It is not A processing step may have input flows but no output flows. This situation is sometimes called a black hole. • A processing step may have output flows but no input flows. This situation is sometimes called a miracle. • A processing step may have outputs that are greater than the sum of its inputs - e.g., its inputs could not produce the output shown. This situation is sometimes referred to as a grey hole. • hard to list situations in which this might occur: Diagramming Mistakes in DFD
  • 34.
  • 35.
  • 36.
    Let’s find themistakes! 1. Process 1.0 (P2) has only inputs, making it a “black hole”. 2. Data flow DF5 should not move directly from source E1 to data store DS1 without first going through a process. 3. Data flow DF1 should not move directly from source E1 to sink E2 without first going through a process.
  • 37.
    3. Level 1DFD • A Level 1 Data Flow Diagram (DFD) is a more detailed breakdown of one of the processes from the Level 0 DFD. • Each major process from the Level 0 DFD is decomposed into sub- processes. • These sub-processes are numbered based on their parent. (For example: process 2 from the Level 0 DFD becomes 2.1, 2.2, 2.3 in the Level 1 DFD.) • It shows how data moves between these sub-processes and data stores, but does not always show where data originates or goes outside the process — for that, we refer to the Level 0 DFD.
  • 38.
  • 39.
    3. Level 1DFD • Balancing means that the inputs and outputs of Process 2 in the Level 0 diagram match what we see in this Level 1 diagram. • Level 0 shows: • Inputs: B, M • Outputs: A, N, Y • Interaction with Data Store D1
  • 40.
    Creating Level 1DFD FIGURE 5-17 Diagram 1 DFD shows details of the FILLORDER process in the order system • Step 3: Draw the Lower Level Diagrams • Must use leveling and balancing techniques • Leveling examples • Uses a series of increasingly detailed DFDs to describe an information system • Exploding, partitioning, or decomposing
  • 41.
    Creating Level 1DFD 4 FIGURE 5-19 The order system diagram 0 is shown at the top of the figure, and exploded diagram 3 DFD (for the APPLY PAYMENT process) is shown at the bottom. The two DFDs are balanced because the child diagram at the bottom has the same input and output flows as the parent process 3 shown at the top
  • 42.
    Creating Level 1DFD 4 FIGURE 5-21 In the next level of detail, the process 0 black box reveals three processes, two data stores, and four internal data flows — all of which are shown inside the dashed line FIGURE 5-20 Example of a parent DFD diagram, showing process 0 as a black box
  • 43.
  • 44.
    4. Level 2DFD • A Level 2 Data Flow Diagram is a further breakdown of a single process from a Level 1 DFD. • It gives even more detail about what happens inside a specific process. • Each process in this level is numbered with two decimal points, e.g., 2.2.1, 2.2.2, 2.2.3, meaning these are parts of Process 2.2.
  • 45.
  • 46.
    4. Level 2DFD • This Level 2 diagram is balanced with the Level 1 DFD for Process 2.2 because: • It has the same inputs (H, K) and outputs (C, G). • It still interacts with Data Store D1 (N). • The internal workings are just shown in more detail — nothing is added or missing in terms of what goes in or comes out of Process 2.2.
  • 48.
  • 49.
    Interview: Sarah (systemsanalyst) and Hal (owner, Holiday Travel Vehicles) • The interview with Hal (business owner) provides a clear picture of how Holiday Travel Vehicles operates. • Here's a concise breakdown of the business processes, requests, and system requirements based on the discussion with Sarah, the systems analyst: BUSINESS SUMMARY Core Business: Selling new and used recreational vehicles (RVs) and trailers, with seasonal inventory management and customer customization.
  • 50.
    MAJOR BUSINESS PROCESSES 1.Vehicle Ordering and Inventory • Order Placement: Vehicles are ordered from 5 main suppliers. • Vehicle Arrival & Recording: • When new vehicles arrive, details like VIN, model, year, cost, etc., are recorded using a New Vehicle Form and stored physically in a file cabinet.
  • 51.
    MAJOR BUSINESS PROCESSES 2.Sales Process a. Customer Interaction • Customers browse without data collection until they decide on a vehicle. • An Offer Form is filled once the customer chooses a vehicle. b. Offer Evaluation • Offer includes: • Customer name • Vehicle chosen • Offered price • Trade-in vehicle details (if any) Trade-in value is determined by a Used Vehicle Manager. Owner (Hal) reviews the offer using: • New Vehicle Form (for vehicle cost) • Green Book (for trade-in value) • If changes are needed, a new Offer Form is written; old ones are destroyed or stored for follow-up.
  • 52.
    MAJOR BUSINESS PROCESSES 3.Sales Finalization • Upon Offer Acceptance: • A Sales Contract is filled out with: • Full customer details • Vehicle + trade-in info • Dealer-installed options • Final price, taxes, deposit • Salesperson info (for commission) Financing: • Customer arranges their own financing; HTV refers them to local banks. Records: • Vehicle Purchase Record is created and combined with the New Vehicle Form. • Stored by customer name for future reference. Shop Work Order: Issued for prep/installation of dealer options.
  • 53.
    MAJOR BUSINESS PROCESSES 4.Vehicle Delivery • Customer brings payment and trade-in vehicle. • Final walkthrough and signature. • Receives vehicle keys + a copy of Sales Contract. • Records (Sales Contract + Purchase Record) are finalized.
  • 54.
    MAJOR BUSINESS PROCESSES 5.Trade-In Processing • A Used Vehicle Form is completed with trade-in info. • If needed, a shop work order is created to prep the used vehicle for resale. 6. Bookkeeping • After final delivery, sales data (price, taxes, fees) are recorded in a Sales Ledger for bookkeeping.
  • 55.
    BUSINESS REQUEST Hal andHTV are seeking: • A new information system to improve efficiency, accuracy, and record-keeping. • Better handling of vehicle inventory, customer offers, trade-ins, and finalized sales. • Eliminate manual/paper forms and physical filing. • Facilitate communication among staff (salespeople, owner, used vehicle manager, shop, and bookkeeper).
  • 56.
    SYSTEM REQUIREMENTS (Functional Requirements) 1.Inventory Management: • Record and track new vehicle data on arrival. • Manage trade-in vehicle details and condition. 2. Sales Support: • Create and manage offer forms digitally. • Retrieve vehicle and trade-in details during negotiations. • Store and access customer-specific offers. 3. Offer Evaluation: • Support owner decision-making with easy access to vehicle cost and trade-in values. • Track rejected, pending, and accepted offers.
  • 57.
    SYSTEM REQUIREMENTS (Functional Requirements) 4.Sales Contract & Delivery: • Generate formal contracts. • Capture all sale-related info: vehicle, customer, pricing, options. • Track delivery status and customer confirmation. 5. Shop Integration: • Automatically generate work orders for dealer-installed options or trade-in prep. 6. Bookkeeping Integration: • Record sales data, taxes, and fees in a sales ledger system.
  • 58.
    SYSTEM REQUIREMENTS (Functional Requirements) 7.Reporting & Follow-Up: • Generate reports for sales, inventory, and customer activity. • Track follow-up actions for rejected offers.
  • 59.
    SYSTEM REQUIREMENTS (Non-Functional Requirements) • User-friendly interface for non-technical staff. • Secure access controls (e.g., only managers can accept/reject offers). • Data integrity and backup for legal and financial safety. • Integration capability with external systems (e.g., banks, accounting tools).
  • 60.
  • 68.
  • 69.
    Creating Data FlowDiagram Fragments
  • 72.
    Creating Level 0DFD • A Level 0 DFD (also called a context-level diagram) gives a high-level overview of a system’s main processes, data flows, data stores, and external entities. • It's one level deeper than the context diagram, showing the major sub-processes but still abstracting away detailed logic.
  • 74.
    Creating Level 1DFD • A Level 1 DFD takes each major process from the Level 0 DFD and breaks it down into smaller steps. • Each step in a use case becomes its own process on the Level 1 DFD. • Inputs and outputs of those steps become data flows. • External entities (e.g., Customer, Salesperson) and data stores (e.g., Pending Offers, Payments) are often included to make the diagram easier to understand.
  • 79.
  • 89.
  • 90.
    To understand andapply Data Flow Diagrams (DFDs), use case modeling, and scenario writing for a real-world system. You will analyze, model, and document a system using Context Diagram, Level 0, Level 1, and Level 2 DFDs, along with use case diagrams and scenarios. Choose One System to Model: 1. Garage Management System 2. Currency Exchange System
  • 91.
    Part 1: SystemAnalysis Task 1.1: Describe the System • Write a brief overview of your chosen system. • Identify the main goals (e.g., managing vehicle services, currency transactions). Task 1.2: Identify System Actors • List all users or systems that interact with your system (e.g., customer, mechanic, cashier, teller). • Briefly describe their roles.
  • 92.
    Part 2: UseCase Modeling Task 2.2: Write Use Case Descriptions • Choose 3 use cases and write a detailed description for each: • Use Case Name • Actor(s) • Preconditions • Main Flow (step-by-step) • Alternate Flows (if any) • Postconditions
  • 93.
    Part 3: DataFlow Diagram Development Task 3.1: Create a Context Diagram • Show your entire system as one process. • Include all external entities and the major data flows. Task 3.2: Create a Level 0 DFD • Break the system into 4–6 main processes. • Connect processes to data stores and external entities. • Label all data flows clearly. Task 3.3: Create a Level 1 DFD • Choose one process from Level 0. • Break it into sub-processes. • Include all relevant data stores and flows. Task 3.4 (Optional for bonus): Create a Level 2 DFD • Pick a sub-process from Level 1 and break it down further. • Ideal for complex parts like "Manage Service" or "Process Transaction".
  • 94.
    Part 4: DataModeling Task 4.1: Identify Data Stores • List all data stores (e.g., Customer Info, Vehicle Records, Transactions). • Describe the type of data in each. Task 4.2: Describe Data Flows • Write 5 examples of data flows. • What data is moving? • From where to where? • Why is it needed?
  • 95.
    Assignment (Garage ManagementSystem) Use Cases: a. Book Service Appointment b. Receive Vehicle c. Assign Mechanic d. Perform Service e. Generate Bill f. Process Payment Entities: • Customer • Receptionist • Mechanic • Cashier • Manager
  • 96.
    Assignment (Currency ExchangeSystem) Use Cases: a. Register Customer b. Currency Rate Lookup c. Initiate Exchange Transaction d. Confirm Transaction e. Generate Receipt Entities: • Customer • Teller • System Admin
  • 97.

Editor's Notes

  • #3  Why Use Process Models? They make complex processes easier to understand visually. Some organizations prefer detailed use cases instead of process models. Others (who use simpler use cases) find process models helpful to clarify processes. Data Flow Diagrams (DFDs) — the most common process modeling technique. DFDs help visualize how data flows and what processes are performed. Useful Helps systems analysts understand the requirements clearly before building the system. Logical models let us focus on business needs without worrying about technical details.
  • #5 This DFD shows the process of requesting lawn chemicals by a Lawn Chemical Applicator (LCA) — someone who needs chemicals for lawn care jobs. Flow of Information: Arrows show how information moves: From LCA to the system (requesting chemical, asking quantity, confirming request). From processes to each other (e.g., confirmation to pick-up preparation). From and to data stores (checking approval, updating quantity, saving request). LCA asks for a chemical. System checks if it’s allowed. If approved, LCA tells how much is needed. System confirms and saves the request. Quantity is reserved and updated. Warehouse is notified, and LCA is allowed to pick up the chemical.
  • #7 Step 1: You Ask for a Chemical You (the LCA) go to the system and say: “I need Chemical A.” The system now starts checking things for you. Step 2: System Checks if the Chemical Is Approved The system looks into a file cabinet (called Lawn Chemicals Supply) to see: “Is Chemical A allowed to be used?” If it is not approved: The system says: “Sorry, this chemical is not allowed.” ❌ The process stops here. If it is approved: The system moves to the next step. Step 3: System Tells You How Much Is Available The system checks the cabinet again and says: “There are 50 bottles of Chemical A available.” Now you can respond by saying how much you need. Step 4: You Say How Much You Want You say: “I want 10 bottles.” Now the system checks if that much can be given to you.
  • #8 Step 5: System Confirms Your Request If 10 bottles can be given: The system writes down your request in a notebook (called Chemical Requests). It tells you: “Your request for 10 bottles is confirmed!” Step 6: System Updates Inventory The system goes back to the cabinet and takes out 10 bottles from the total. Now it shows: “Only 40 bottles are left.” If there weren’t enough bottles, the system would send a message to the Purchasing team: “We’re running low. Please order more.”
  • #9 Step 7: System Prepares for Pick-Up The system then does two things: Tells the Warehouse: “Get 10 bottles of Chemical A ready for pick-up.” Tells You: “You’re allowed to pick up your 10 bottles.” You go to the warehouse, show your pick-up slip, and collect the chemicals you requested
  • #15 Also called a bubble or transform Modifies or changes data from one form to another form Is named to identify the function it accomplishes A diagram should have no more than nine process symbols Name consists of an active verb followed by a singular noun
  • #16 represents the transfer of data among data stores, sources or sinks, and processes can represent a specific piece of data – employee names or a set of data – class list – student numbers & student names detailed contents of a data flow are not shown in a DFD line can be curved or straight name consists of adjectives and a singular noun
  • #17 is a data repository is used when the system must store data because one or more processes need to use the stored data a later time only processes may connect to data stores name is a plural name consisting of adjectives and a noun
  • #18 Also known as terminators Is a person, dept, outside organization or other information system that provides data to the system or receives data from the system May be a source, a sink or both Source an external entity that supplies data Also known as origin Sink an external entity that receives data Also known as destination Is named using the singular form of the name
  • #20 A data flow diagram (DFD) of the scope of an organizational system that shows the system boundaries, external entities that interact with the system and the major information flows between the entities and the system. is a top-level view of the information system has one process symbol representing the entire information system has the external entities around the perimeter of the page use data flow to connect the external entities with the process do not show data store
  • #23 The system is represented by the large process labeled 0 (Information System). There are two external entities: Entity A (on the left) Entity B (on the right) Data flows: Entity A sends X into the system The system sends Y back to Entity A The system sends Z to Entity B
  • #30 The big process 0 from the context diagram is now split into three processes: Process 1: Process T Process 2: Process U Process 3: Process V It still includes the external entities: Entity A (left) Entity B (right) There’s a new data store D1 (Data Store N) added in this level. This shows that some data is stored in the system. Data flows: Entity A sends X into the system. Entity B receives Z from the system. Internal flows: B goes from Process 1 to Process 2. A goes from Process 2 to Process 3. The system interacts with Data Store D1 using flows M and N.
  • #38 Zooming in on Process 2 (Process U) from the Level 0 DFD. Here’s what we see: Process 2 is broken down into three sub-processes: 2.1 Process D 2.2 Process E 2.3 Process F These sub-processes interact with: Data Store D1 (Data Store N) Each other through data flows (e.g., B, G, J) Data Flows: Inputs to Process 2 (from Level 0): B and M — you see these coming into this level. Outputs from Process 2 (to Level 0): A, N, and Y — these leave the Level 1 DFD to represent output to higher levels. Internal Flows (newly visible here): C, G, H, J, K — these represent data moving between sub-processes or between a sub-process and the data store. This added detail explains how Process 2 actually works internally
  • #45 Process 2.2 (Process E) from the Level 1 DFD. This process is broken down into three smaller processes: 2.2.1 Process K 2.2.2 Process L 2.2.3 Process M Inputs and Outputs: From the Level 1 DFD, we know: Inputs to Process 2.2 are: H and K Outputs from Process 2.2 are: C and G It also interacts with Data Store D1 (N) Now, in the Level 2 DFD, we see these clearly: H goes into 2.2.2 K goes into 2.2.1 C comes from 2.2.3 G comes from 2.2.1 Process 2.2.3 interacts with Data Store D1 (N) There are also internal data flows that were not shown in Level 1, such as: Q (from 2.2.1 to 2.2.2) R (from 2.2.2 to 2.2.3) S (from 2.2.3 to 2.2.1) These show how the smaller processes pass data among themselves.
  • #52 Role of Shop Work in This Process: Trigger: When a vehicle offer is accepted, a shop work order notice is sent to the Shop Manager. Purpose: This tells the shop to prepare the vehicle for delivery, which might include: Final inspection Cleaning and detailing Minor repairs or maintenance Installing any add-ons or extras promised in the sale Storage: The actual work order details are recorded in Data Store D6: Shop Work Orders.
  • #60 Record an Offer Preconditions: The customer has selected a vehicle and is ready to make an offer. Trade-in information (if any) is available. Action: Salesperson and customer complete the offer form. Postconditions: The offer is recorded and available for manager review. Accept an Offer Preconditions: A valid offer has been recorded and submitted for approval. Action: The owner (Hal) evaluates the offer, including trade-in and vehicle costs. If acceptable, he signs it; otherwise, negotiation continues with new offers. Postconditions: The offer is approved and a formal sales process can proceed. Take Delivery Preconditions: The offer has been accepted and a sales contract has been created. Customer has arranged financing and paid the deposit. Dealer-installed options have been completed. Action: Final payment is collected. Customer signs the contract and receives keys. Postconditions: The vehicle has been delivered. Records are finalized and stored. Sales ledger is updated. Purpose of the Diagram It illustrates the logical flow and dependencies between the steps. Preconditions and postconditions help define what must be true before and after each step. This structure helps analysts and developers design use cases and system interactions clearly and correctly.
  • #61 The image (Figure 4-9: Major Use Cases with Basic Information) shows three high-priority use cases that are part of the business process of selling a vehicle at Holiday Travel Vehicles. Each use case includes key elements such as actor, description, trigger, type, and preconditions. Use Case: Record an Offer ID: UC-3 Actor: Salesperson Description: Describes how the salesperson records a customer's offer on a vehicle. Trigger: The customer decides to make an offer on a vehicle. Type: External and Temporal Preconditions: Salesperson is authenticated (logged in/authorized). Pending offers datastore is available and online. Vehicle inventory datastore is available and online. This step begins when a customer selects a vehicle and wants to make an offer, which includes price and trade-in details. The salesperson enters this into the system. Use Case: Evaluate an Offer ID: UC-4 Actor: Sales Manager Description: Describes how the sales manager evaluates the offer, either accepting it or suggesting a revision. Trigger: A pending offer is created and the sales manager is notified. Type: External and Temporal Preconditions: Sales manager is authenticated. The pending offer is stored and accessible in the Pending Offers datastore. This use case covers the negotiation and approval phase. The manager decides whether the offer is acceptable, potentially referencing trade-in value guides or cost data. Use Case: Take Delivery ID: UC-5 Actor: Salesperson Description: Describes how the salesperson completes the vehicle sale with the customer. Trigger: Customer has made the final payment. Type: External and Temporal Preconditions: Salesperson is authenticated. Sales contract is complete. This is the final step in the process. It includes collecting payment, giving the customer keys, reviewing the vehicle, and finalizing documentation. Summary These use cases provide a clear, structured model of the sales process, including: Offer creation Offer evaluation and negotiation Final sale and delivery They help system developers understand the roles, system interactions, and data requirements involved in each business activity.
  • #68 This context diagram provides a high-level view of the Holiday Travel Vehicles Sales System, showing how it interacts with external entities through data flows. Here's a clear breakdown of each part of the diagram: External Entities Salesperson Sends: Offer details → to the system Receives: Offer rejection notice New sales contract Customercontracts Sends: Customer payments Receives: Pending offer New sales contract Final sales contract Shop Manager Receives: Shop work order notice from the system (used to prepare or modify vehicles) Owner/Manager Receives: Pending offer notice Sends: Offer decision (likely approving or rejecting offers) Key Data Flows From System to Entities: Offer rejection notice, New sales contract, Final sales contract, Shop work order notice, Pending offer notice From Entities to System: Offer details, Customer payments, Offer decision
  • #69 This diagram is a DFD fragment—a part of a larger DFD—specifically representing the “Record Offer” process (Process 3) in the Holiday Travel Vehicles Sales System. Process 3: Record Offer This process captures and records an offer made by a customer to purchase a vehicle. The process receives inputs, accesses data stores, and produces several outputs. External Entities and Data Flows 1. Salesperson Sends: Vehicle ID – to identify the vehicle being offered. Offer pending notice – a notification that a pending offer is being made. Offer details – includes pricing, terms, etc. 2. Customer Receives: Pending offer – a copy of the offer they submitted. Offer confirmation – acknowledgment of the offer being recorded. Offer summary – summary of offer details. Sends: Customer details – such as name, contact info, etc. 3. Owner/Manager Receives: Pending offer notice – alert to evaluate the new offer. Data Stores Accessed D1: New Vehicles Read: Retrieves Vehicle details based on the Vehicle ID. D2: Pending Offers Read: To compare with Existing pending offer. Write: To save New pending offer. D3: Rejected Offers Read: Pulls Previous offer details for reference/history.
  • #70 This process evaluates a pending offer and decides whether to accept or reject it, update records, and notify relevant stakeholders. External Entities & Interactions Owner/Manager Sends: Vehicle ID, Offer decision Receives: Pending offer, Offer decision Salesperson Sends: Pending offer ID Receives: Offer rejection notice, New sales contract Customer Sends: Deposit Receives: New sales contract Shop Manager Receives: Shop work order notice Data Stores Interacted With D1 – New Vehicles: Provides Vehicle details. D2 – Pending Offers: Supplies Pending offer and stores updated versions. D3 – Rejected Offers: Stores Rejected offer. D4 – Accepted Offers: Stores New accepted offer. D5 – Sales Contracts: Stores the finalized New sales contract. D6 – Shop Work Orders: Stores instructions for vehicle preparation (Shop work order). D7 – Deposits: Stores customer Purchase deposit.
  • #71 External Entities: Salesperson Provides: Sales contract ID to the system. Sales contract for validation. Receives: Confirmation of payment verification. Customer Provides: Final payment Acceptance of the vehicle and terms. Receives: The Final sales contract. Data Stores: D5: Sales Contracts – Used to retrieve the original sales contract. D8: Final Sales Contracts – Stores the finalized, signed sales contract. D9: Payments – Records the customer's final payment. Flow of Information: Salesperson sends the sales contract ID and sales contract to the system. Customer provides final payment and confirms acceptance of the vehicle. The system verifies the payment and sends this verification to the salesperson. The system records: The final payment in D9: Payments. The finalized contract in D8: Final Sales Contracts. The customer receives the finalized sales contract. Purpose of the Process: This process ensures that: The customer has paid in full. Legal documents (final contract) are properly handled. The vehicle is officially delivered with confirmation from both parties.
  • #73 Main Processes in This Diagram: Process 3 – Record Offer Triggered when a salesperson submits a vehicle offer from a customer. Captures offer and customer details. Stores them in D2: Pending Offers. Process 4 – Evaluate Offer The Owner/Manager reviews pending offers. Can approve (resulting in a new sales contract and deposit) or reject them. Updates: D4: Accepted Offers D3: Rejected Offers Sends a shop work order if accepted (via D6). Process 5 – Take Delivery of Vehicle Triggered when a customer returns for delivery. Accepts final payment, confirms acceptance, and stores the final contract in: D8: Final Sales Contracts D9: Payments Data Stores: D1 – New Vehicles: Vehicle details inventory. D2 – Pending Offers: Stores customer offers awaiting review. D3 – Rejected Offers: Stores denied offers. D4 – Accepted Offers: Stores approved offers. D5 – Sales Contracts: Initial sales contracts. D6 – Shop Work Orders: Work orders for vehicle prep. D7 – Deposits: Initial payments on accepted offers. D8 – Final Sales Contracts: Finalized and signed contracts after payment. D9 – Payments: Final full payments from customers. 👤 External Entities: Salesperson: Starts the offer process and later participates in verifying contracts. Customer: Submits the offer, makes deposits and final payment, and receives the vehicle. Owner/Manager: Approves or rejects offers. Shop Manager: Receives work orders when vehicles are accepted. Process Flow Summary: Salesperson records a customer’s offer → stored in Pending Offers. Manager evaluates the offer: If accepted → Accepted Offers, Deposit, Shop Work Order. If rejected → Rejected Offers. Contract created and stored → Sales Contracts. Customer makes final payment, accepts delivery → updated in Final Contracts and Payments.
  • #75 Title: Record Offer (Process 3) Level 1 DFD Main Purpose: It shows the detailed flow of how an offer is recorded, starting from a salesperson’s input through to storing the pending offer. External Entities: Salesperson Customer Owner/Manager Processes (Blue Rounded Rectangles) Each of these subprocesses begins with “3.” because it’s a decomposition of Process 3 from the Level 0 DFD. Process Name Function 3.1 Check for Pending Offers Checks if there are any existing offers for the vehicle. 3.2 Determine Offer Type Decides if the offer is new or a revision based on input. 3.3 Create Revised Offer Used if the offer is a revision (based on earlier rejected offer). 3.4 Create New Offer Creates a new offer using customer and vehicle details. 3.5 Finalize Offer Completes offer by refining and finalizing offer terms. 3.6 Confirm Offer Salesperson confirms the completed offer with the customer. 3.7 Create Pending Offer Final offer is stored as a pending offer and a notice is sent to the manager. Data Flows (Arrows) These represent movement of data between processes, data stores, and external entities. Examples: From Salesperson to 3.1: Vehicle ID From 3.1 to D2: Pending Offers: to check existing pending offers From 3.2 to 3.3 or 3.4: based on offer type (revised or new) From 3.6 to Customer: Offer confirmation From 3.7 to Owner/Manager: Pending offer notice Data Stores (Rectangles with open ends) D1: New Vehicles – Supplies vehicle details to process 3.4 D2: Pending Offers – Checked during process 3.1 D3: Rejected Offers – Used to revise offers in process 3.3 👥 External Entities (Rectangles) Salesperson – Initiates offer process and confirms it Customer – Provides information, receives confirmation Owner/Manager – Receives notice of the pending offer Flow Summary Salesperson starts by submitting a Vehicle ID. System checks for existing pending offers (3.1). Based on the result, system determines if it’s a new or revised offer (3.2). If revised, it pulls from Rejected Offers (D3) (3.3); if new, it pulls vehicle and customer data (3.4). The offer is finalized (3.5), then confirmed by salesperson (3.6), and then recorded as pending (3.7). A pending offer notice is sent to the Owner/Manager.
  • #76 This diagram shows how the company reviews a sales offer for a vehicle, and what happens if the offer is accepted or rejected. Who Is Involved? Owner/Manager – Decides if the offer is accepted or rejected. Salesperson – Gets told if an offer is rejected. Customer – Gets a contract and pays a deposit if the offer is accepted. Shop Manager – Prepares the vehicle after a sale. Main Steps Accept Offer Decision (4.1) The manager checks the pending offer and vehicle info. They decide whether to accept or reject the offer. If Rejected → Prepare Offer Rejection (4.2) The reason is written down. The salesperson is notified. The offer is saved in the Rejected Offers file. If Accepted → Process Accepted Offers (4.3) A sales contract is created and sent to the customer. The customer makes a deposit. A shop order is sent to the shop manager to prepare the vehicle. All info is saved in the system. Where Information Is Stored Pending Offers – Checked and removed after decision. Rejected Offers – Stores rejected ones. Accepted Offers – Stores accepted ones. Sales Contracts – Stores official agreements. Deposits – Stores payments from customers. Shop Work Orders – Stores instructions for the shop.
  • #77 This is a more detailed look at what happens when an offer is accepted for a vehicle sale. It breaks down Process 4.3 from the previous diagram into four smaller steps. Main Steps 4.3.1 Create Accepted Offer Takes accepted offer details from the previous process. Saves the offer in the Accepted Offers file. Passes shop work details for the next step. 4.3.2 Prepare Sales Contract Uses vehicle details and customer information. Creates a new sales contract for the vehicle. Sends the contract to the customer and salesperson. Saves it in the Sales Contracts file. 4.3.3 Prepare Shop Work Order Uses the offer details to create a shop work order. Sends the work order to the shop manager. Saves it in the Shop Work Orders file. 4.3.4 Record Deposit Takes the deposit from the customer. Records it in the Deposits file. Who Is Involved? Customer – Receives the sales contract and pays the deposit. Salesperson – Gets a copy of the sales contract. Shop Manager – Gets a work order to prepare the vehicle. Where Info Is Stored? Accepted Offers (D4) – Stores approved offers. Sales Contracts (D5) – Stores signed contracts. Shop Work Orders (D6) – Stores vehicle prep tasks. Deposits (D7) – Stores payment info.
  • #78 This diagram explains what happens when the customer takes delivery of a vehicle. It ensures that: The customer accepts the vehicle. The final payment is made. The final sales contract is completed. Main Steps 5.1 Retrieve Sales Contract The salesperson provides the sales contract ID. The system pulls the sales contract from storage (D5). 5.2 Process Customer Acceptance The customer provides: Their final payment. Acceptance of the vehicle. The system: Verifies payment. Records acceptance. Sends final payment to Payments (D9). Produces a completed sales contract. 5.3 Produce Final Sales Contract Takes the completed sales contract. Generates a final version for the customer. Saves it in Final Sales Contracts (D8). Gives a copy to the customer. Who Is Involved? Customer – Accepts the vehicle, makes payment, receives the final contract. Salesperson – Helps retrieve the original sales contract. Where Info Is Stored? D5 Sales Contracts – Stores original contracts. D9 Payments – Stores final payments. D8 Final Sales Contracts – Stores completed sales contracts.
  • #95 Use Case: Book Service Appointment Entities: Customer Activities: Provide vehicle info Select service date/time Receive confirmation Use Case: Process Payment Entities: Cashier Activities: Retrieve bill Accept payment (cash/card) Generate receipt Data Stores: D1: Customer Records D2: Vehicle Records D3: Service History D4: Bills D5: Payments Context Diagram: External Entities: Customer, Mechanic, Manager One process: "Garage Management System" Data Flows: Service request, Confirmation, Payment details, Reports Level 0 Diagram: Processes: 1.0 Manage Appointments 2.0 Manage Vehicle Check-In 3.0 Manage Service 4.0 Manage Billing 5.0 Manage Payment Show data flows between processes and data stores Level 1 Example (for 3.0 Manage Service): 3.1 Assign Mechanic 3.2 Perform Service 3.3 Update Service Record
  • #96 Activities per Use Case (scenarios): Use Case: Initiate Exchange Transaction Actor: Teller Activities: Enter source and target currency Input amount System calculates exchange value and fee Present summary for confirmation Use Case: Register Customer Actor: Teller Activities: Enter ID and personal details Store into customer database Data Stores: D1: Customer Info D2: Currency Rates D3: Transaction Records D4: Receipts Context Diagram: One process: "Currency Exchange System" External Entities: Customer, Admin, Financial Institution Data Flows: Exchange request, Currency rates, Transaction confirmation Level 0 Diagram: Processes: 1.0 Register Customer 2.0 Manage Currency Info 3.0 Process Transaction 4.0 Generate Reports Level 1 Example (for 3.0 Process Transaction): 3.1 Validate Input 3.2 Calculate Exchange 3.3 Save Transaction 3.4 Print Receipt