Download as PDF, PPTX

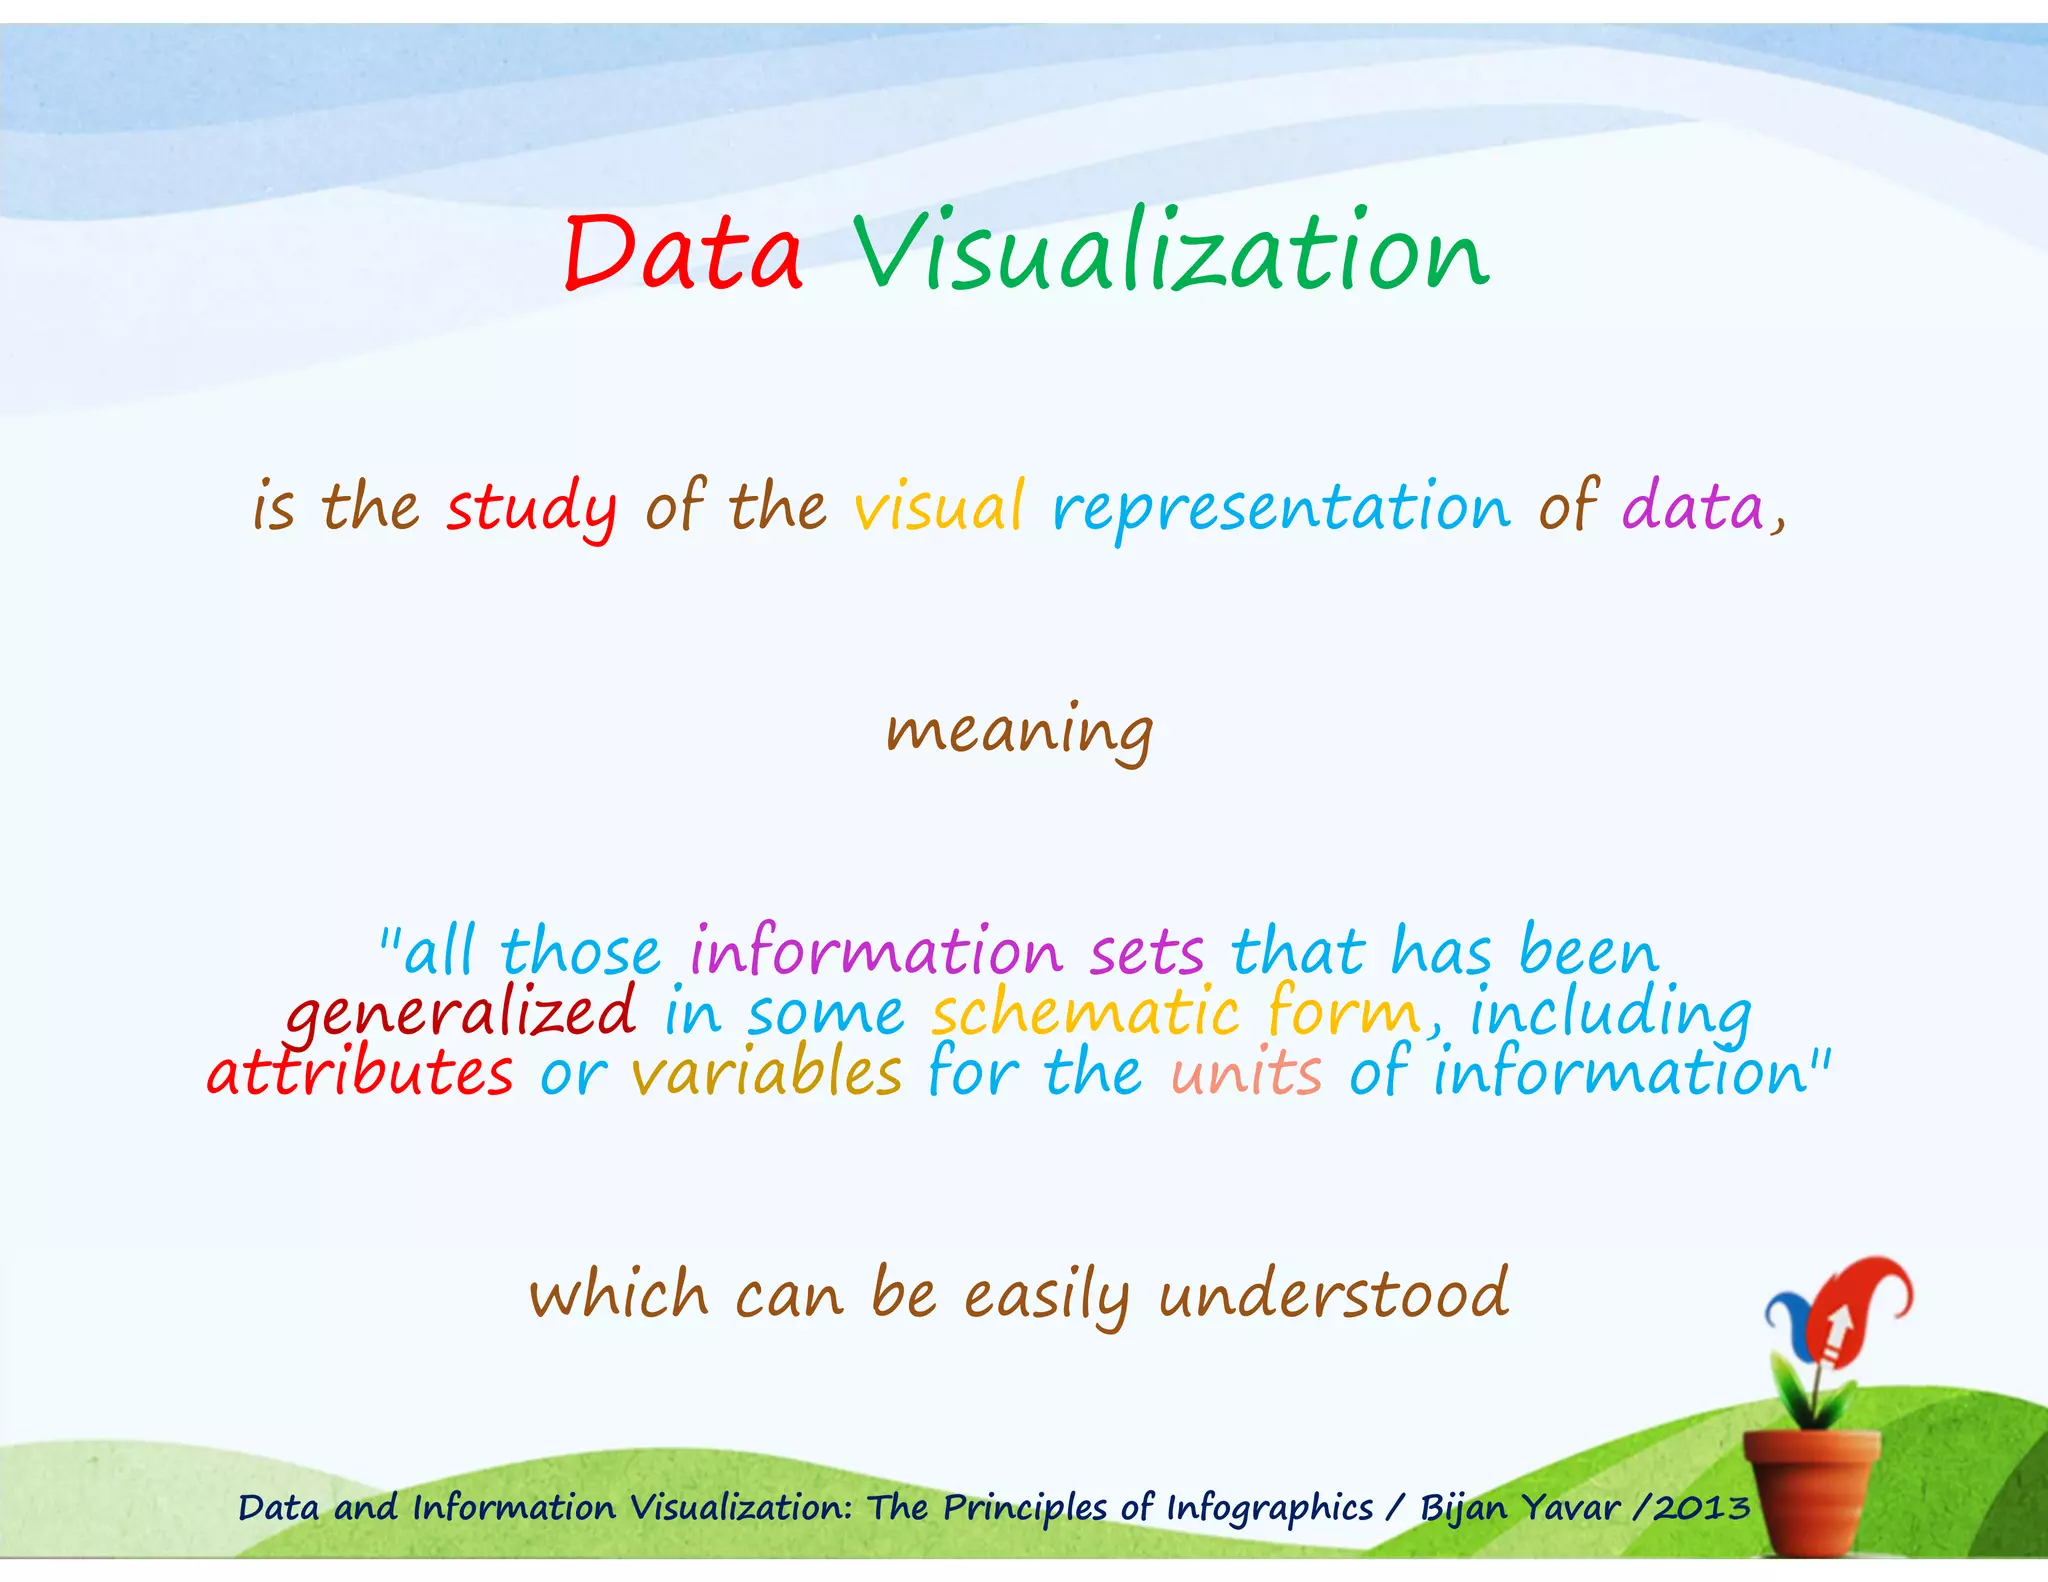
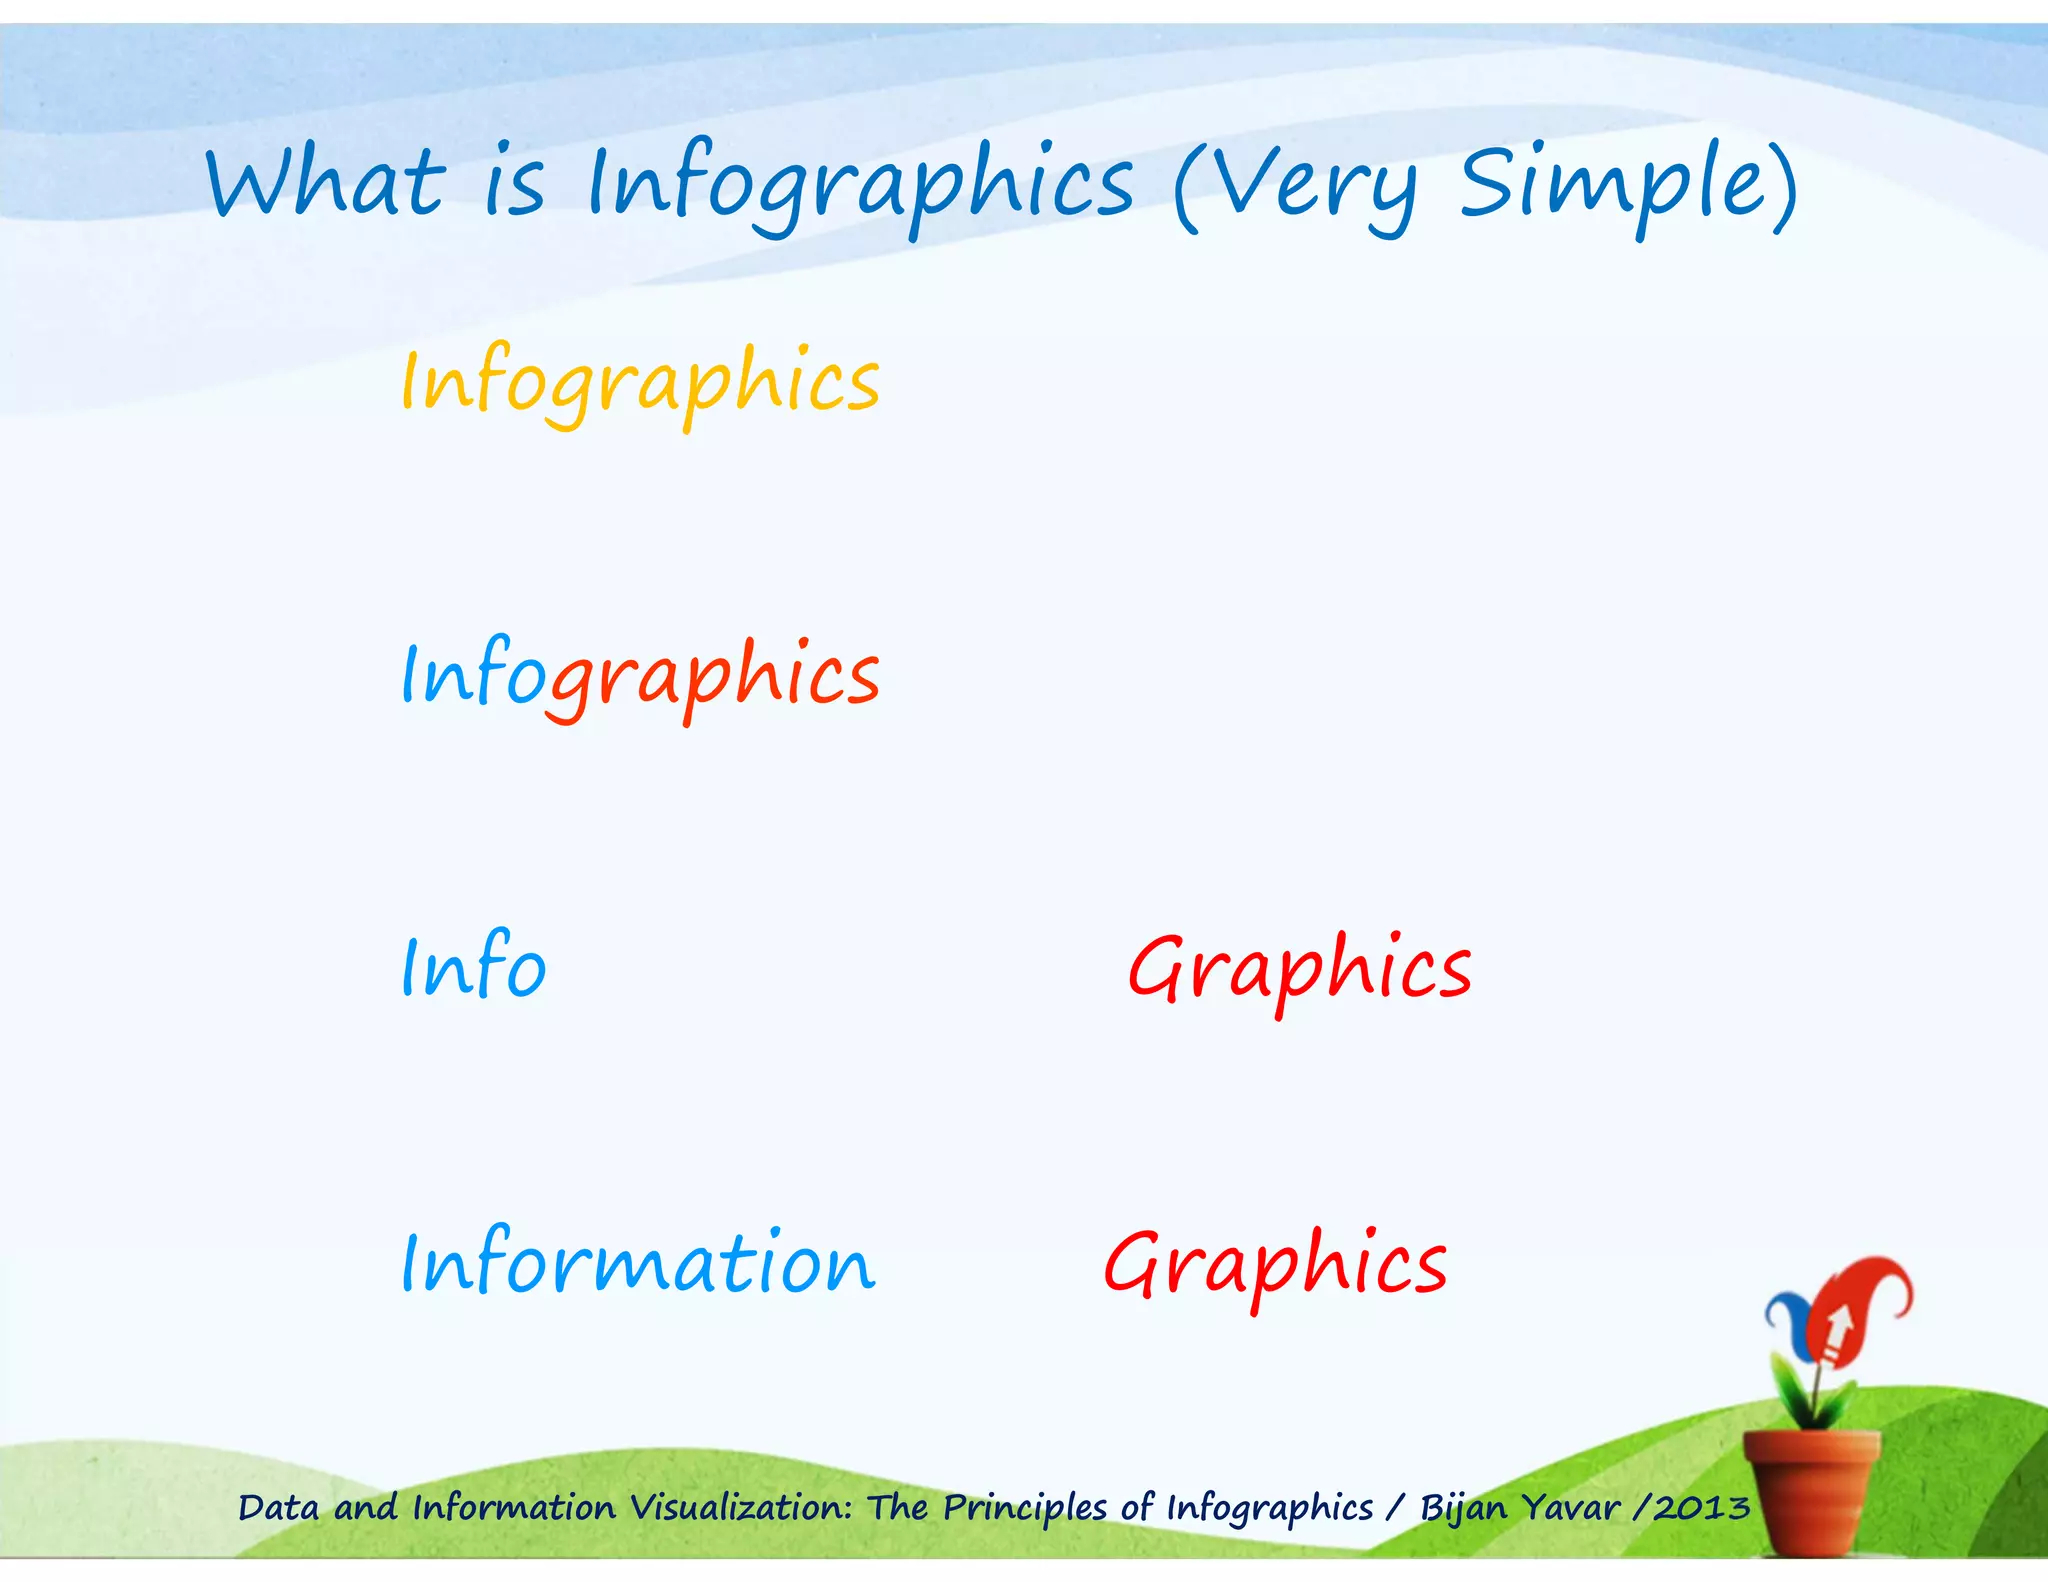
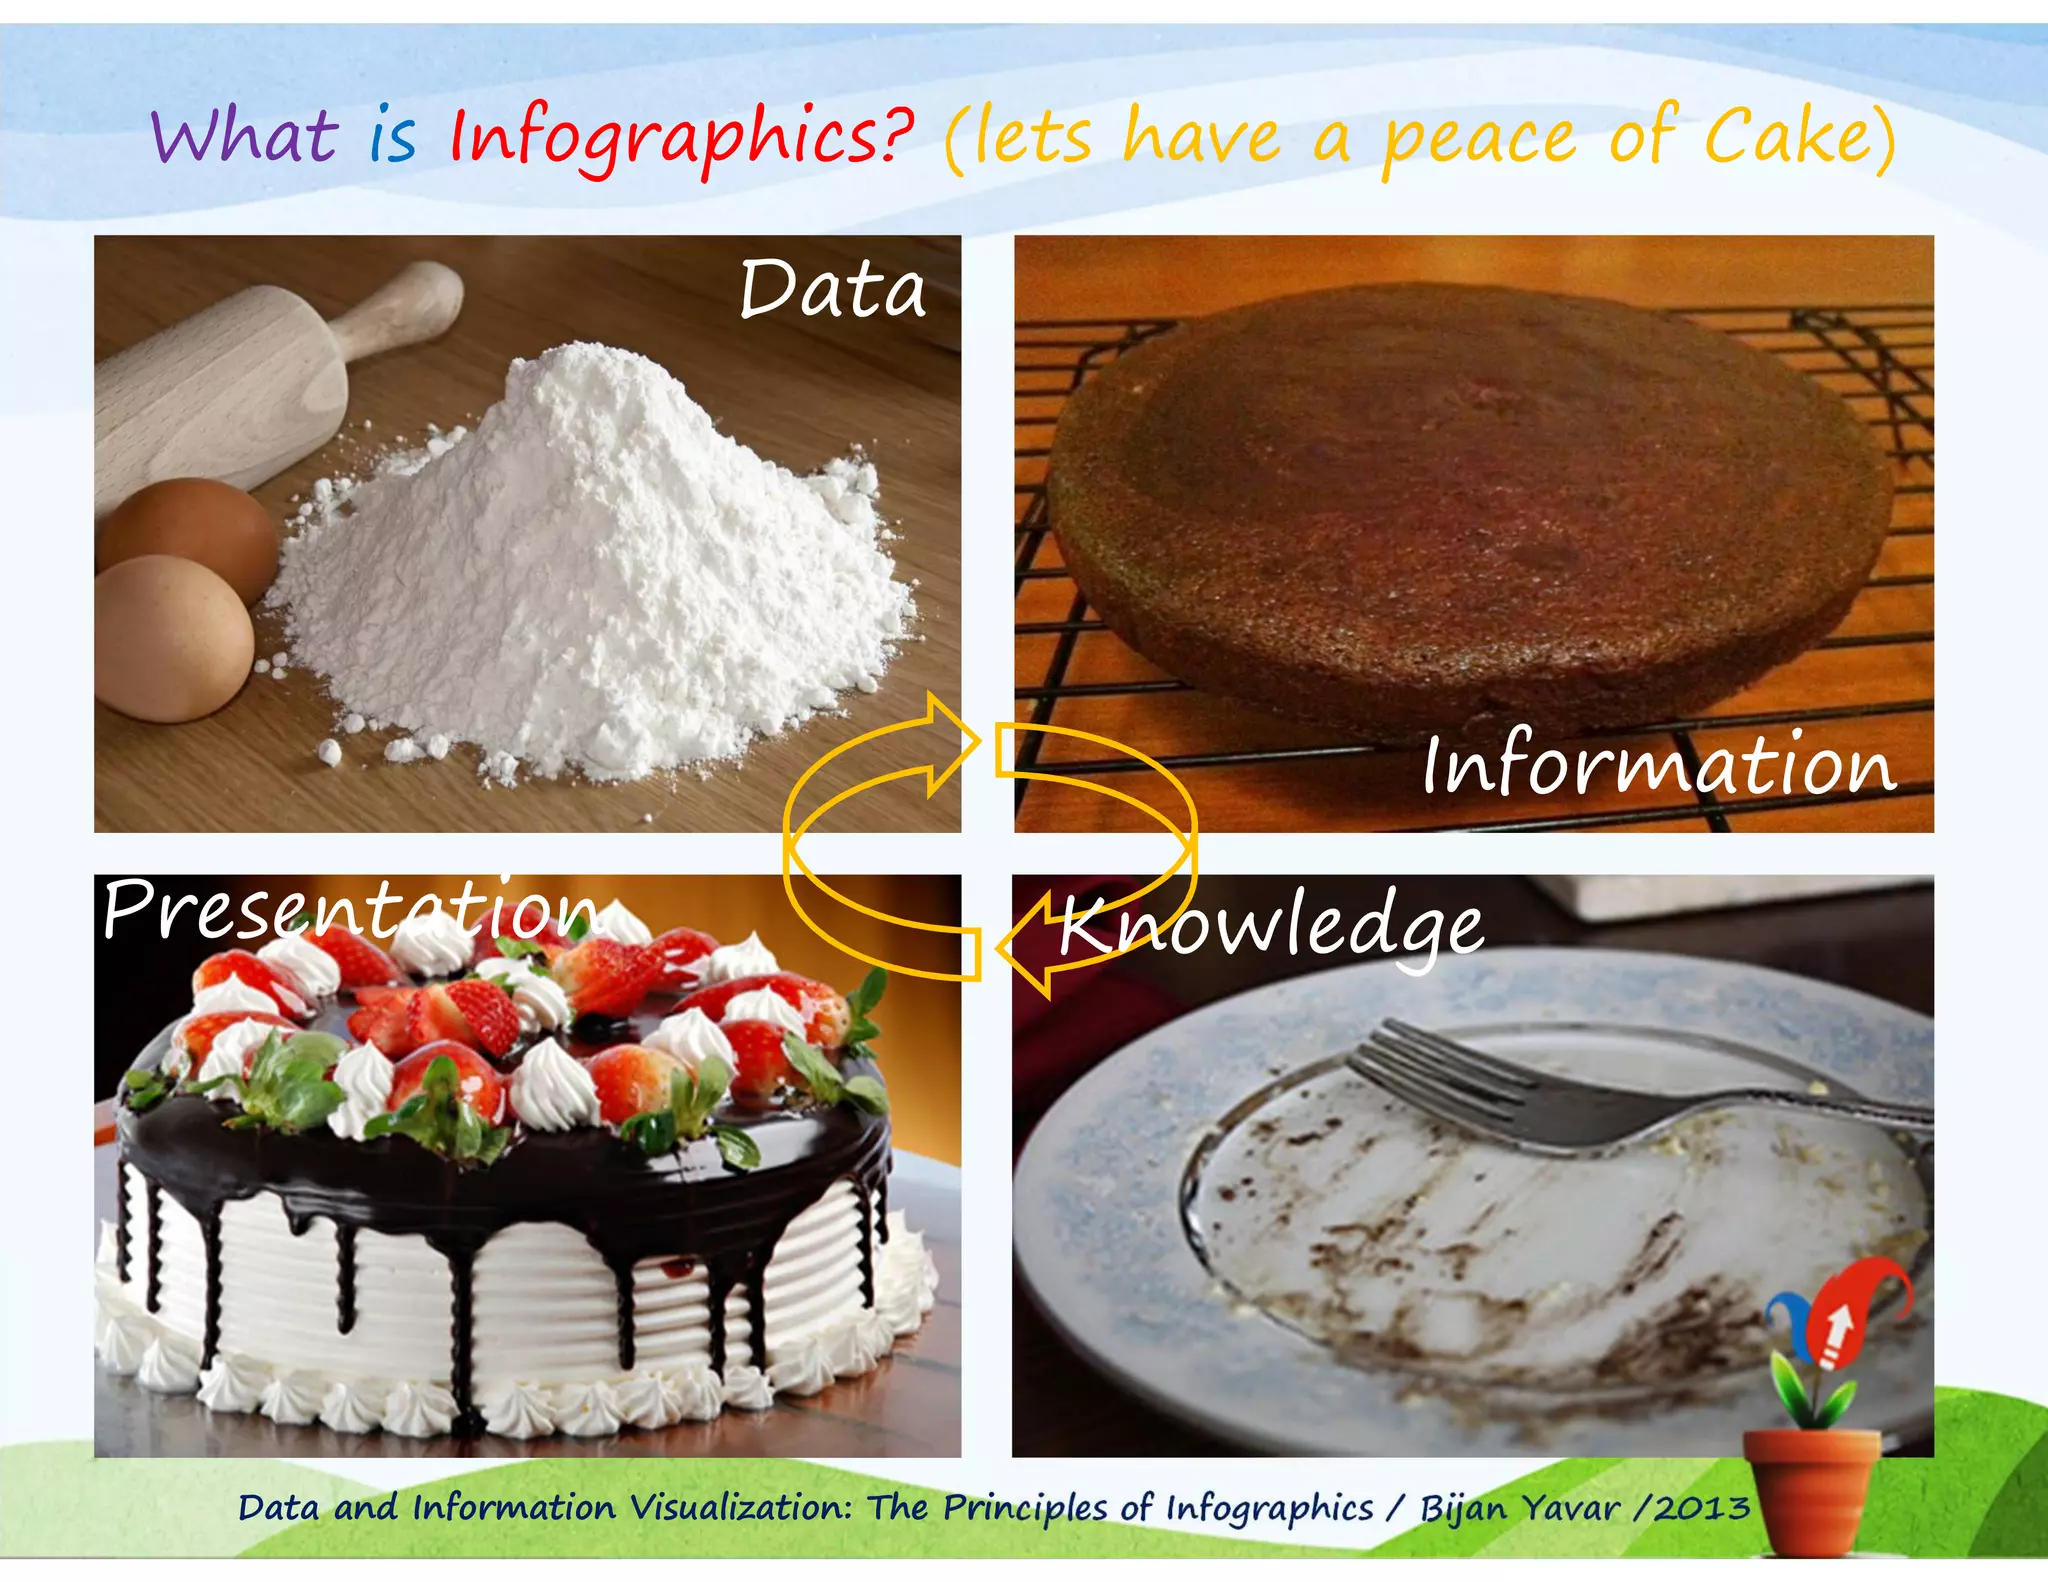
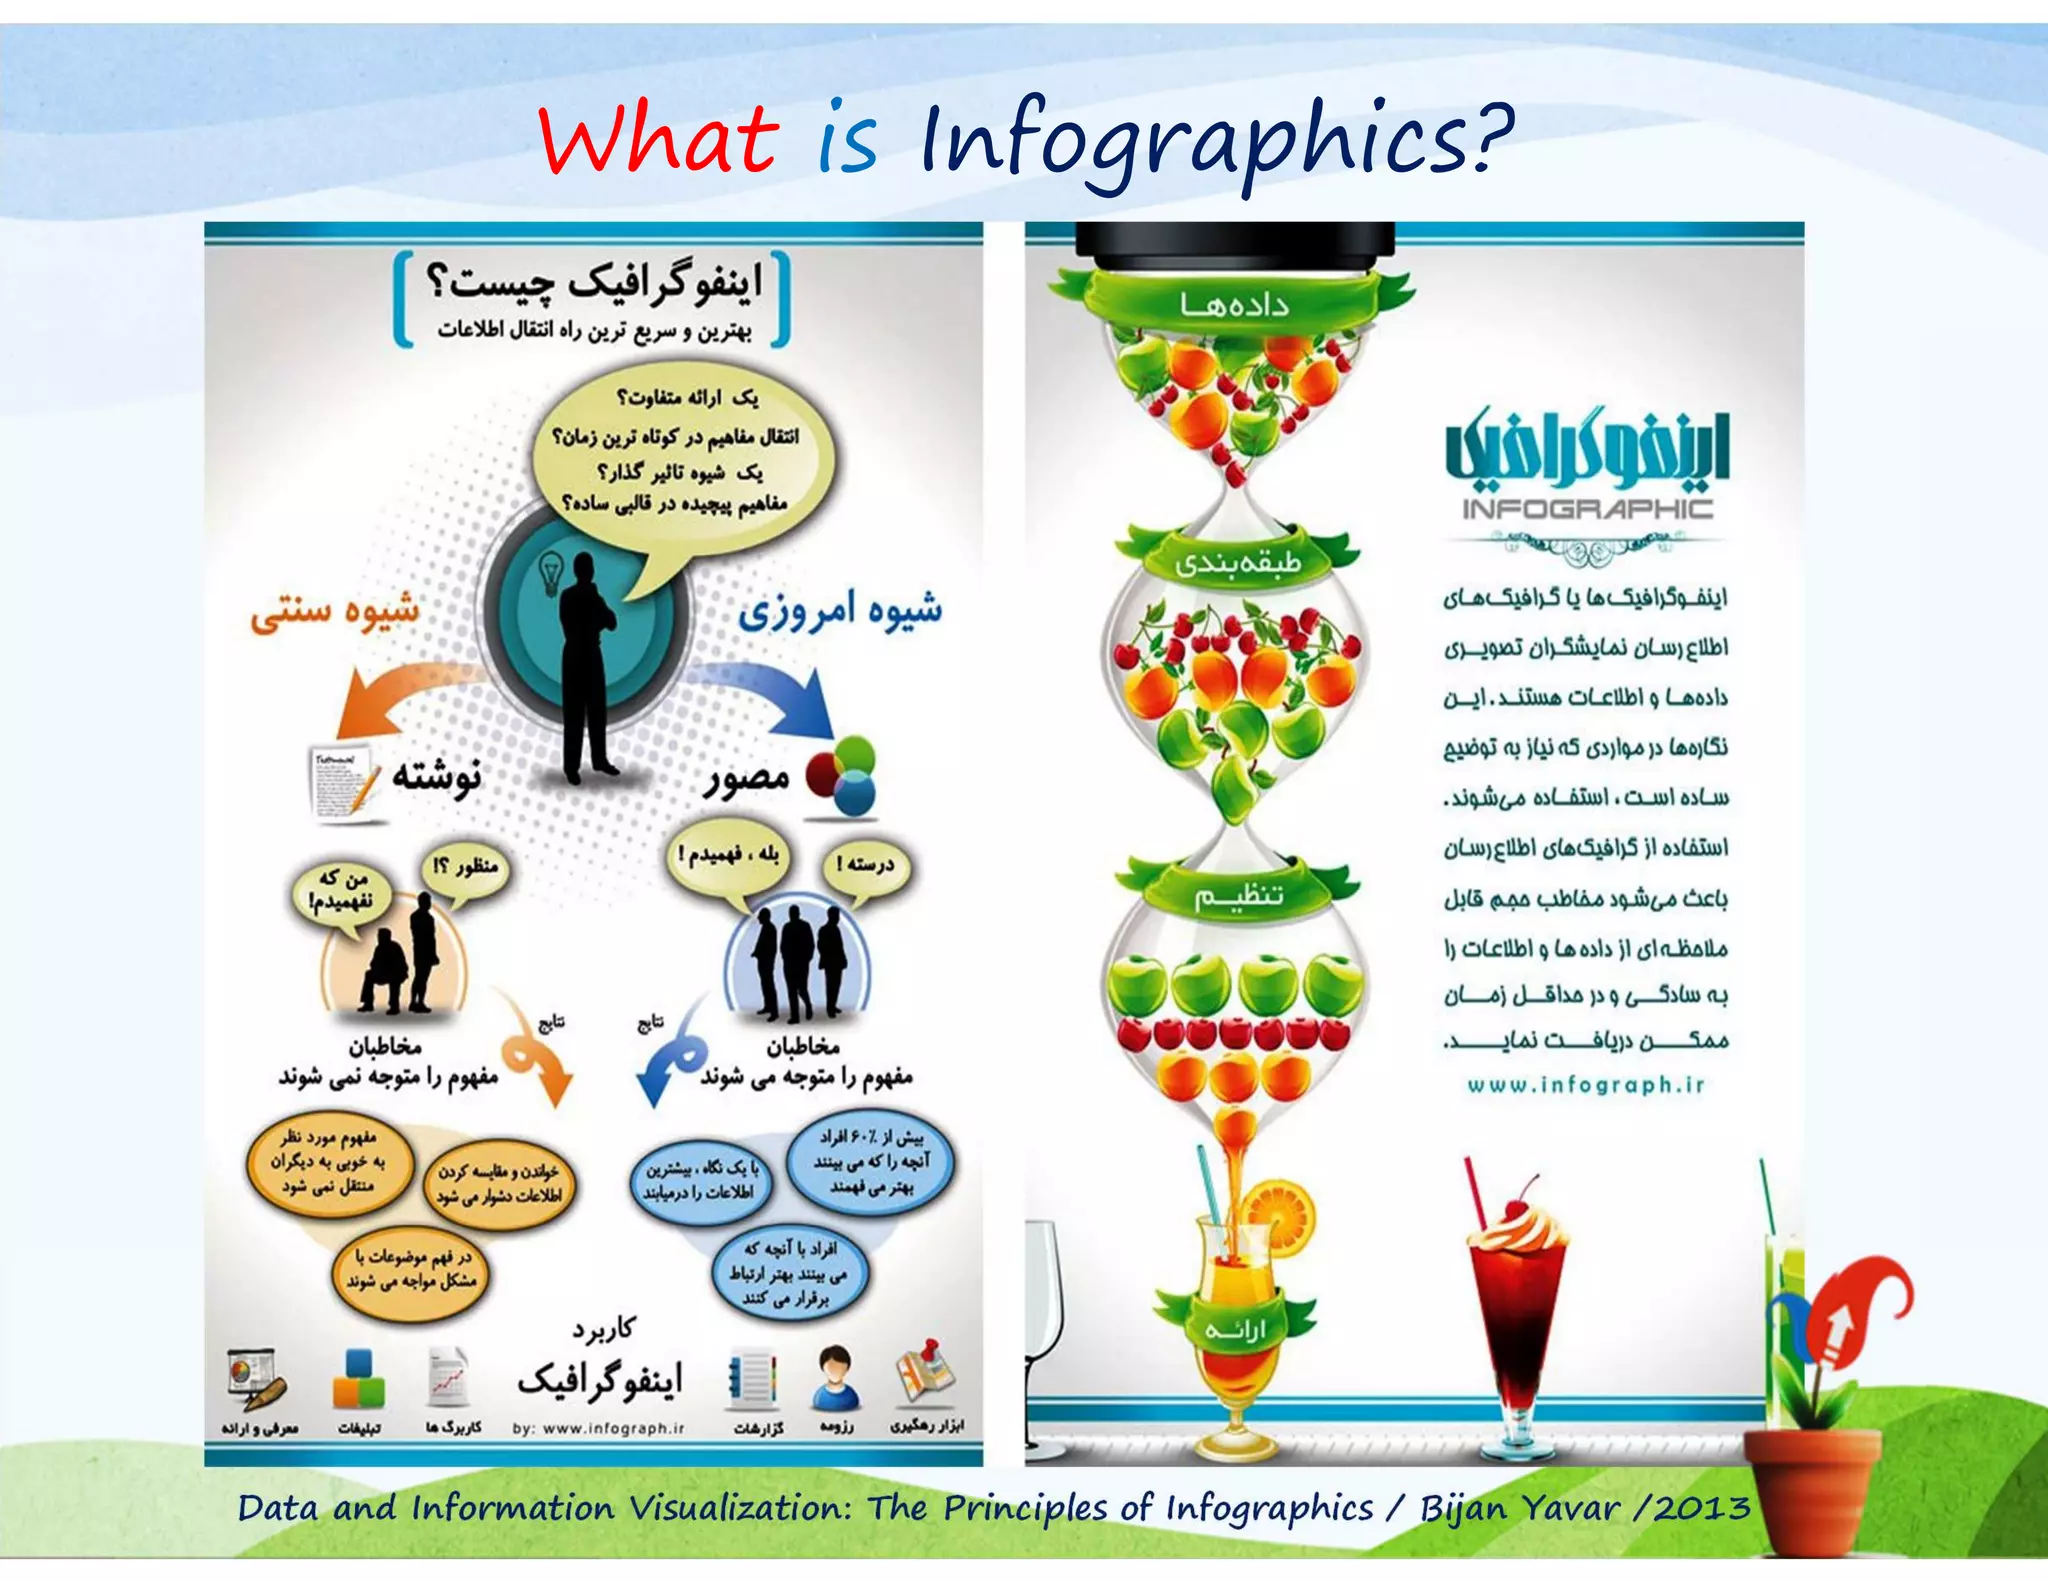
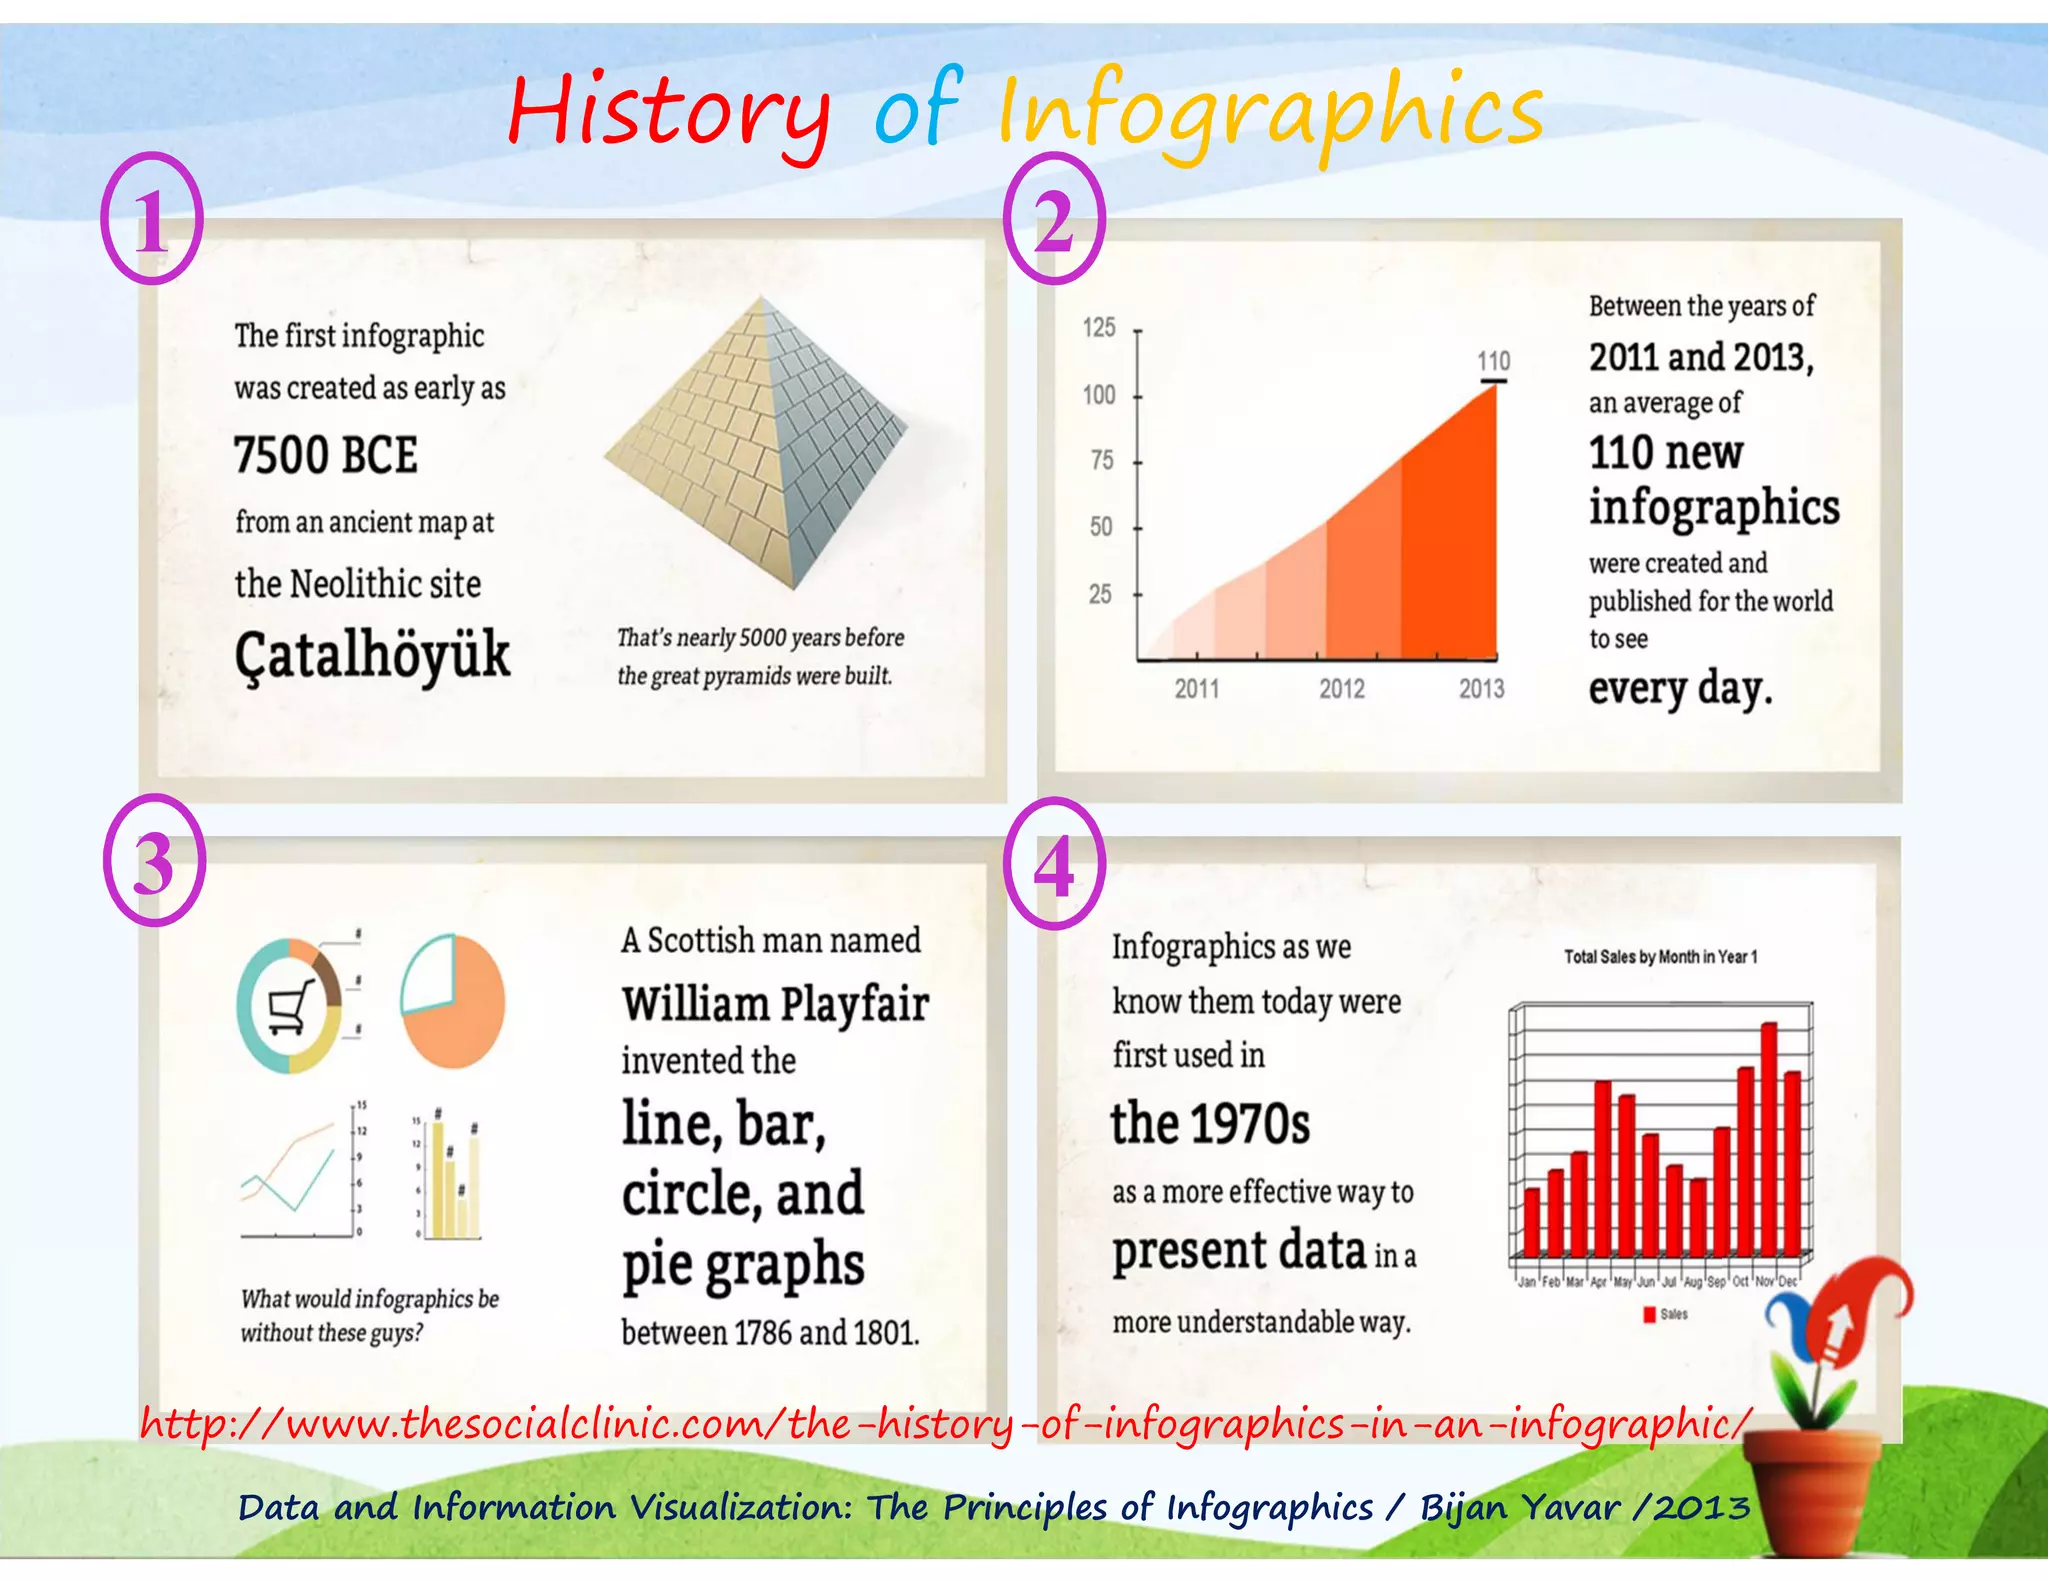
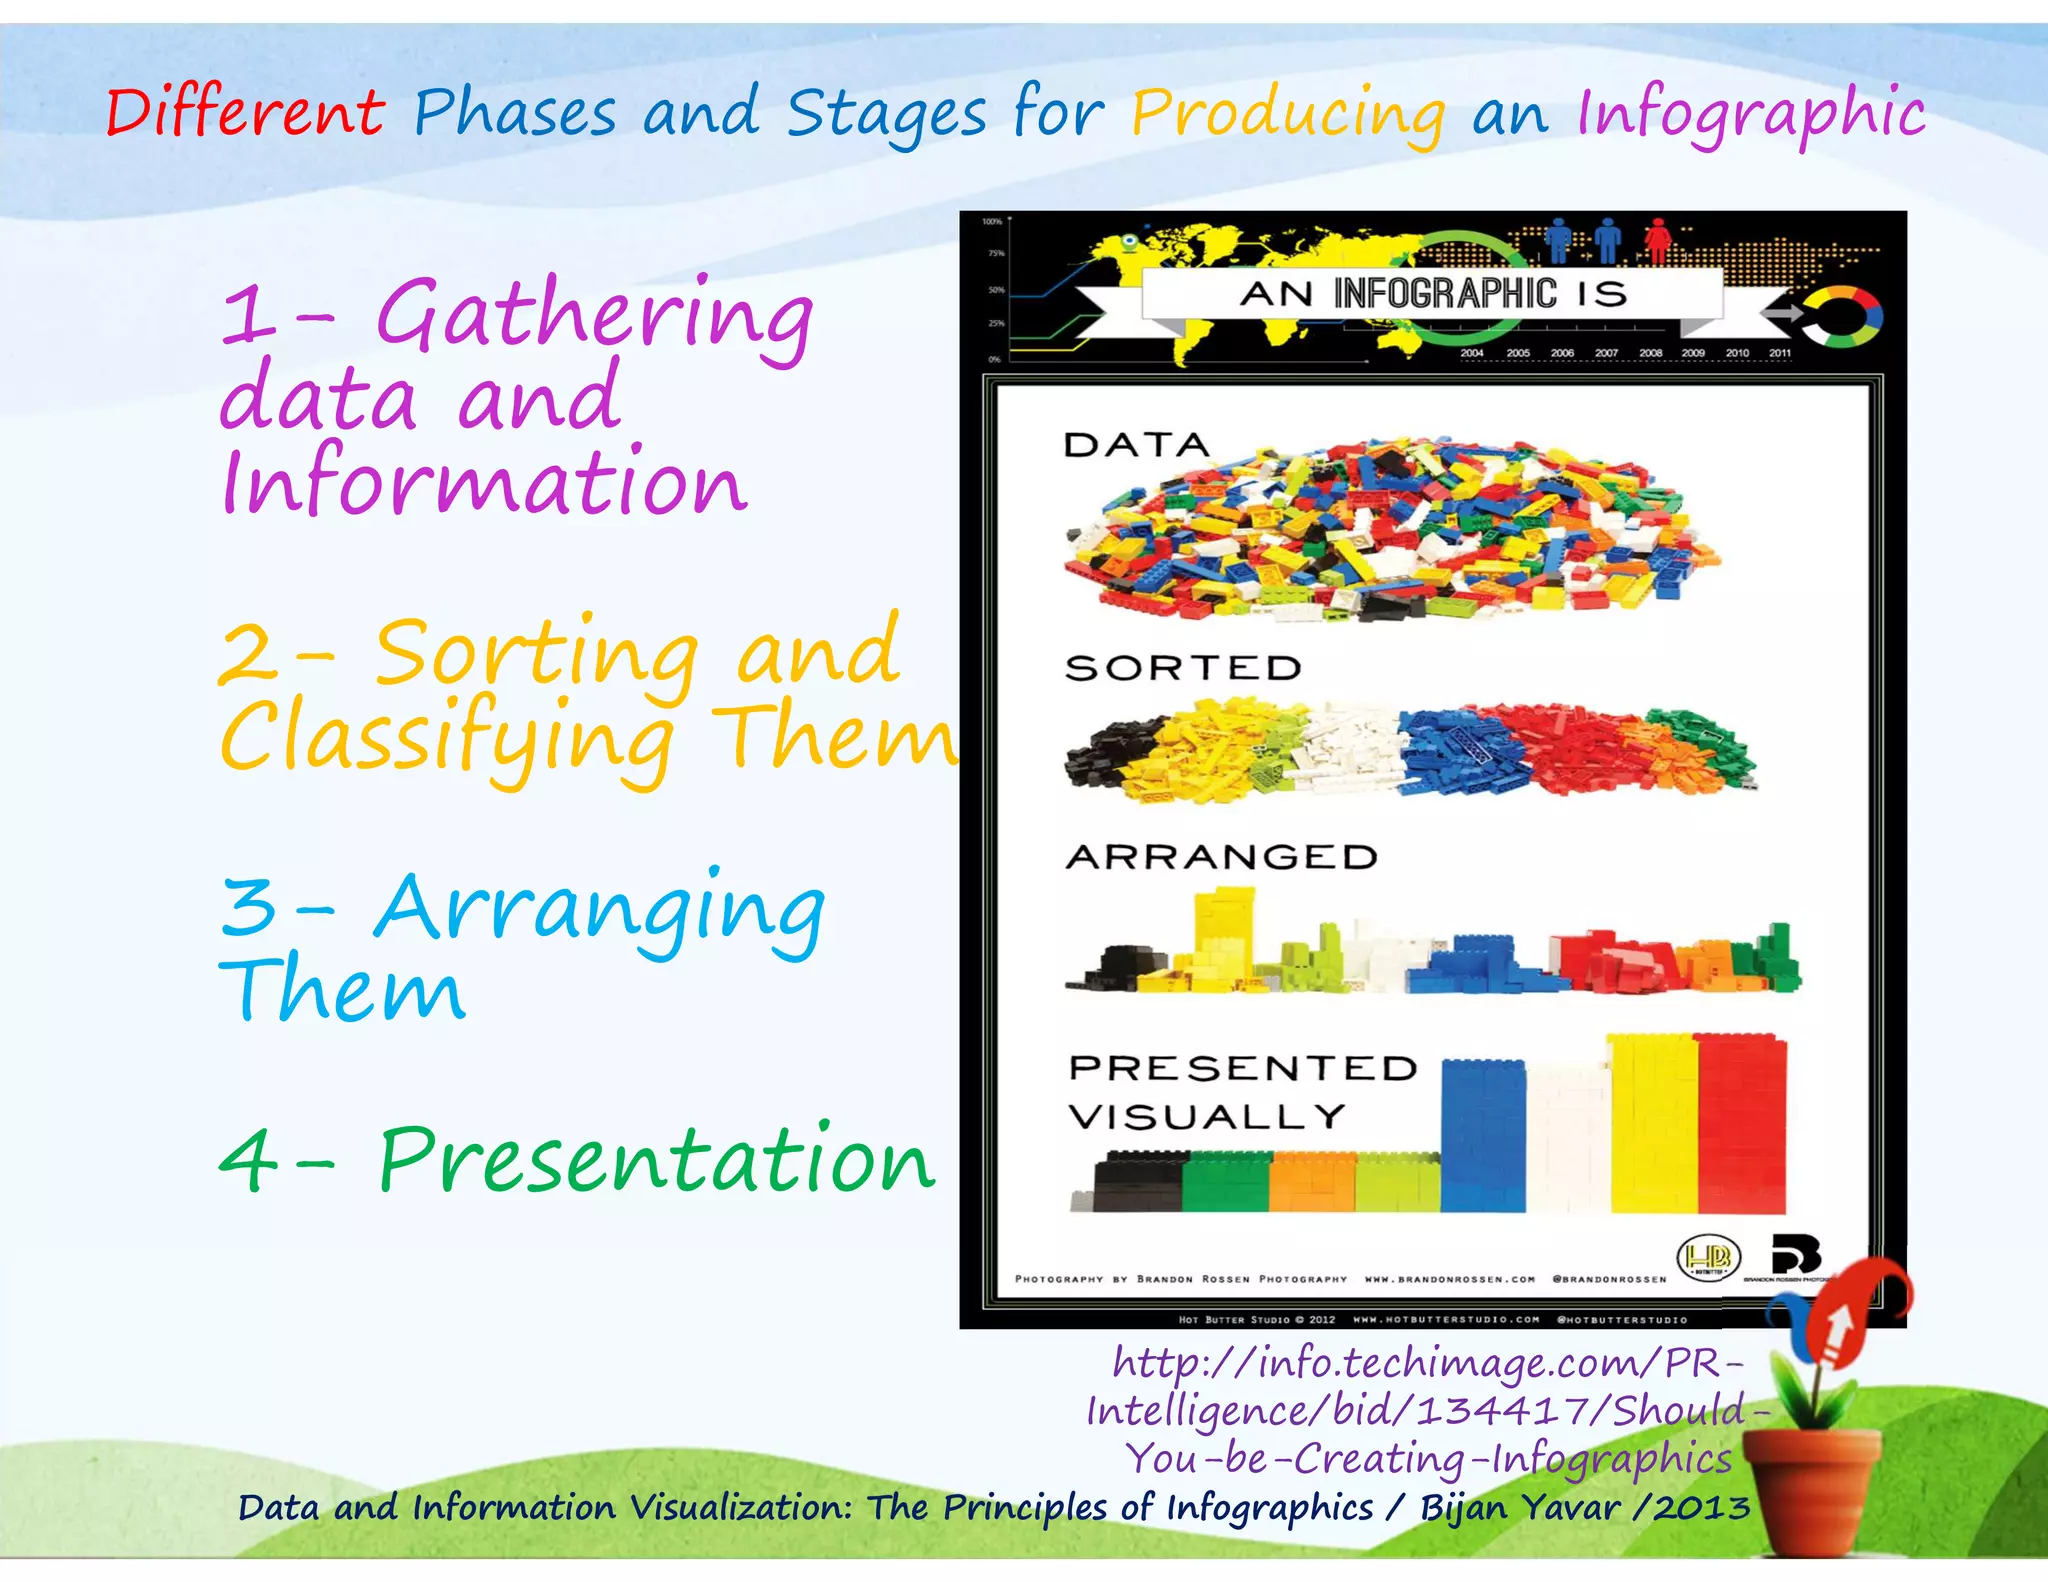
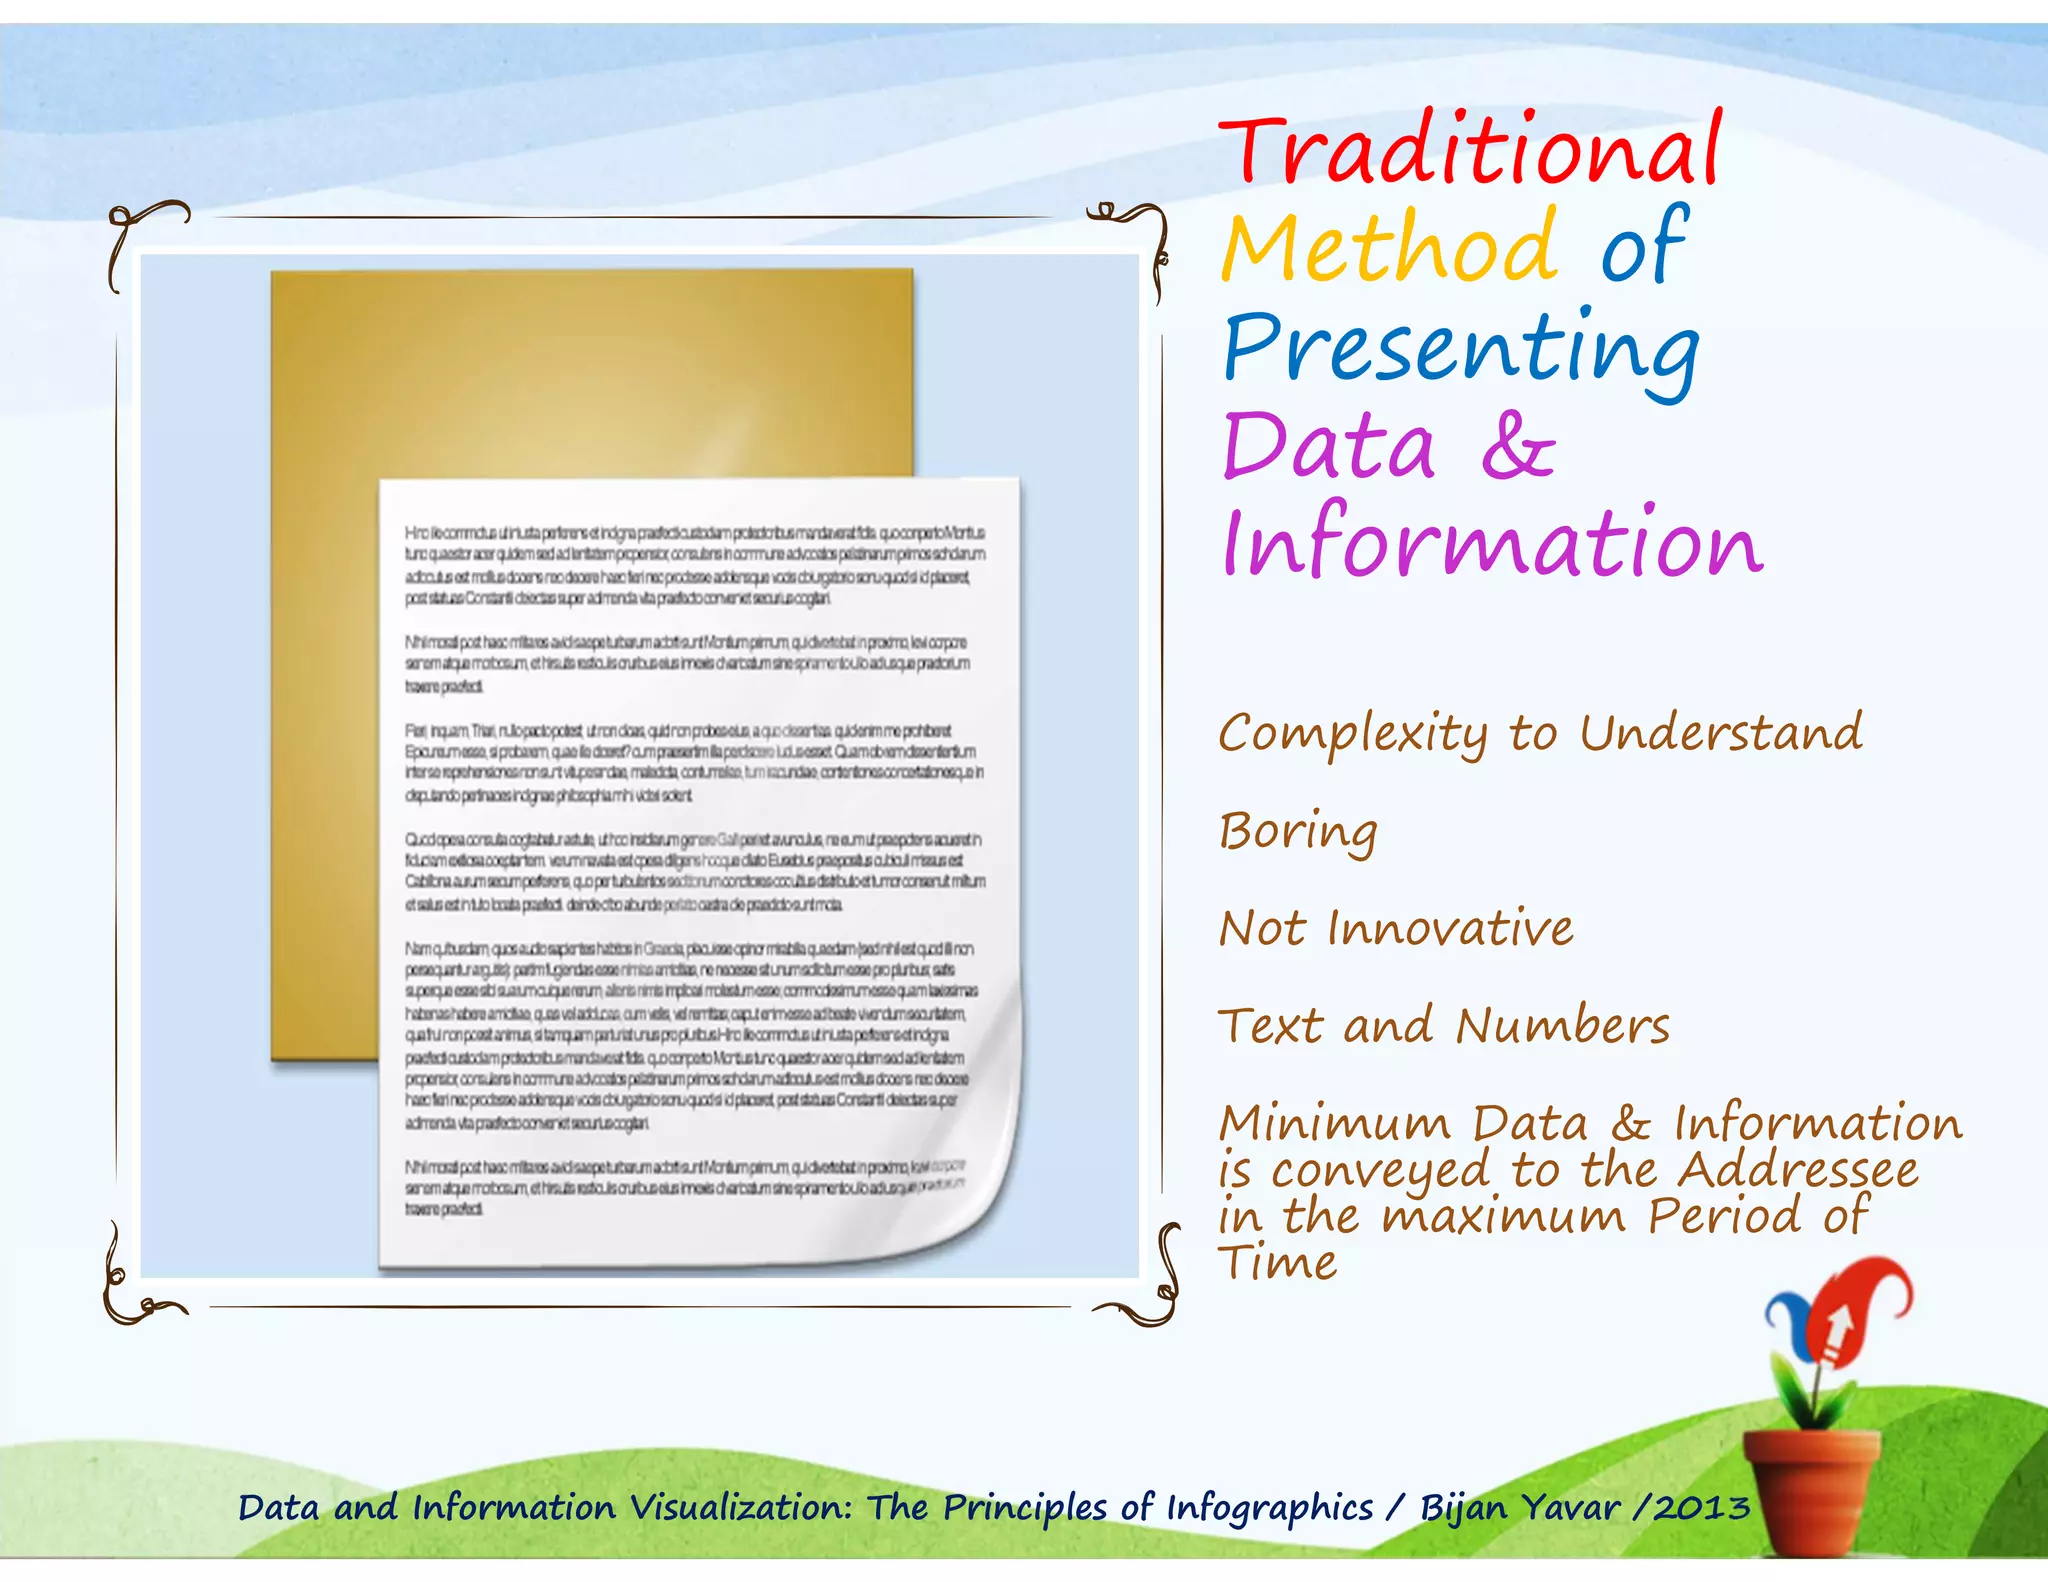
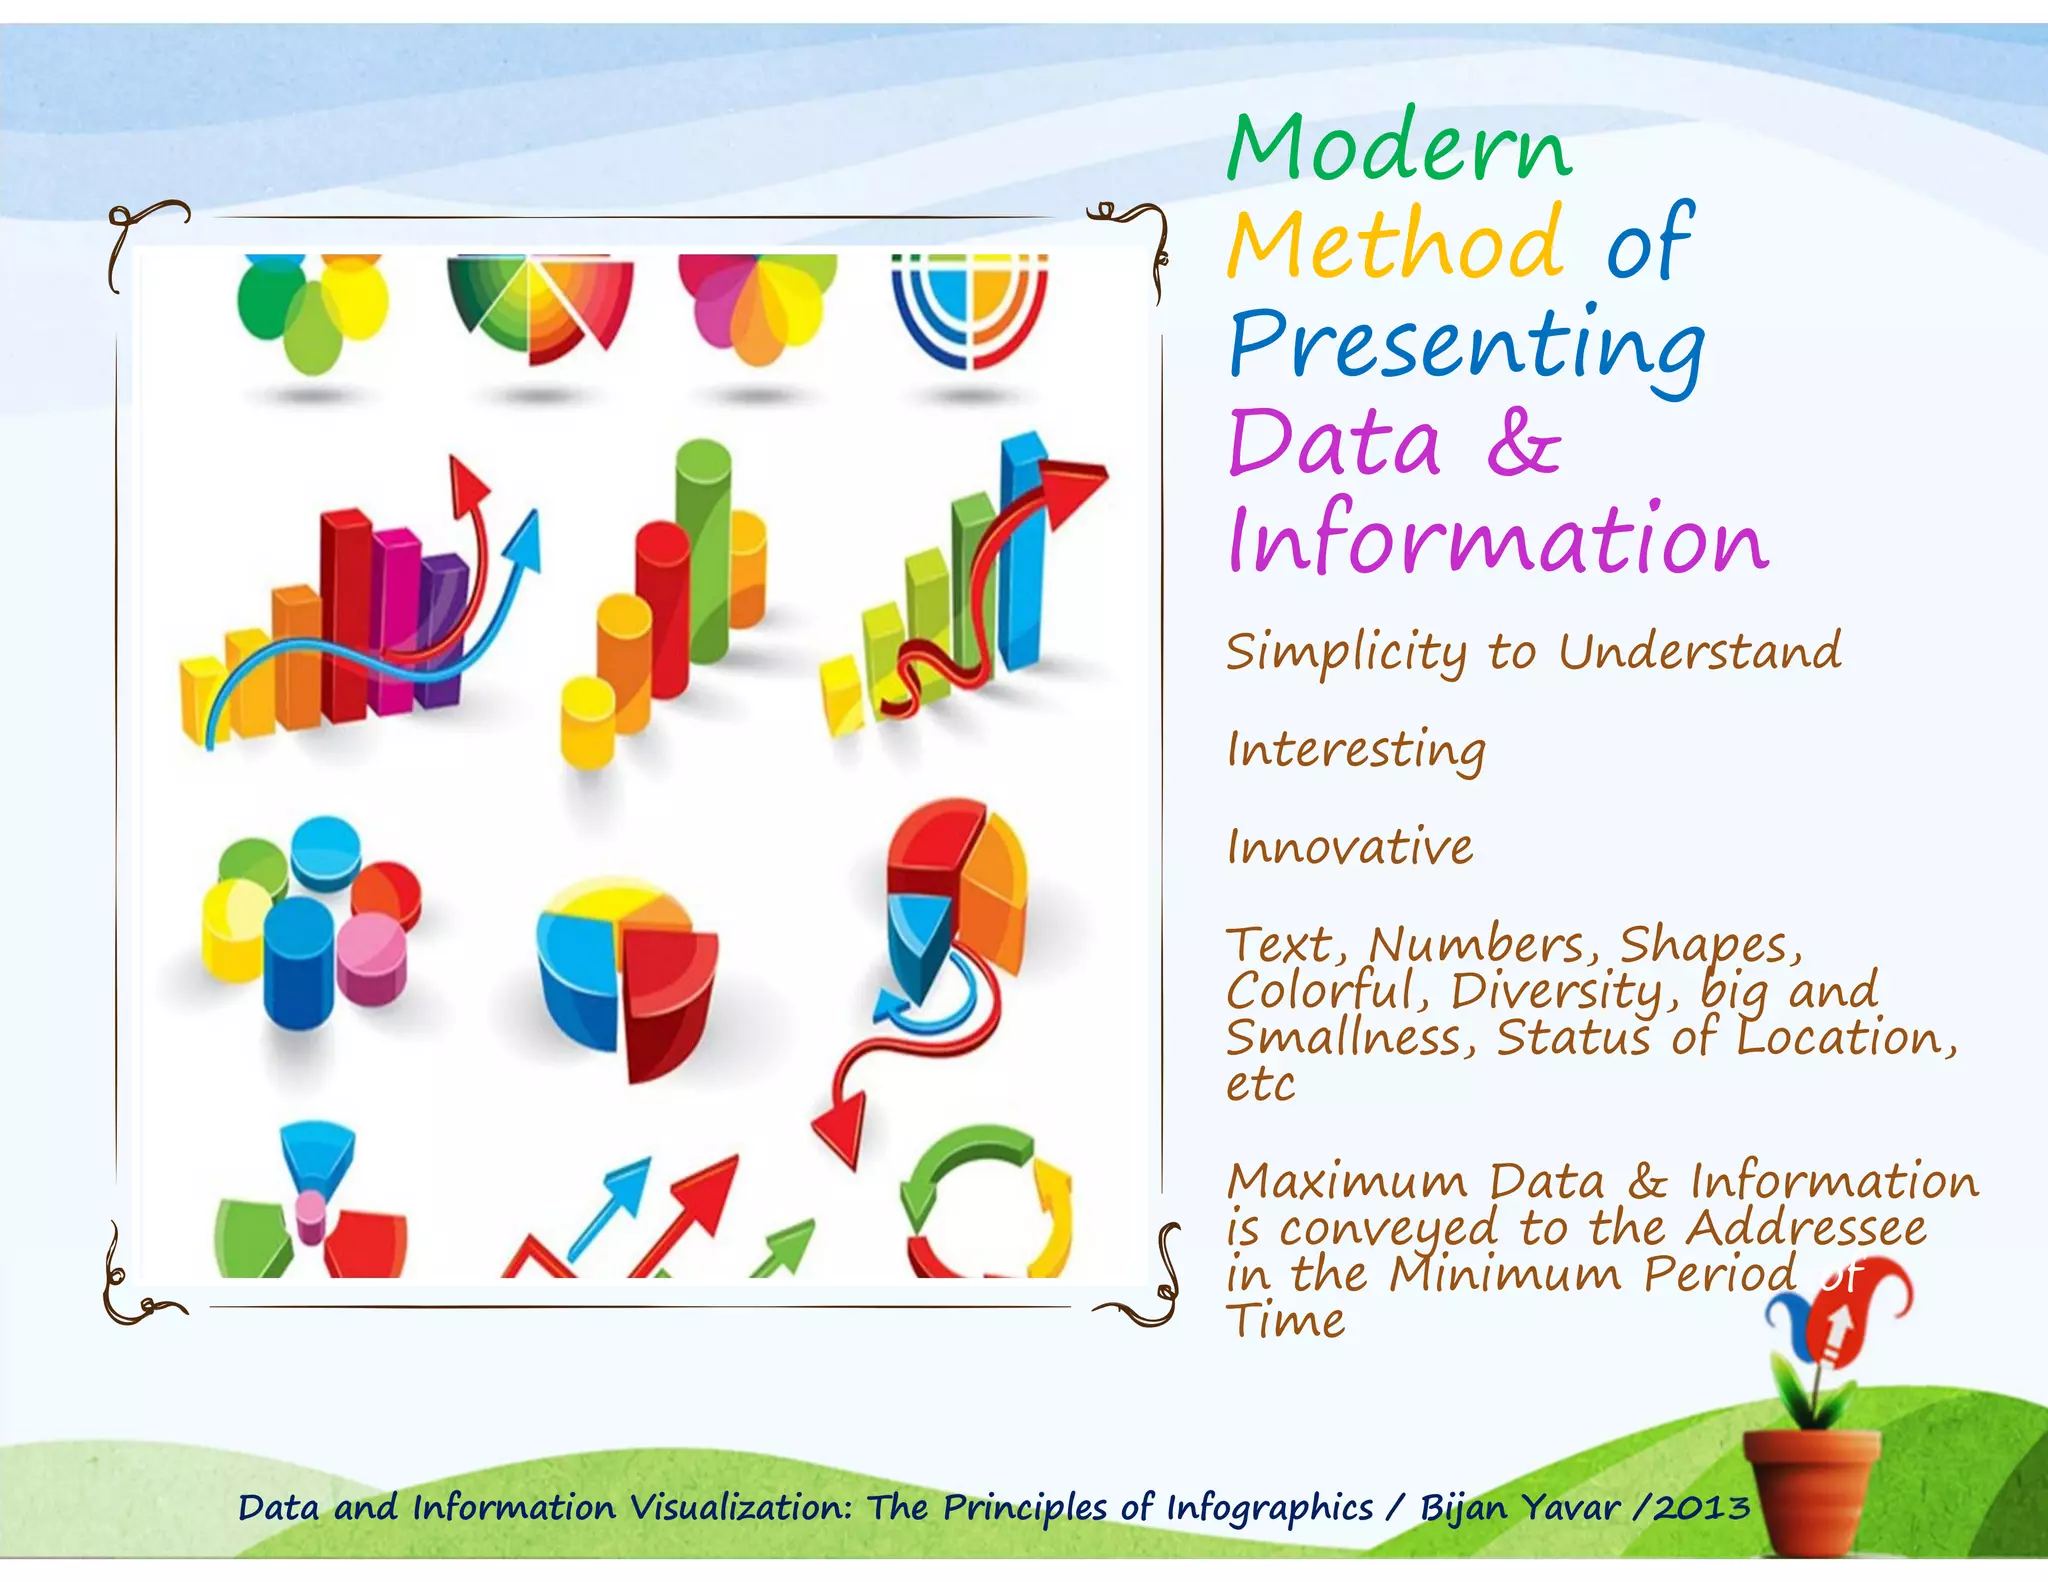
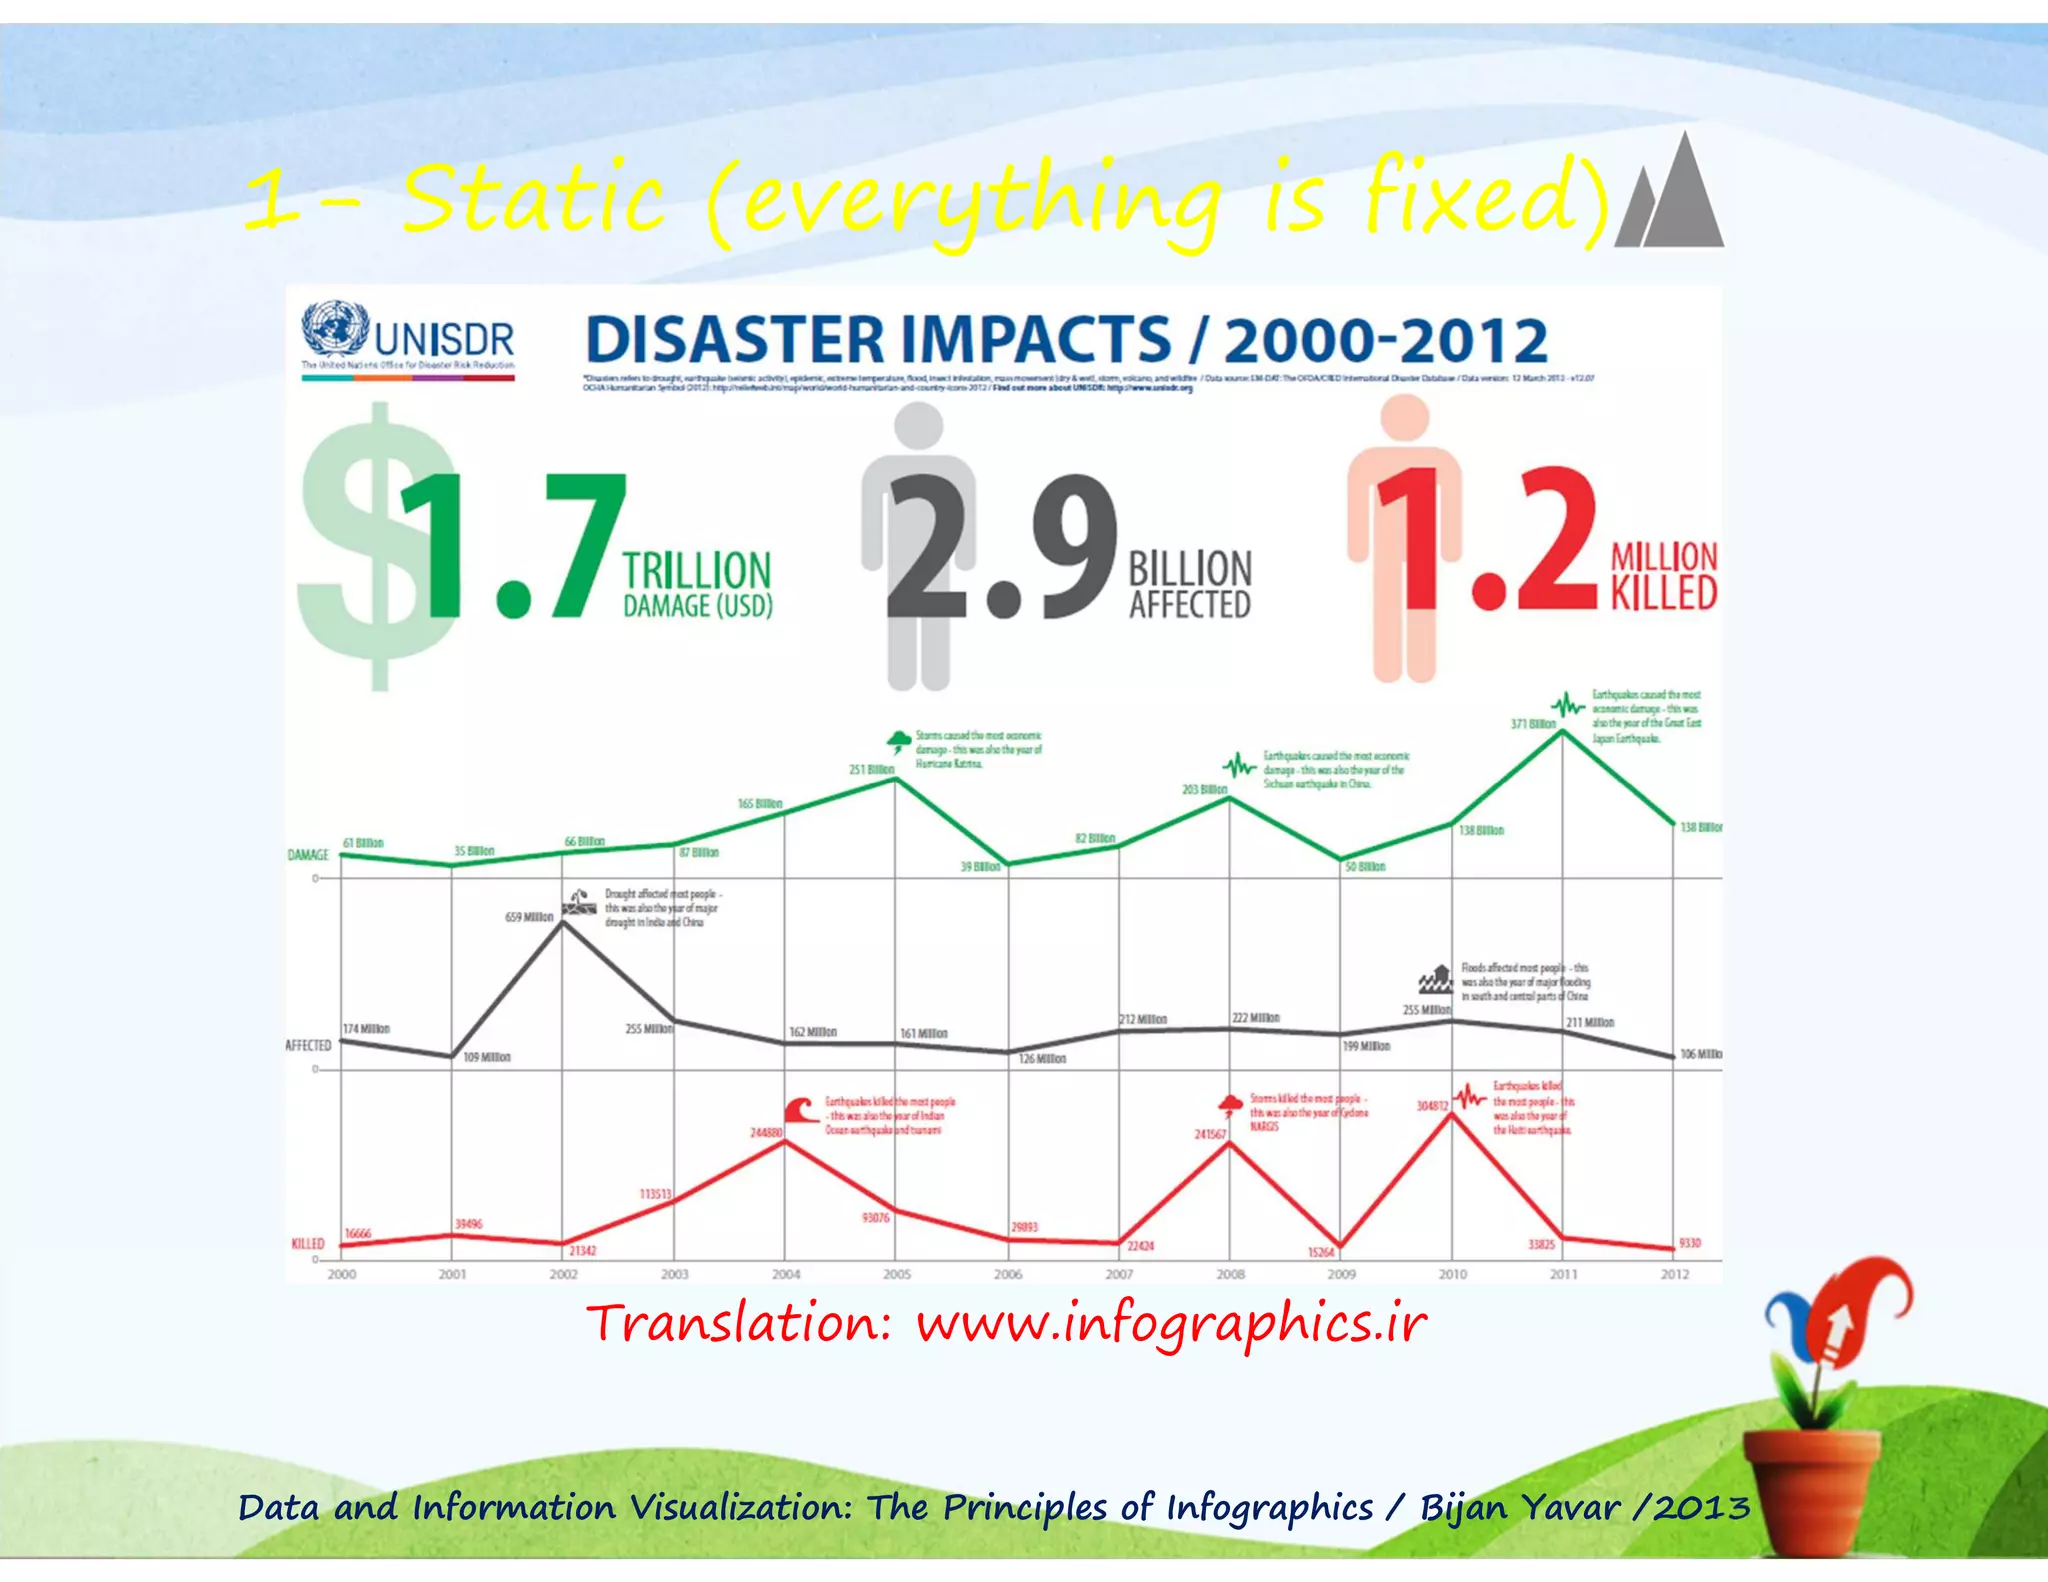
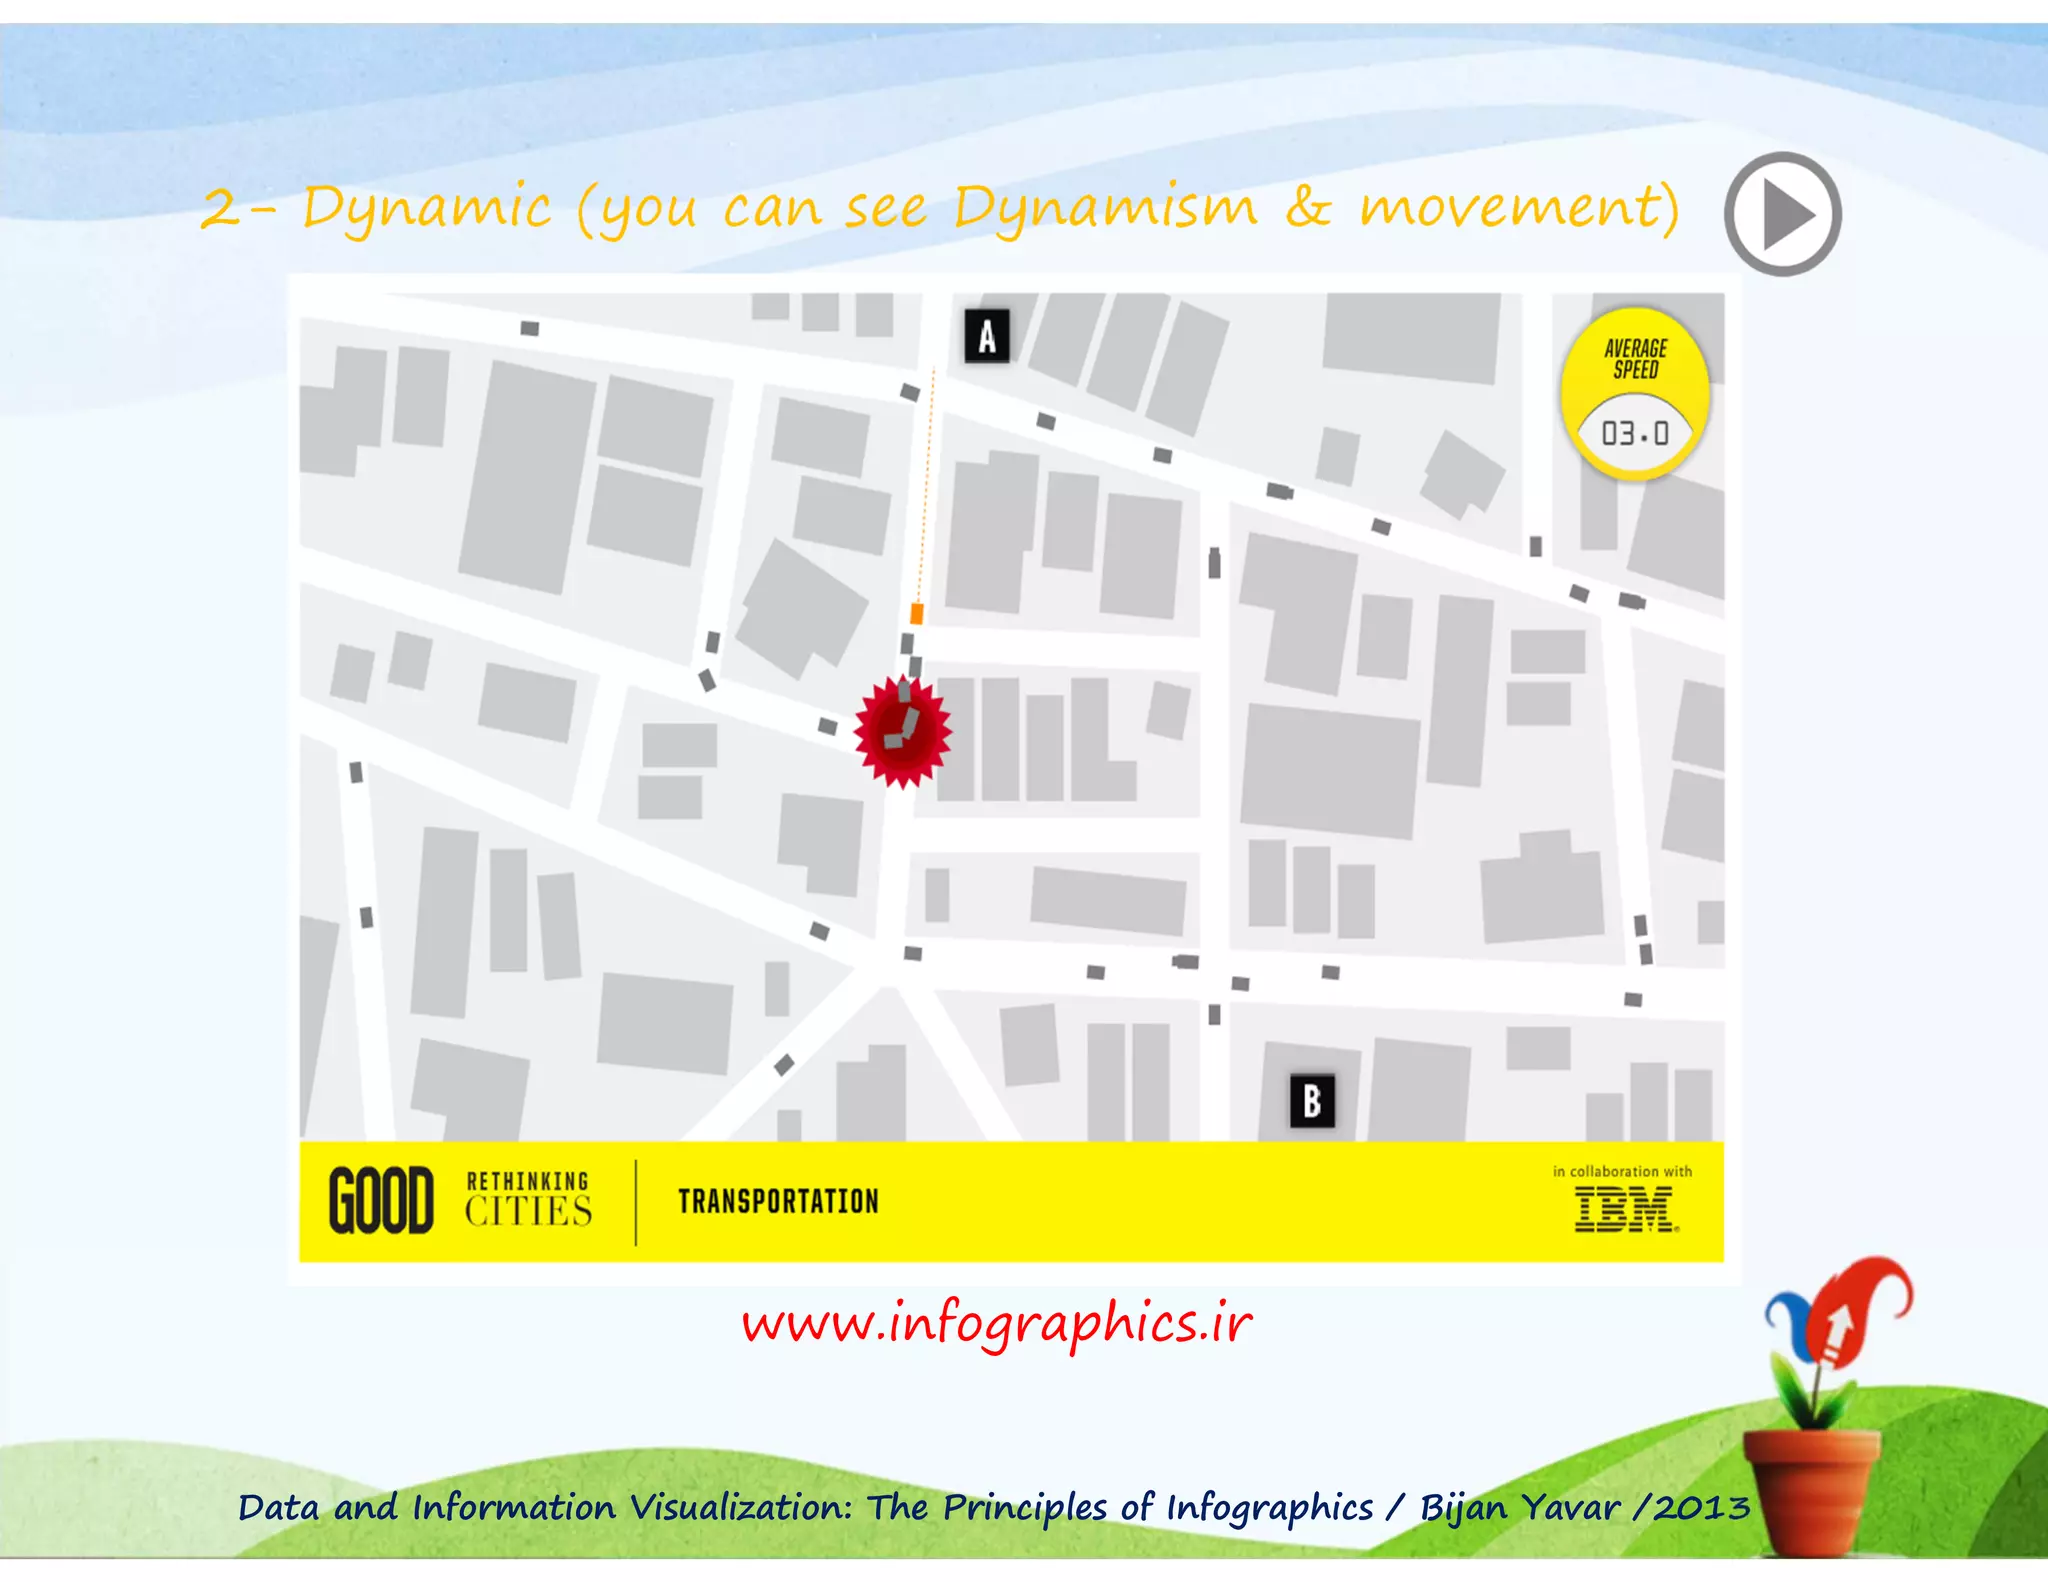
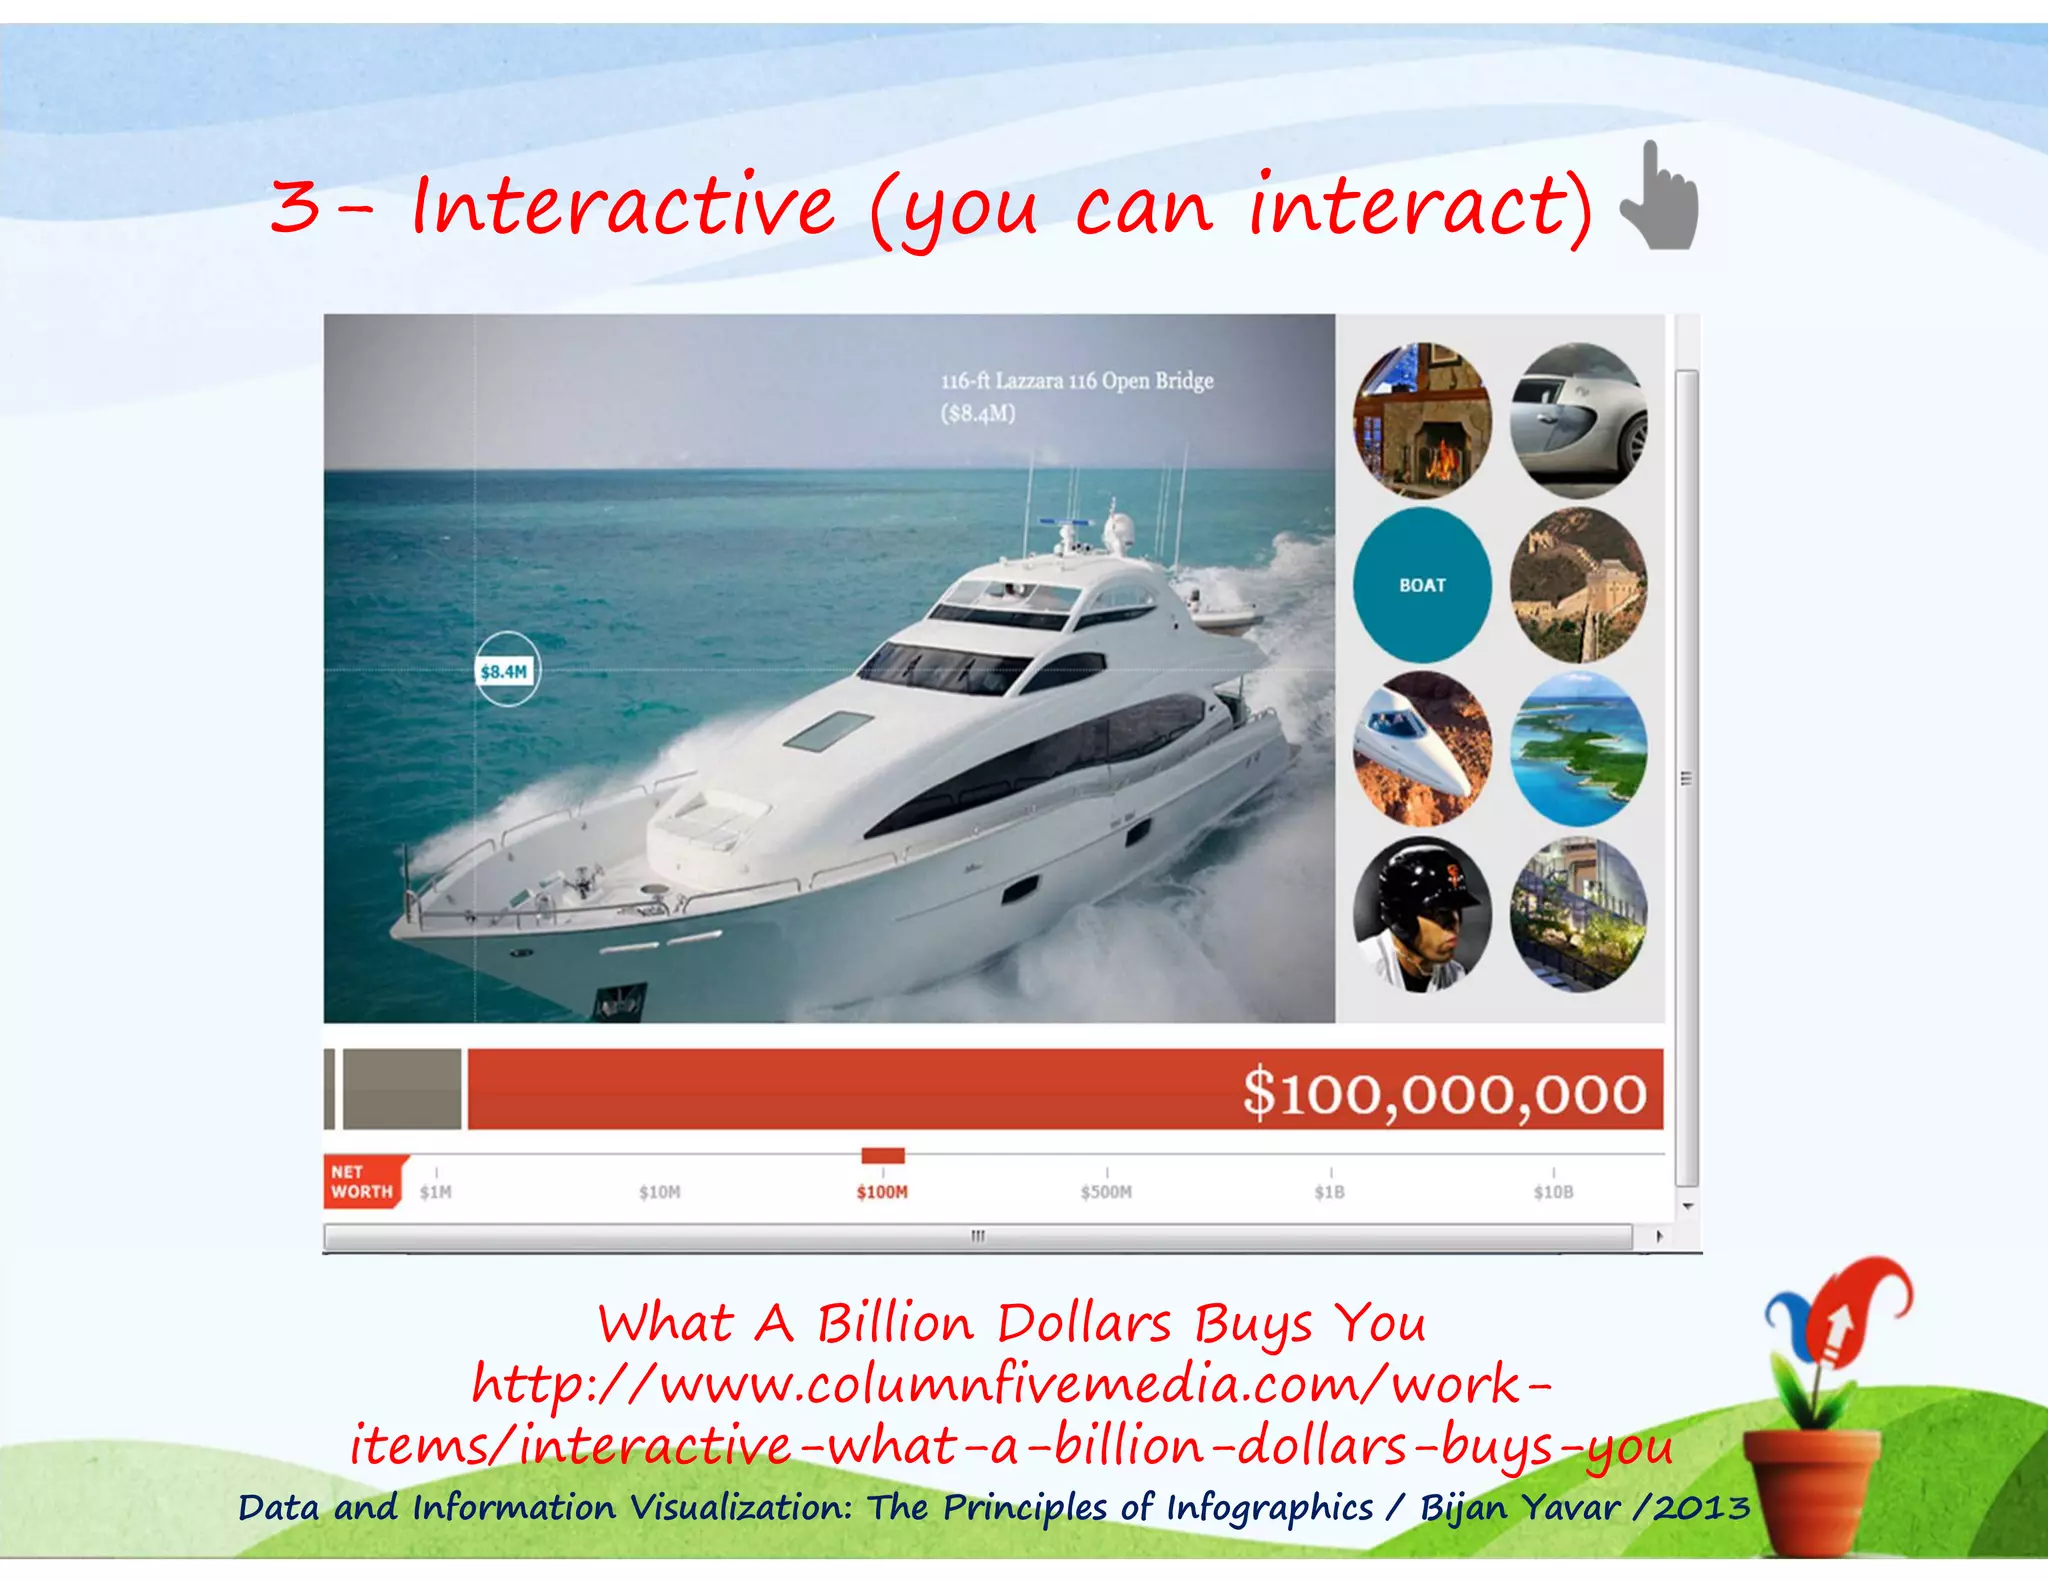
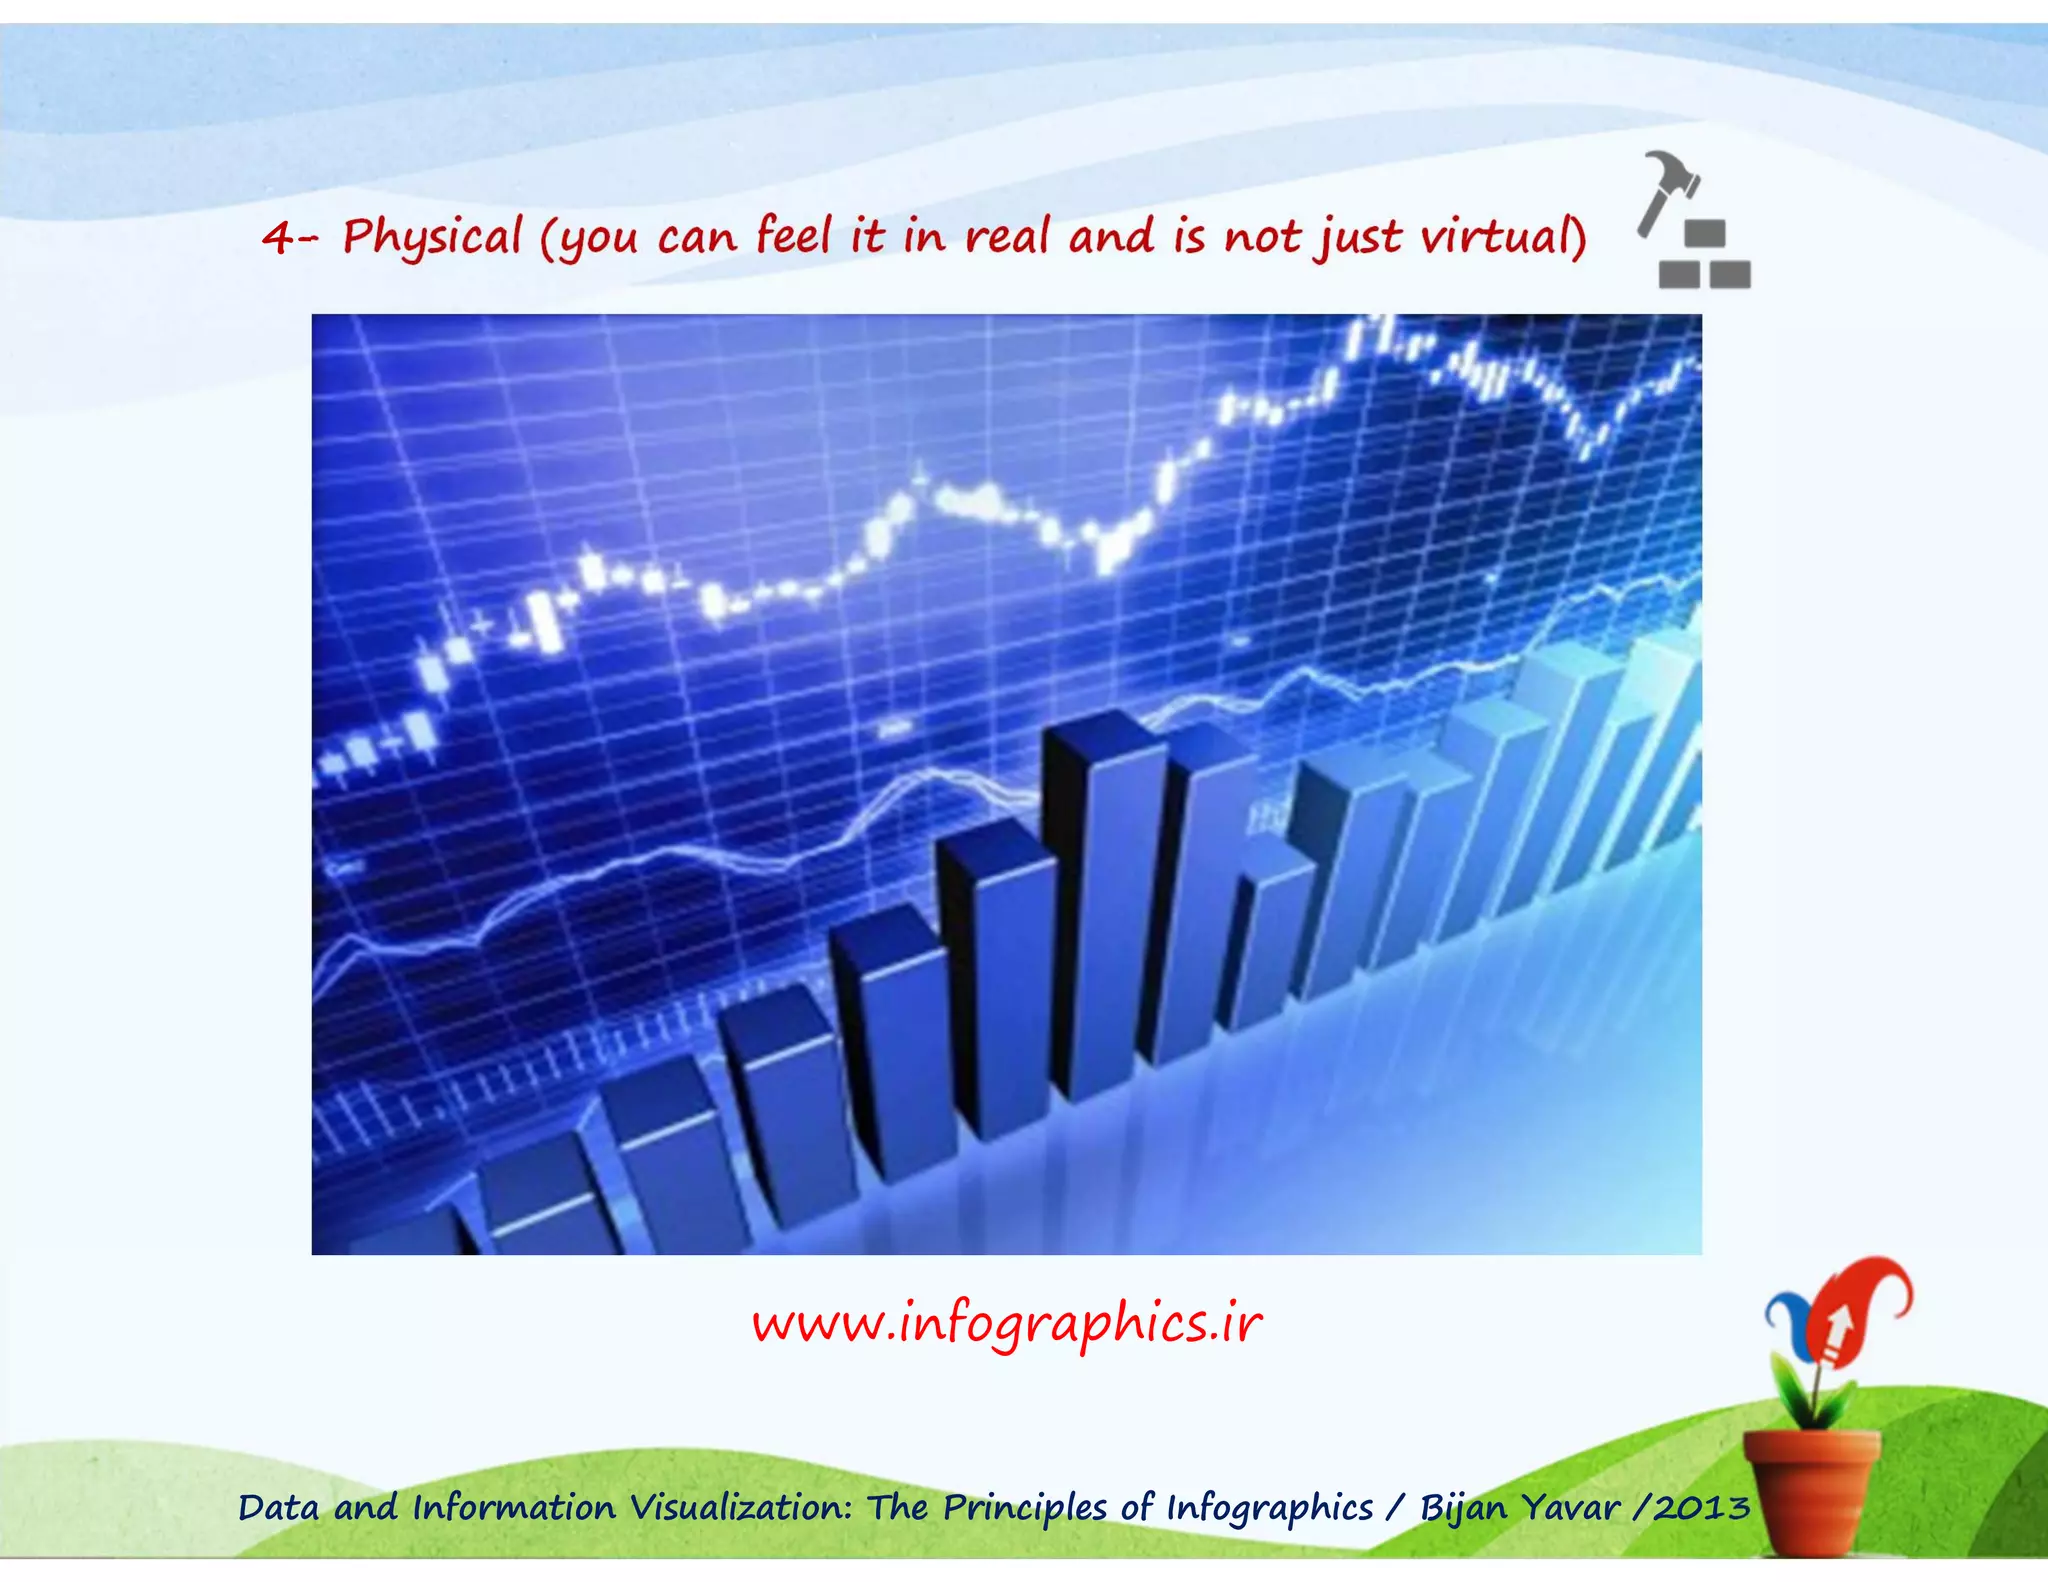
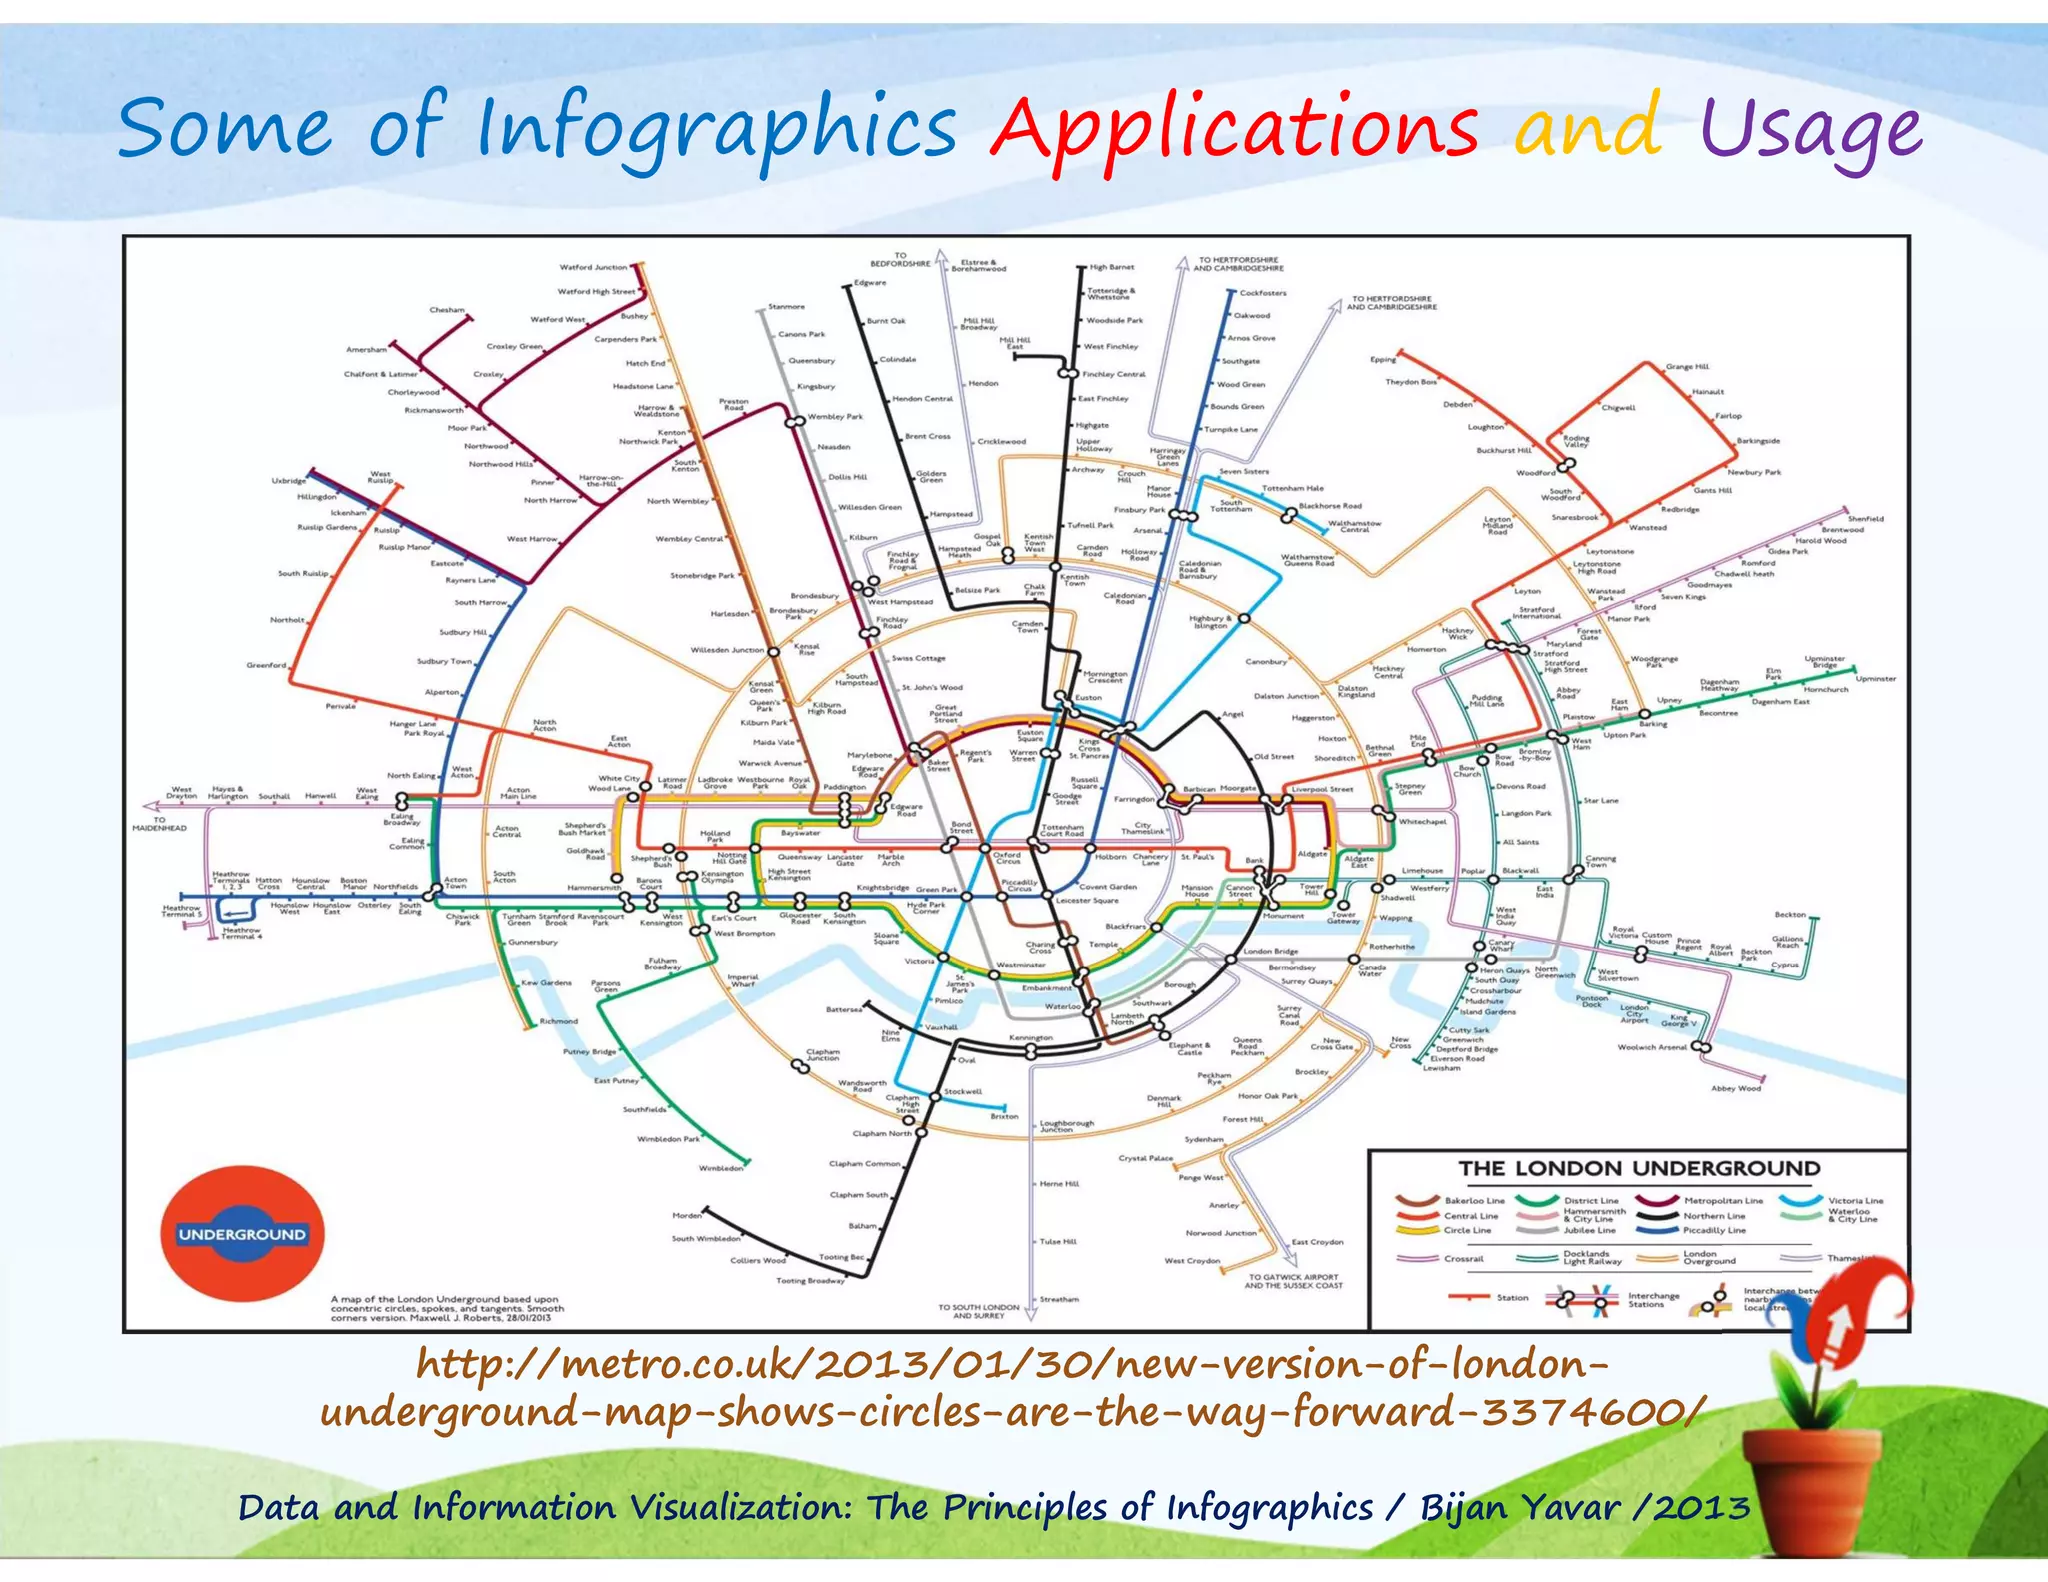
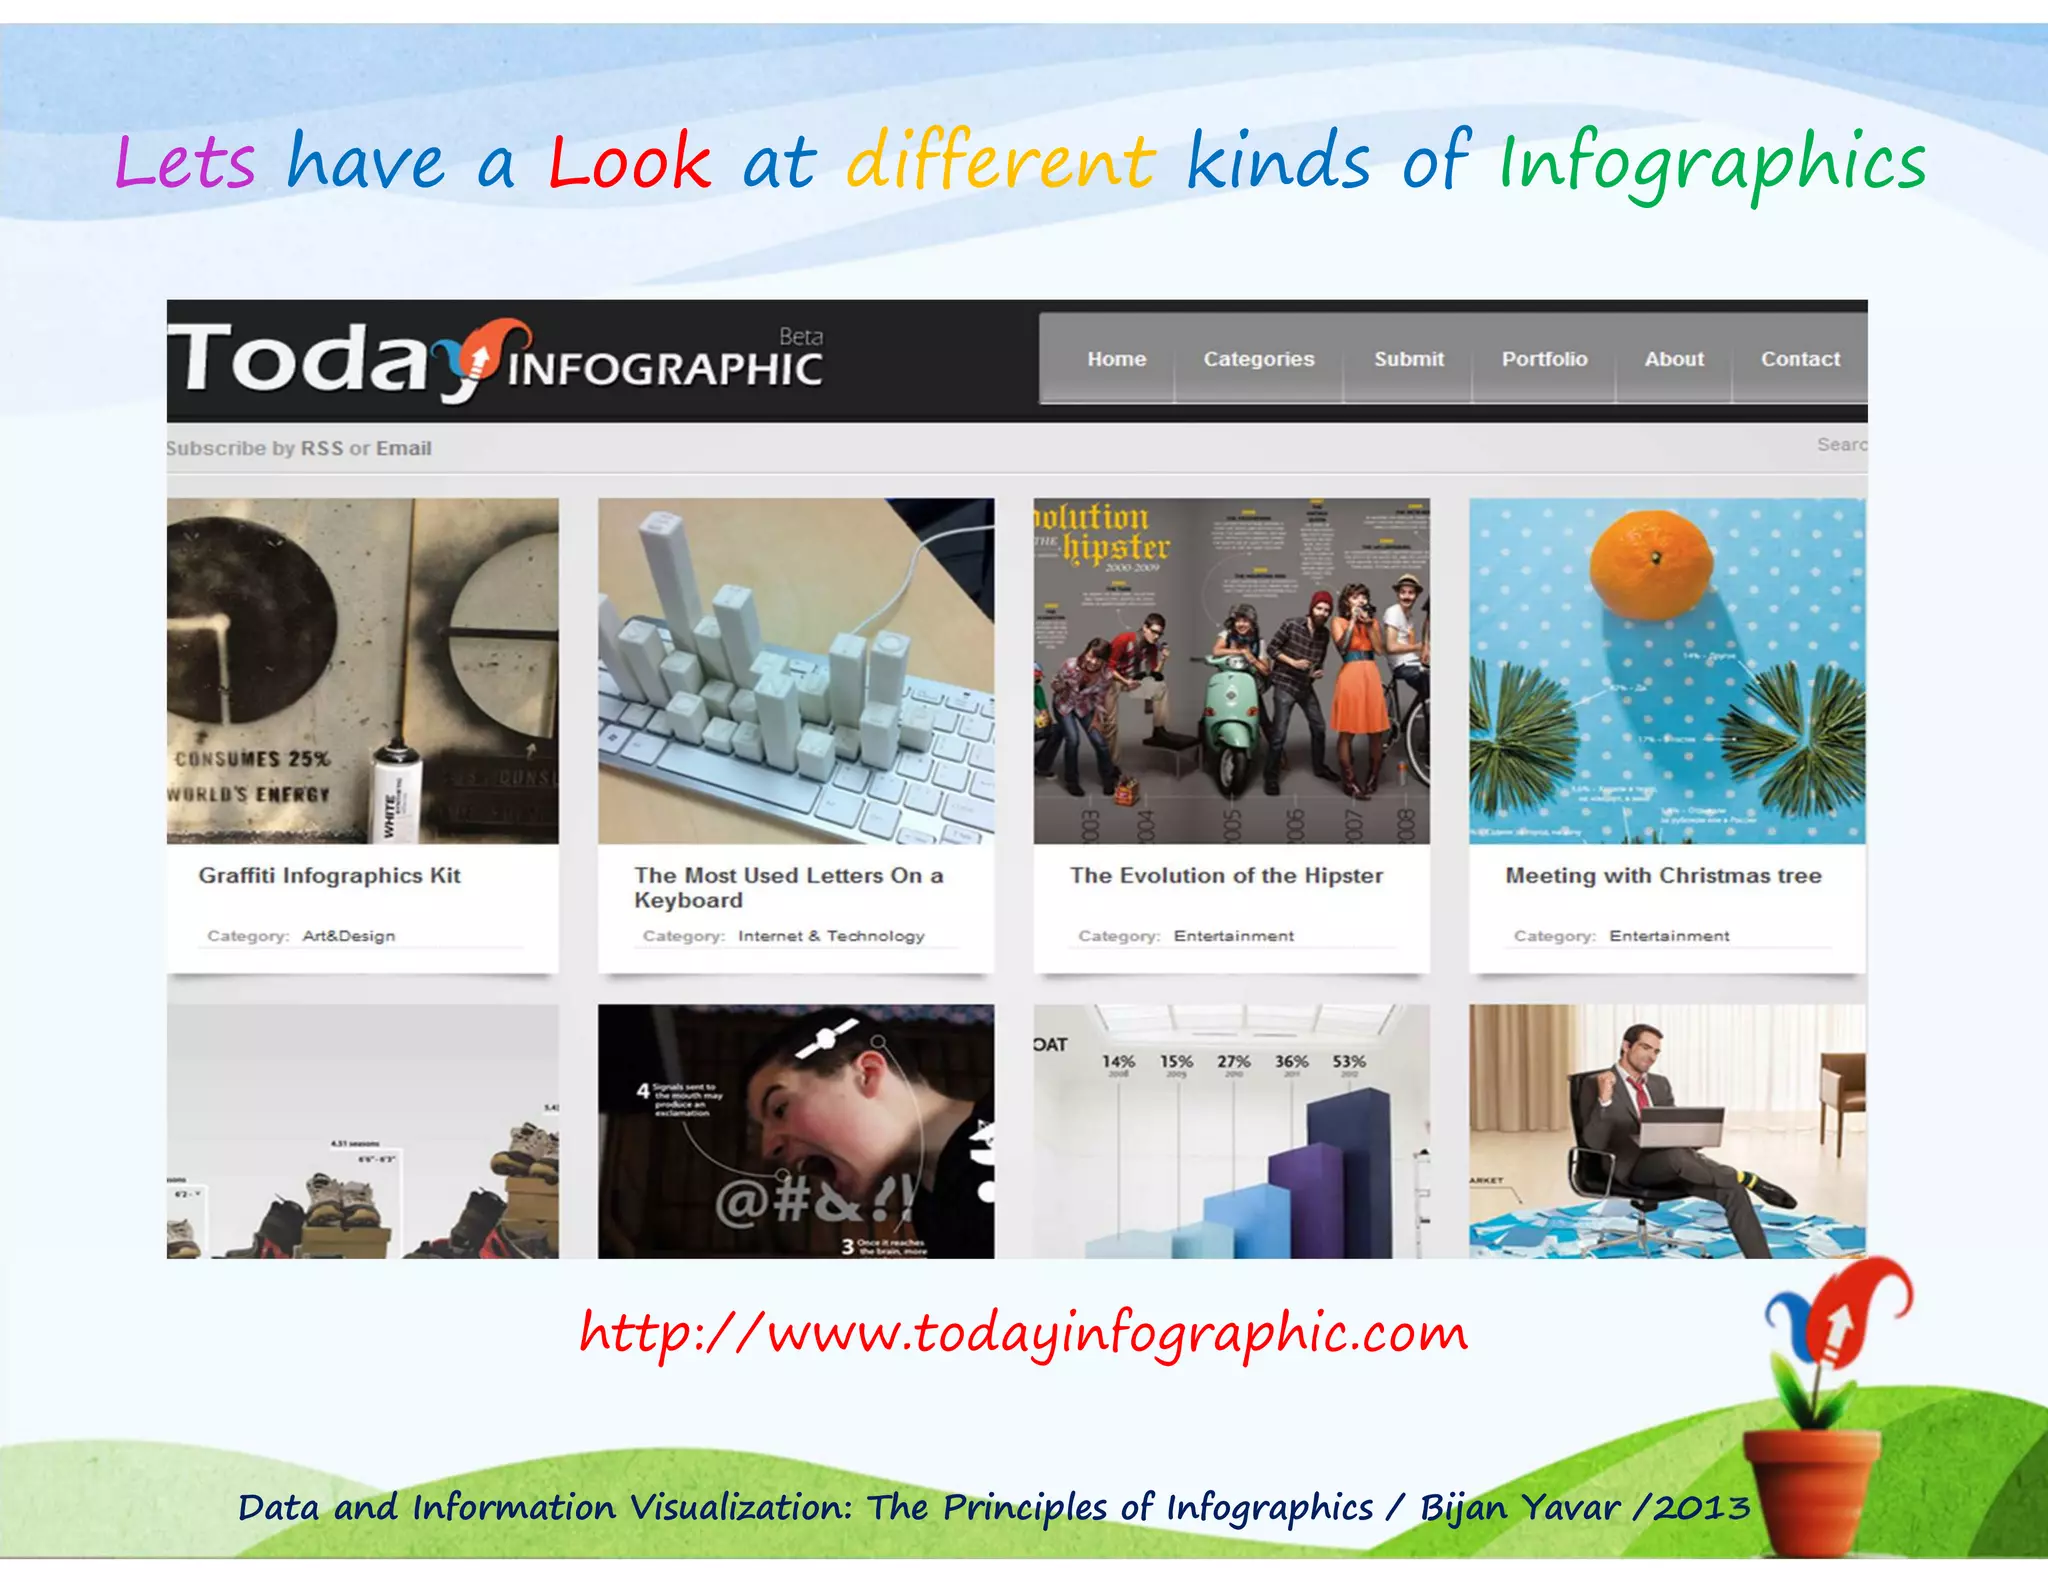
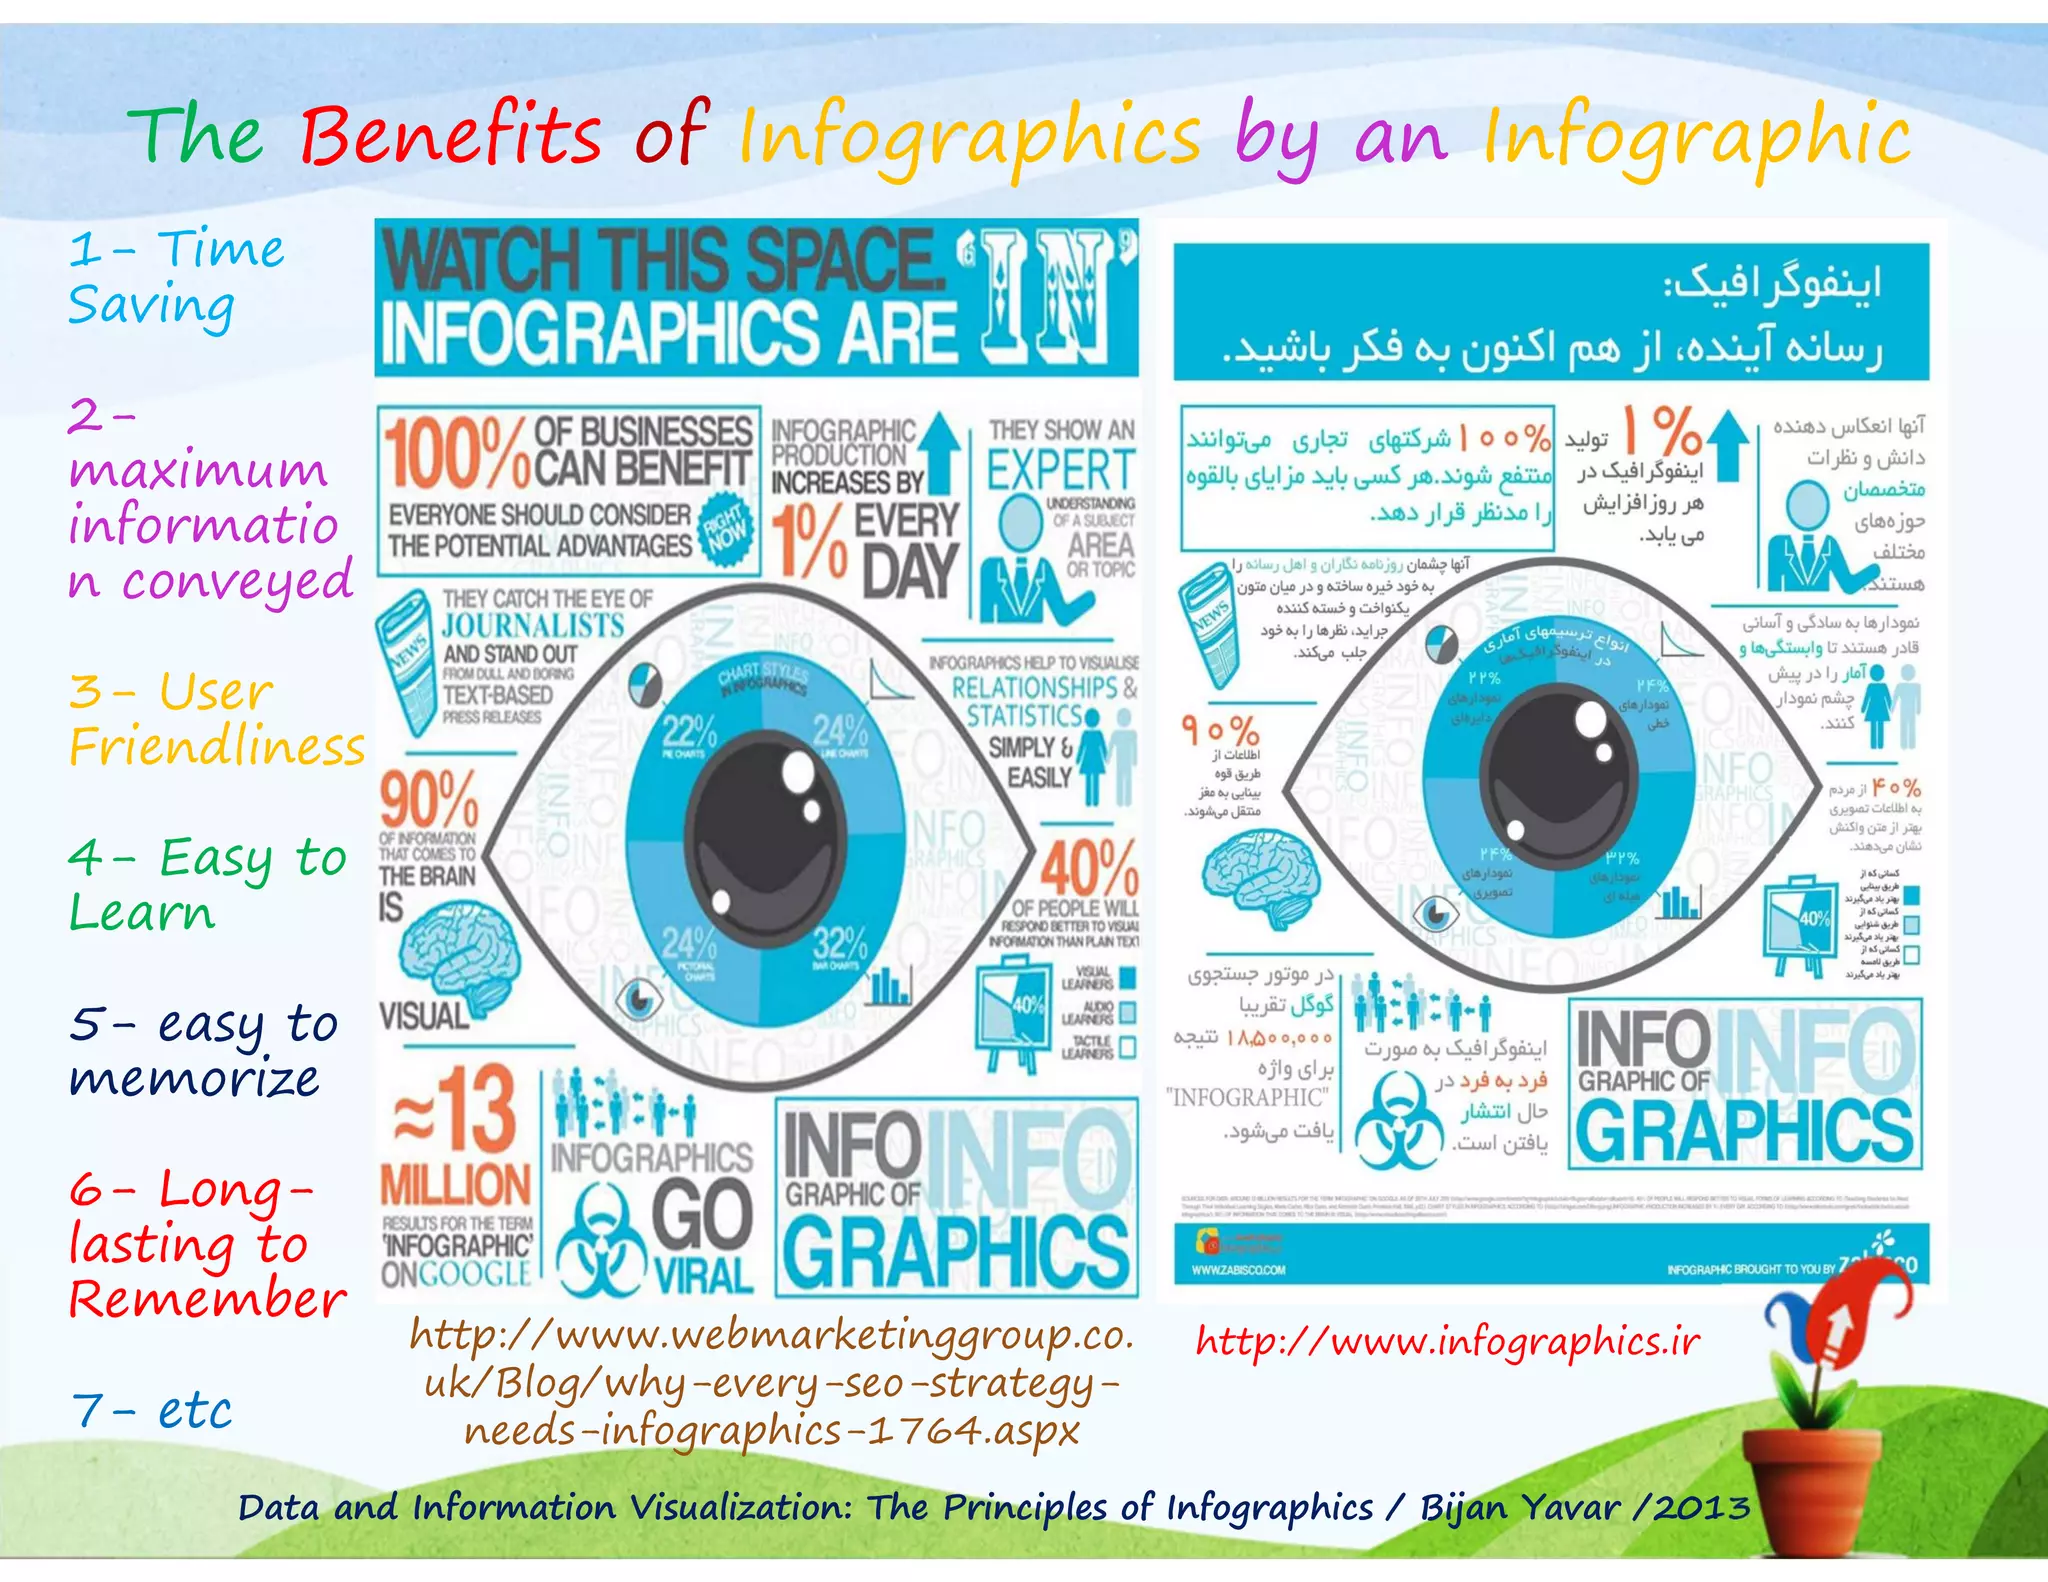
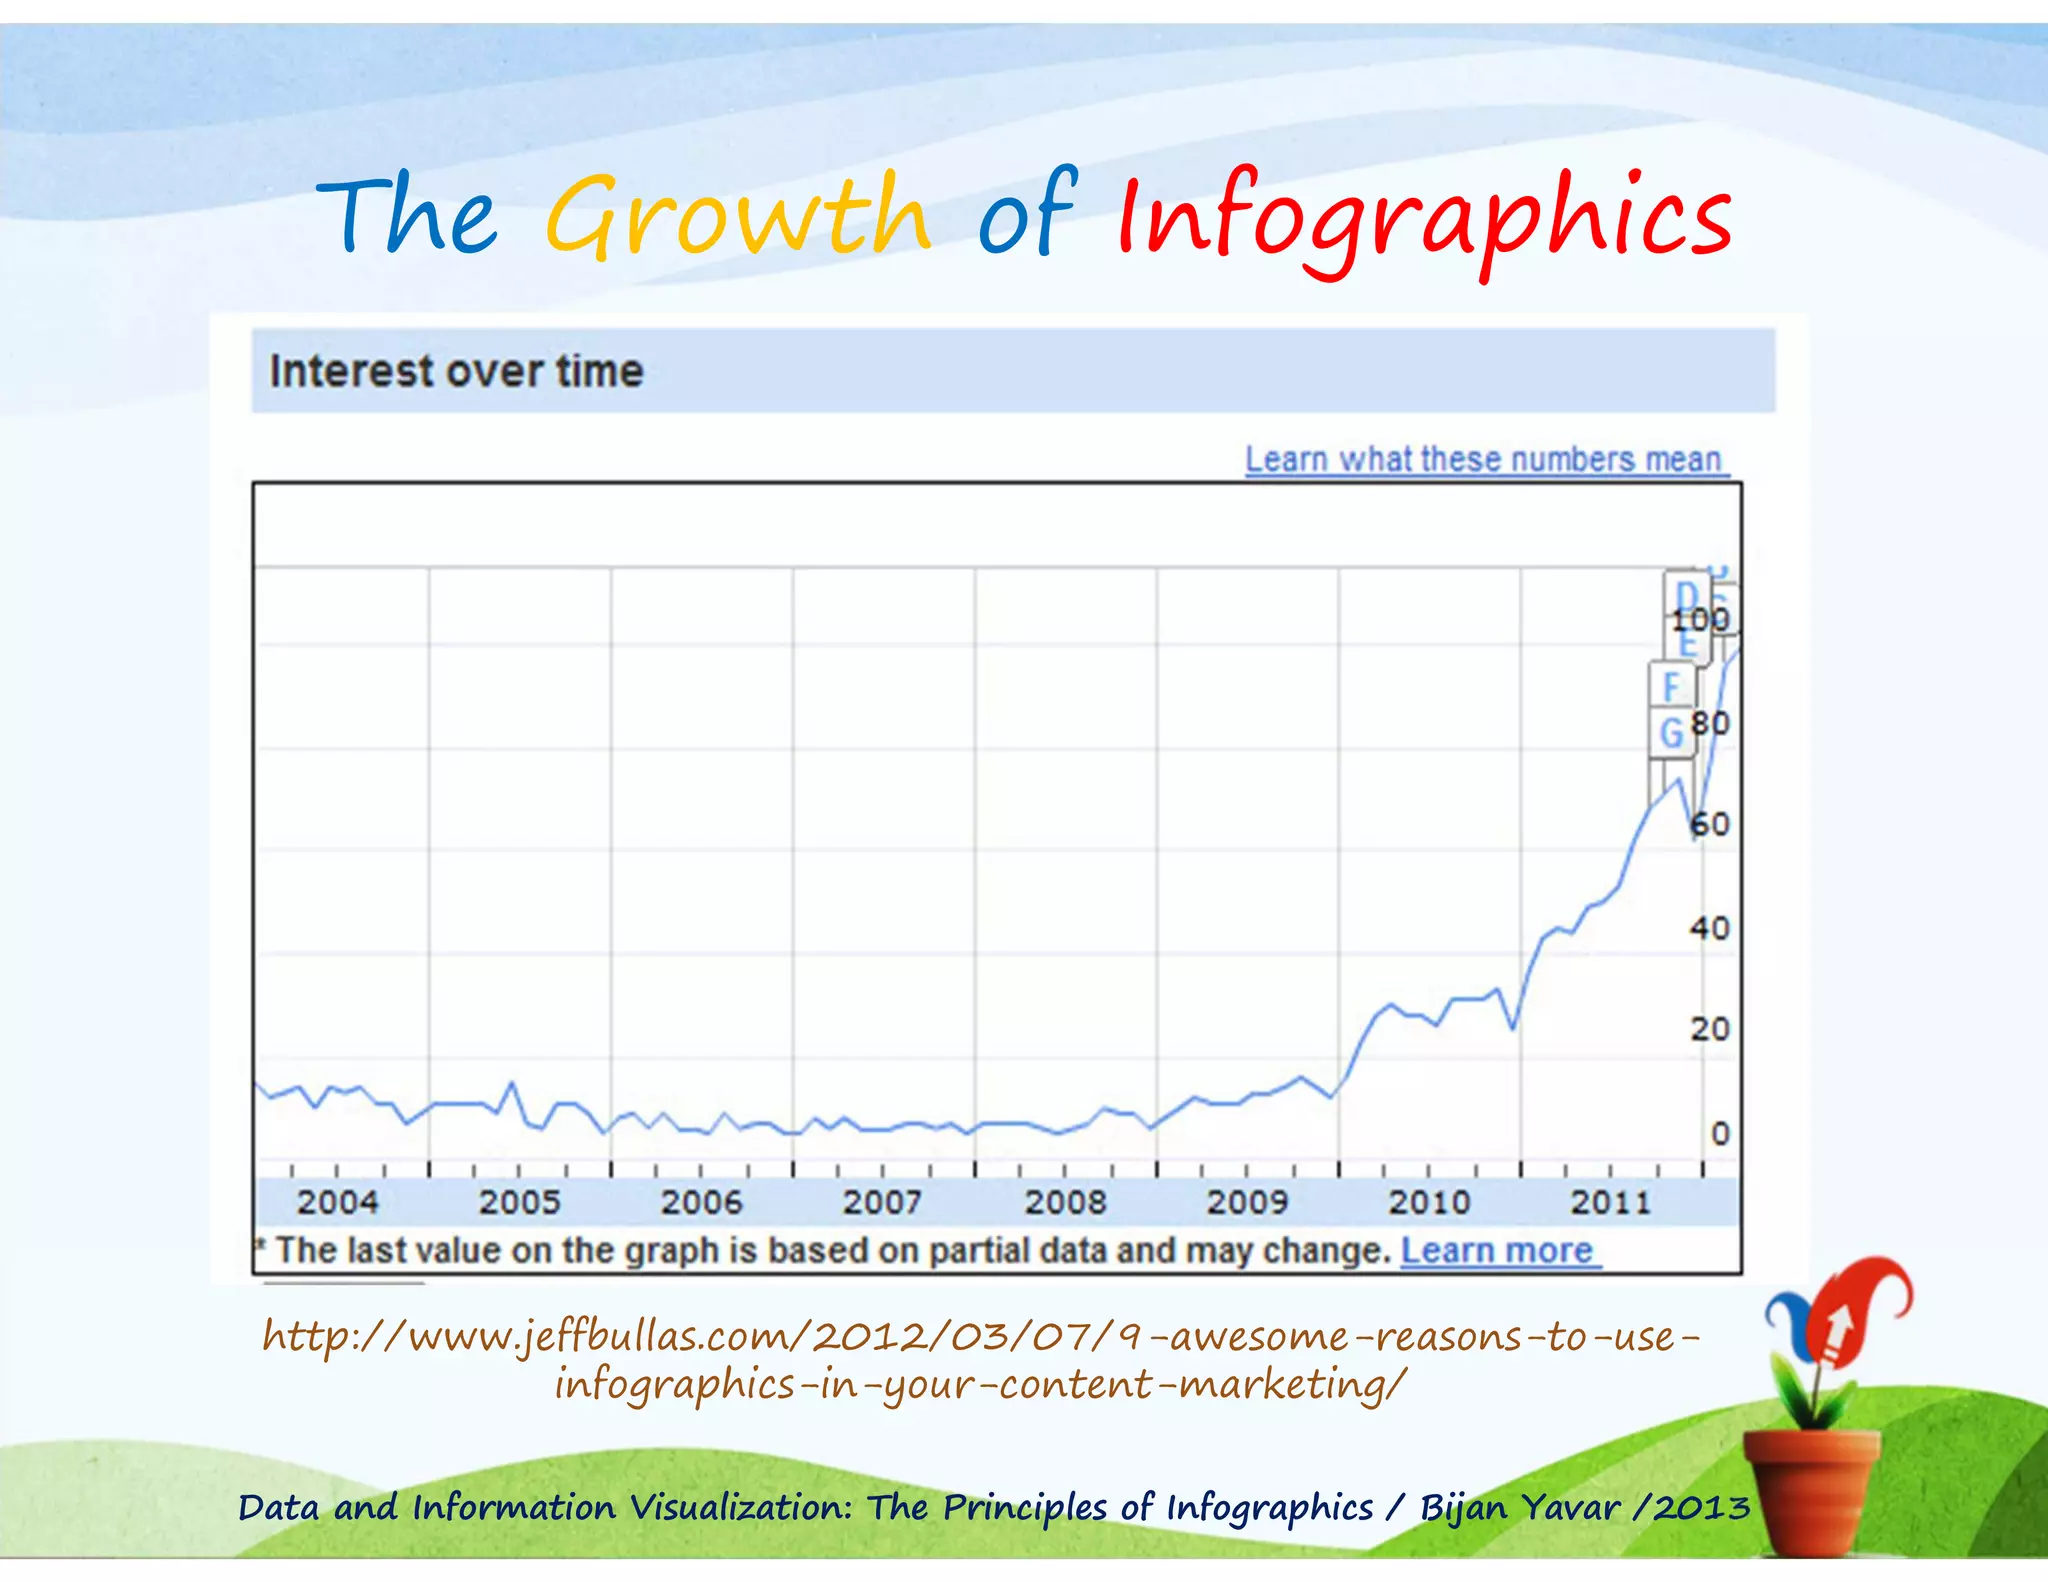
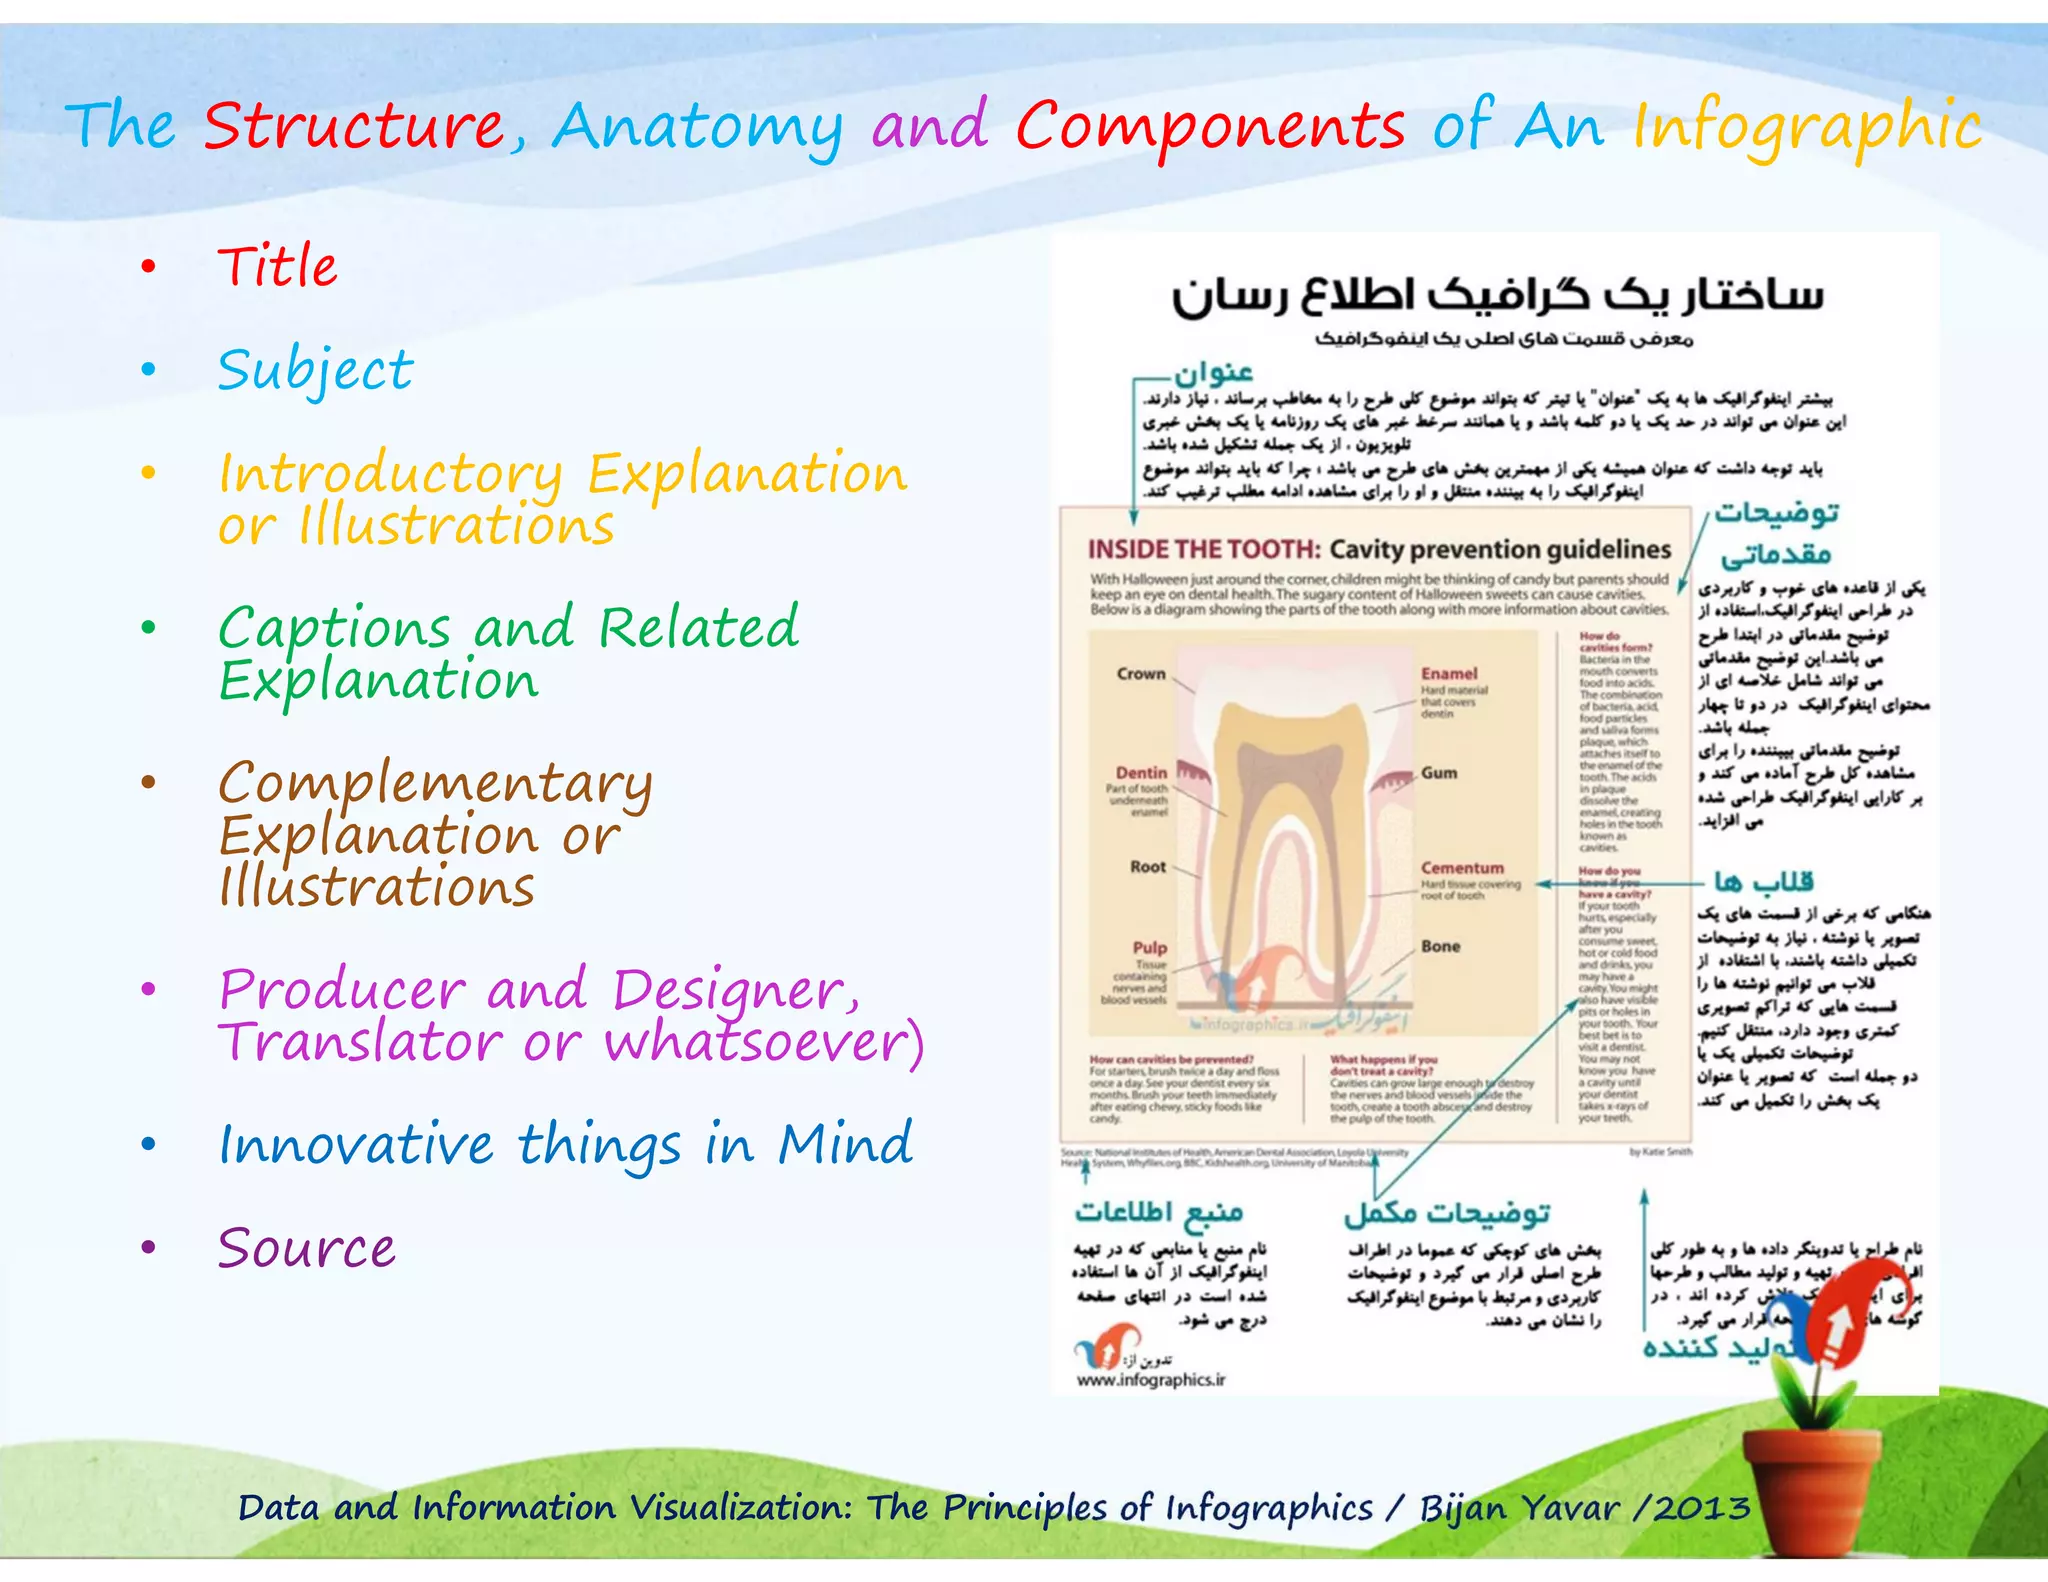
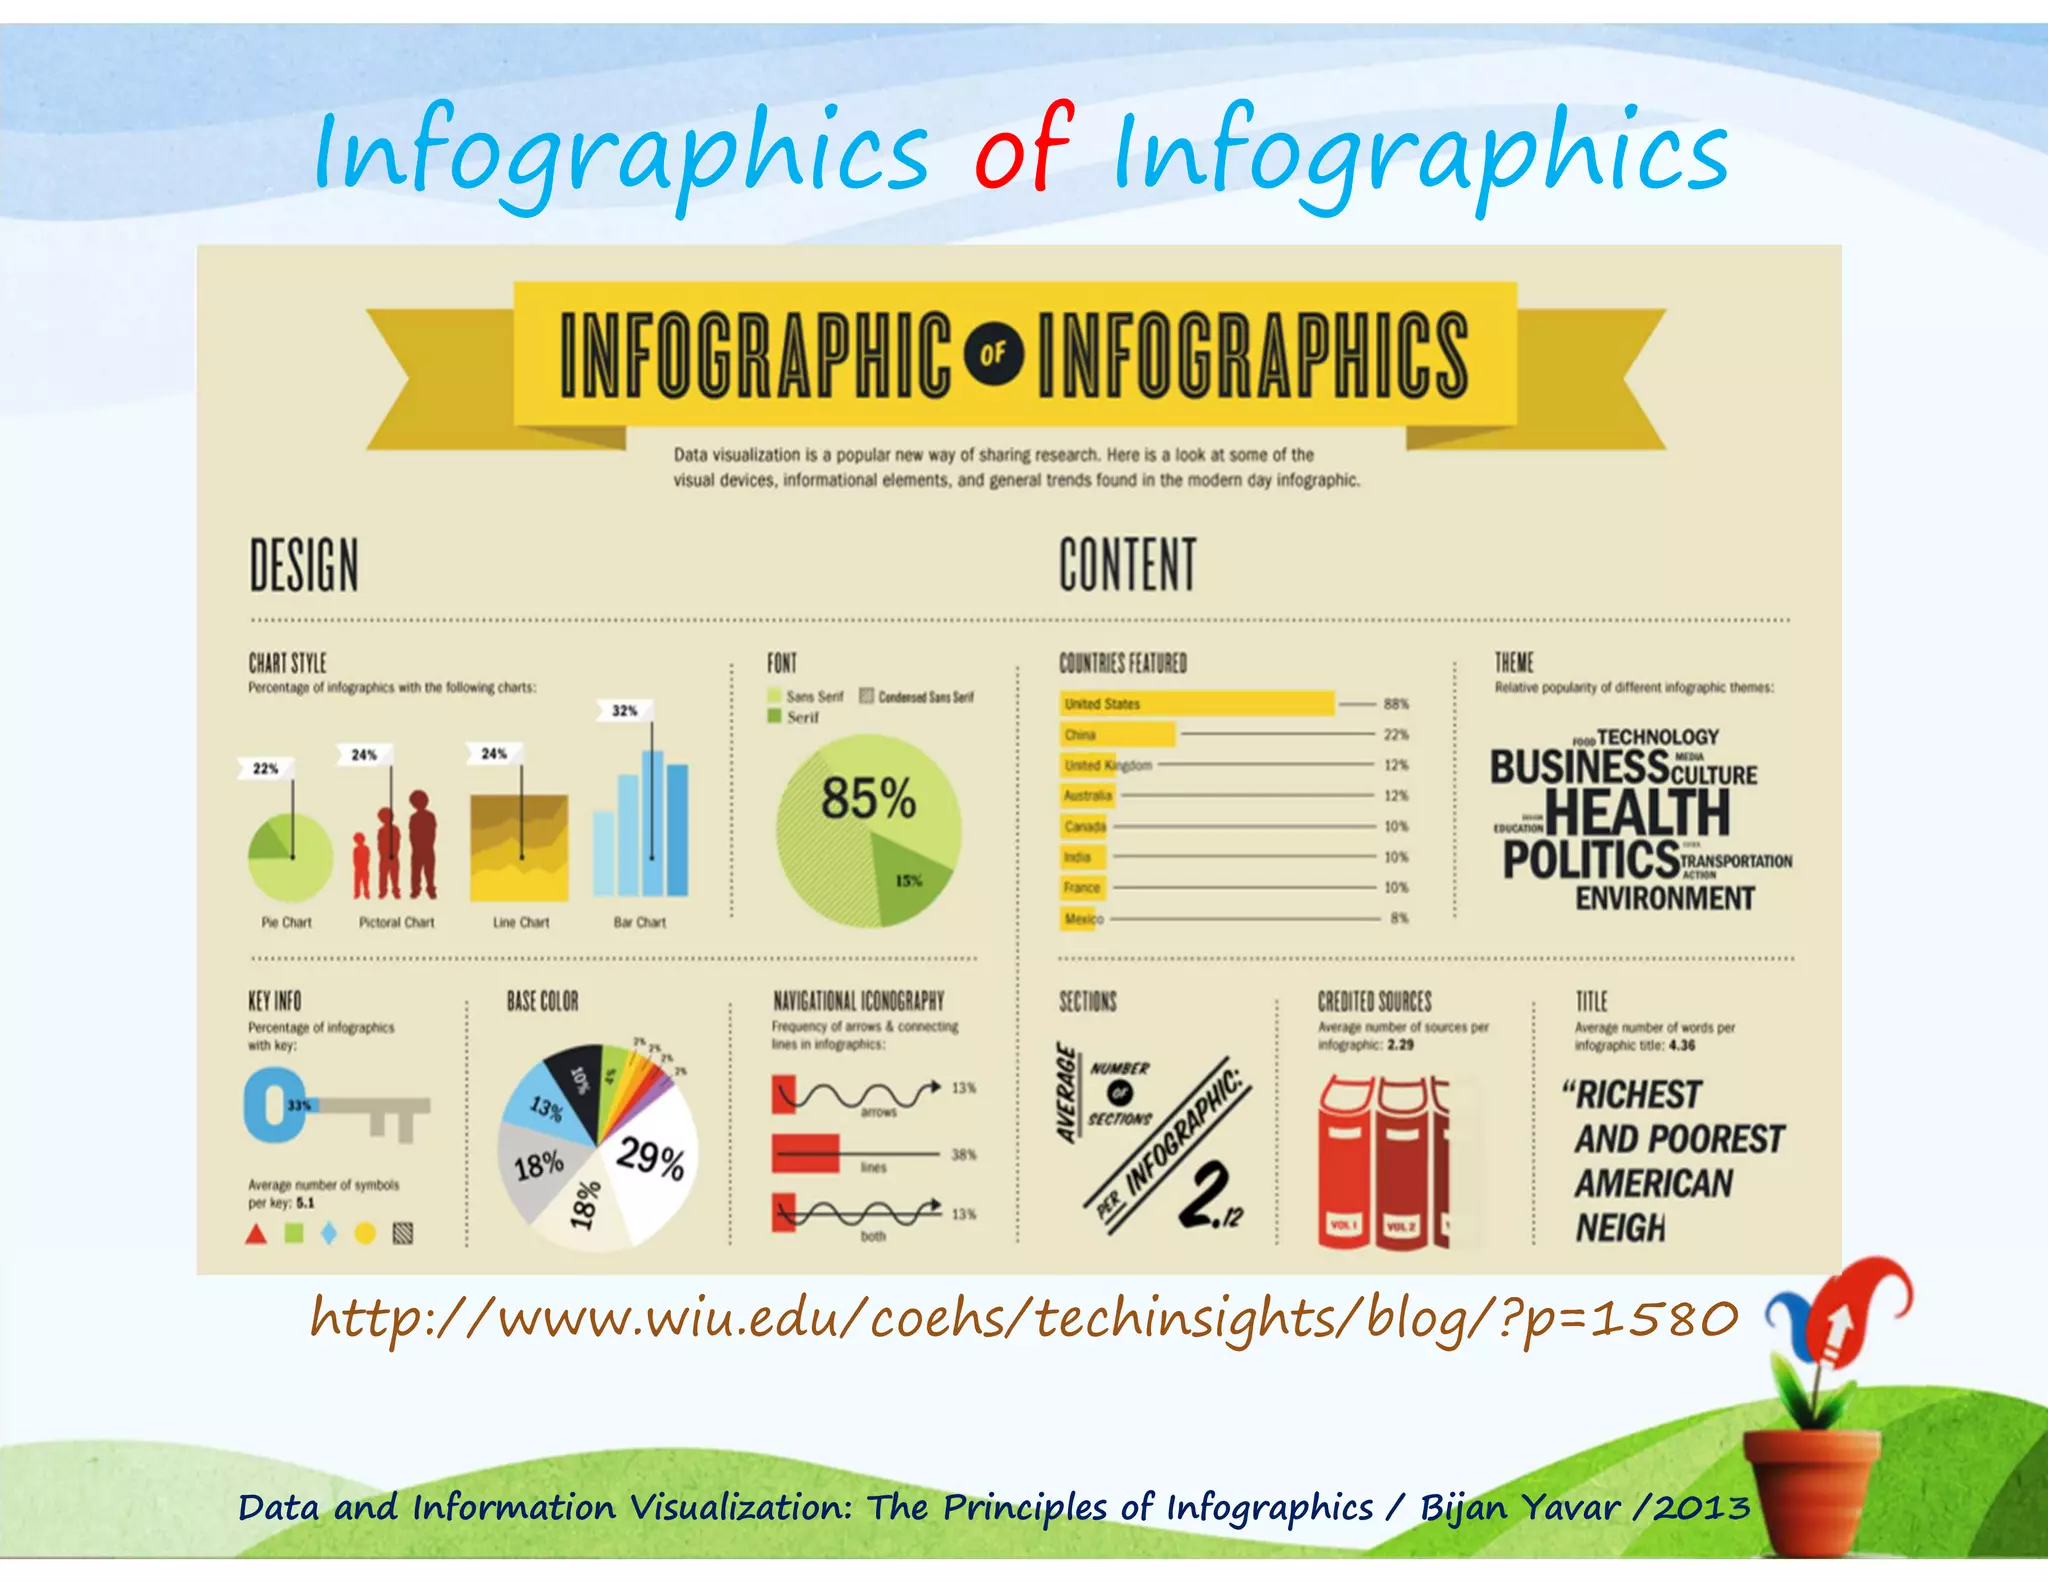

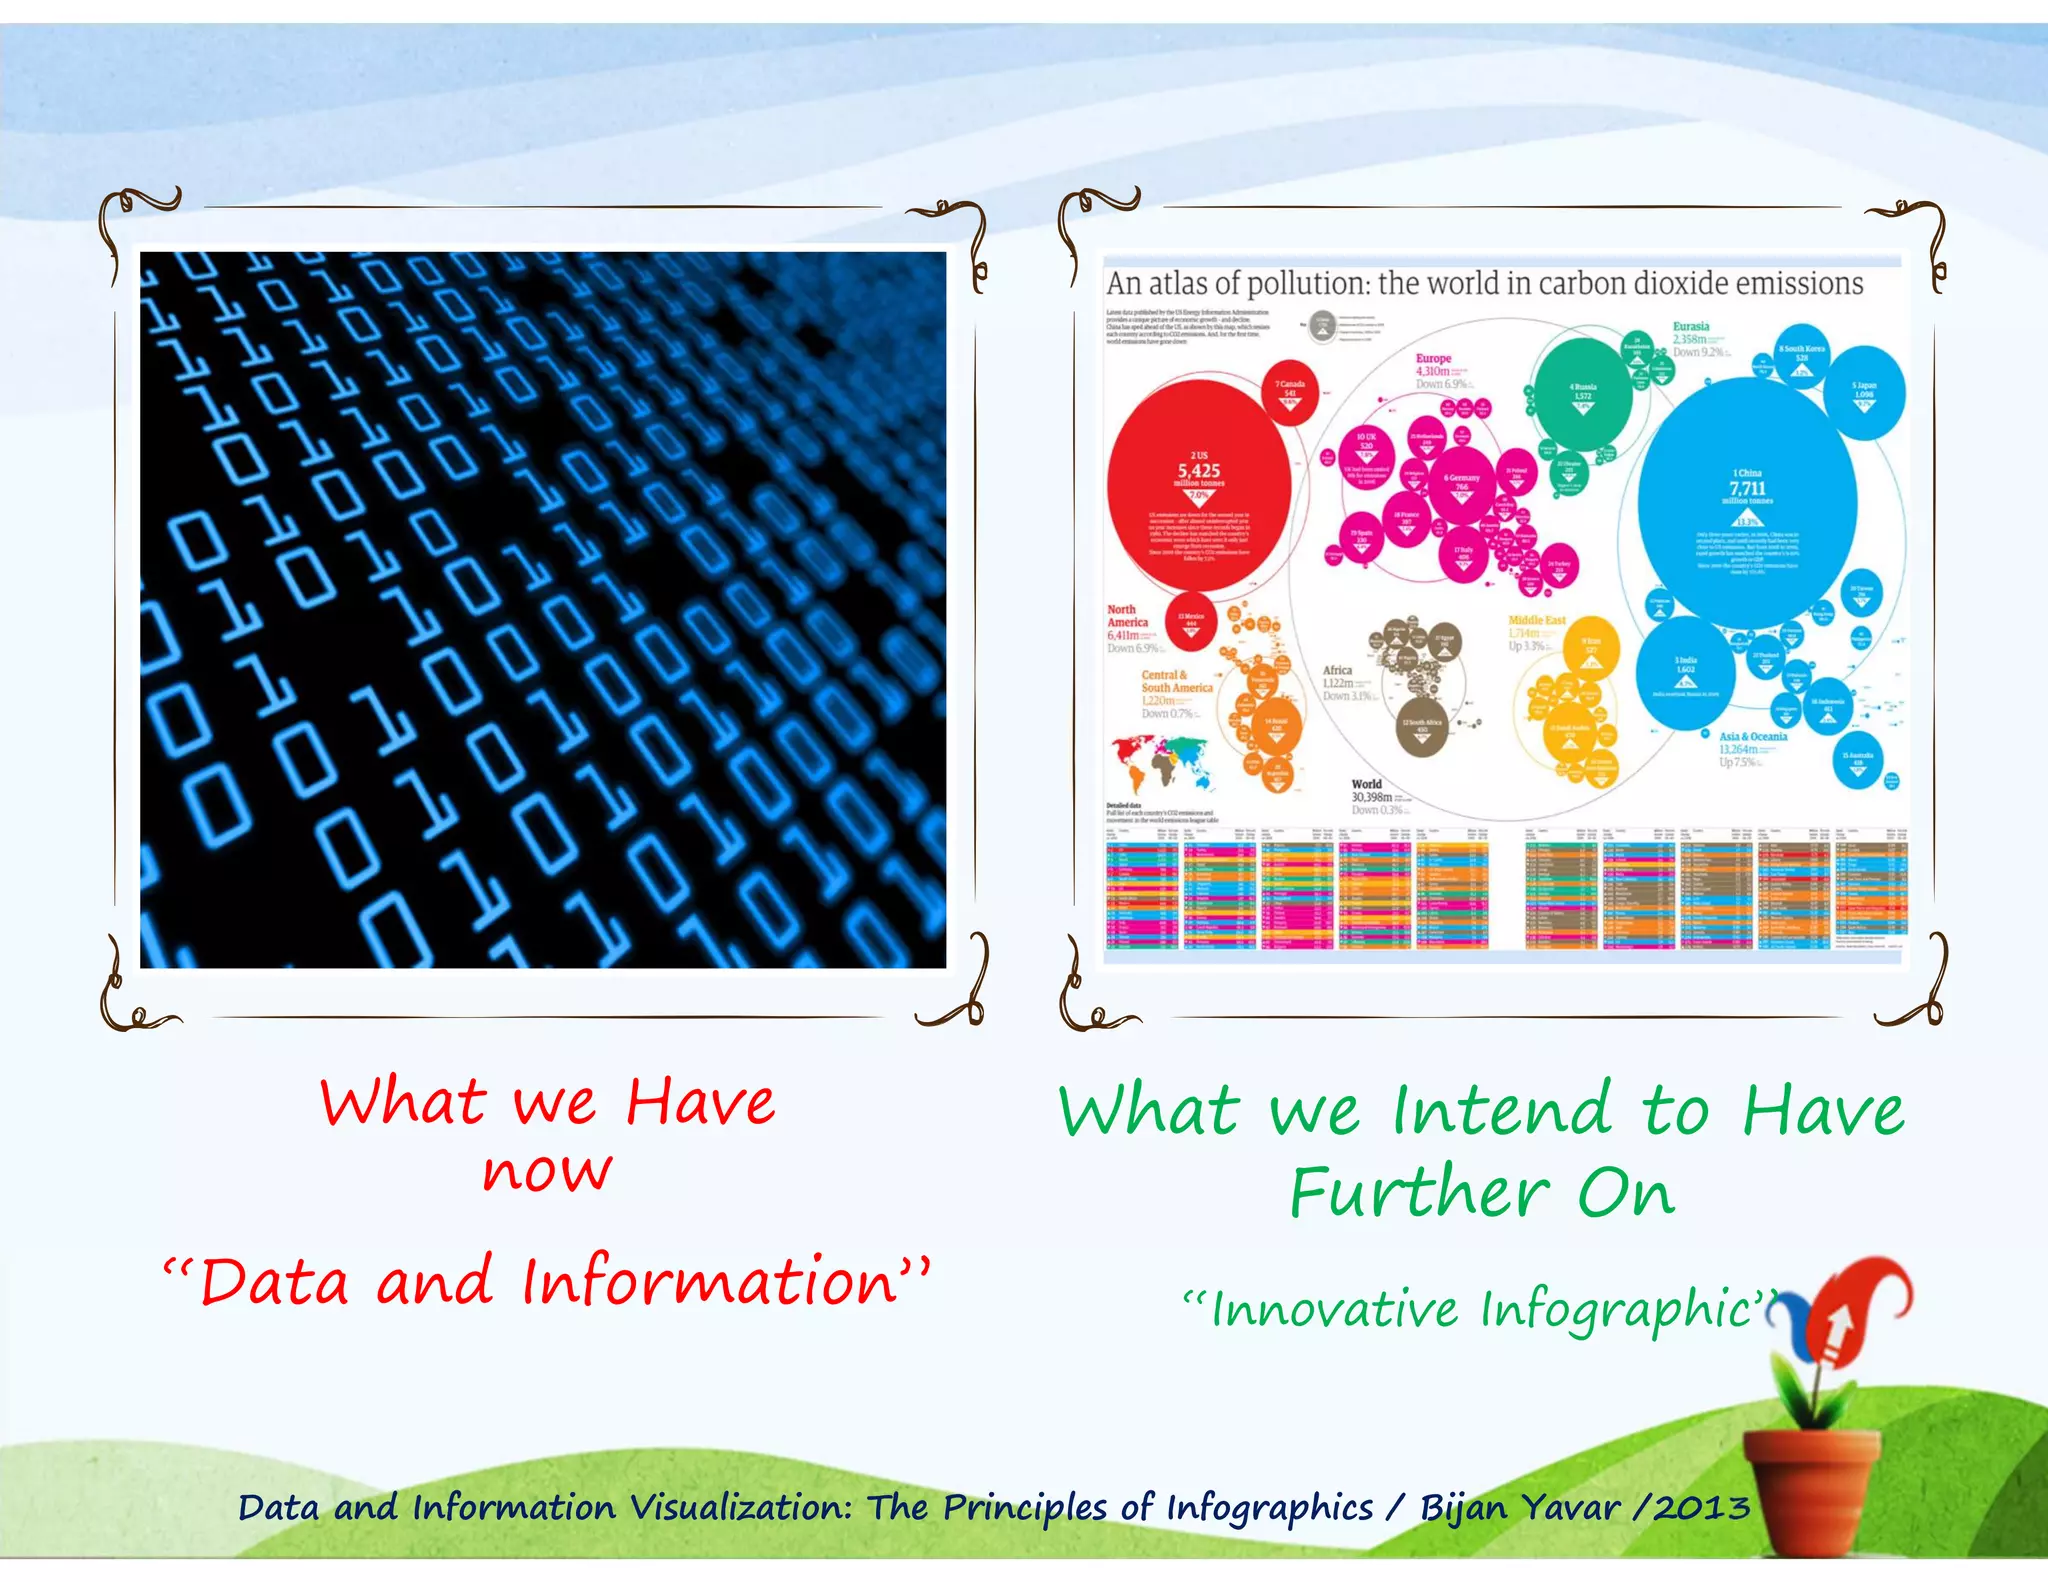


The document is a presentation by Bijan Yavar on the principles of infographics. It begins with defining infographics and data visualization. It then discusses the history and types of infographics, including static, dynamic, interactive and physical infographics. The presentation covers the traditional vs modern methods of presenting data and the structure and components of an infographic. It demonstrates infographic examples and concludes with a discussion of software skills needed for infographic design and a final examination.


![Wondershare Filmora 15.0.11 Crack for Mac Key Full Download [Latest] pptx](https://cdn.slidesharecdn.com/ss_thumbnails/software-251207184836-1d16ba16-thumbnail.jpg?width=640&height=640&fit=bounds)


![iStat Menus 7.20 Crack for MacOS 2026 Full Version [Latest] pptx](https://cdn.slidesharecdn.com/ss_thumbnails/softwareoverview-251207191544-22b737dc-thumbnail.jpg?width=640&height=640&fit=bounds)


![CleanMyMac X v5.2.8 Crack for MacOS Full Version [Latest] pptx](https://cdn.slidesharecdn.com/ss_thumbnails/softwareoverview-251207194121-a81f0142-thumbnail.jpg?width=640&height=640&fit=bounds)


![Chapter4_Initiation_of_Sediment_Motion_v2[1].pptx](https://cdn.slidesharecdn.com/ss_thumbnails/chapter4initiationofsedimentmotionv21-251208223747-f94ef163-thumbnail.jpg?width=640&height=640&fit=bounds)


![AnyTrans for iOS 8.9.14.20251127 With Crack for MacOS [Latest] pptx](https://cdn.slidesharecdn.com/ss_thumbnails/softwareoverview-251207190907-2316965f-thumbnail.jpg?width=640&height=640&fit=bounds)
