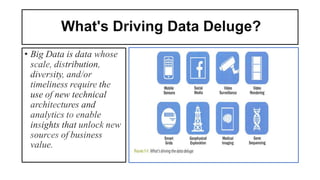
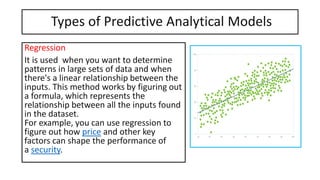
The document discusses big data and predictive analytics. It defines big data as large volumes of diverse data that require new techniques and technologies to analyze. Predictive analytics uses statistical modeling of historical data to predict future outcomes. The document provides examples of how predictive models are used in weather forecasting, customer service, and marketing. It also distinguishes predictive analytics from machine learning and discusses common predictive modeling techniques like decision trees, neural networks, and regression.

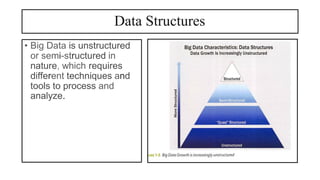
![Data Structures
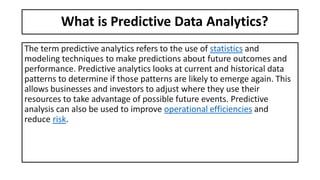
• Although analyzing structured data tends to be the most familiar
technique, a different technique is required to meet the
challenges to analyze semi-structured data (shown as XML),
quasi-structured (shown as a clickstream), and unstructured
data. Here are examples of how each of the four main types of
data structures may look.
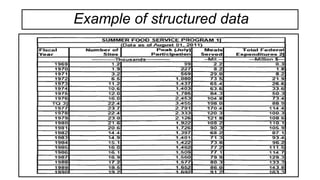
Structured data: Data containing a defined data type, format,
and structure (that is, transaction data, online analytical
processing [OLAP] data cubes, traditional RDBMS, CSV files,
and even simple spreadsheets.](https://image.slidesharecdn.com/bigdataoverview-210723115805/85/Big-data-overview-6-320.jpg)
![Data Structures
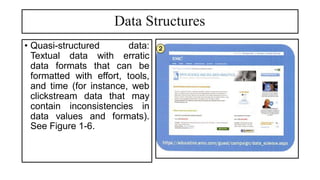
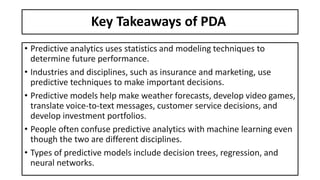
• Semi-structured data:
Textual data files with a
discernible pattern that
enables parsing (such as
Extensible Markup
Language [XML] data files
that are self describing and
defined by an XML
schema).
• See Figure 1-5..](https://image.slidesharecdn.com/bigdataoverview-210723115805/85/Big-data-overview-8-320.jpg)


![제 23회 보아즈(BOAZ) 빅데이터 컨퍼런스 - [MBOAX] : ABSA를 활용한 소비자 반응 분석 기반 운영 효율화 대시보드 설계](https://cdn.slidesharecdn.com/ss_thumbnails/3-1boaz23rdconferencemboax-260203102709-9d519923-thumbnail.jpg?width=640&height=640&fit=bounds)


