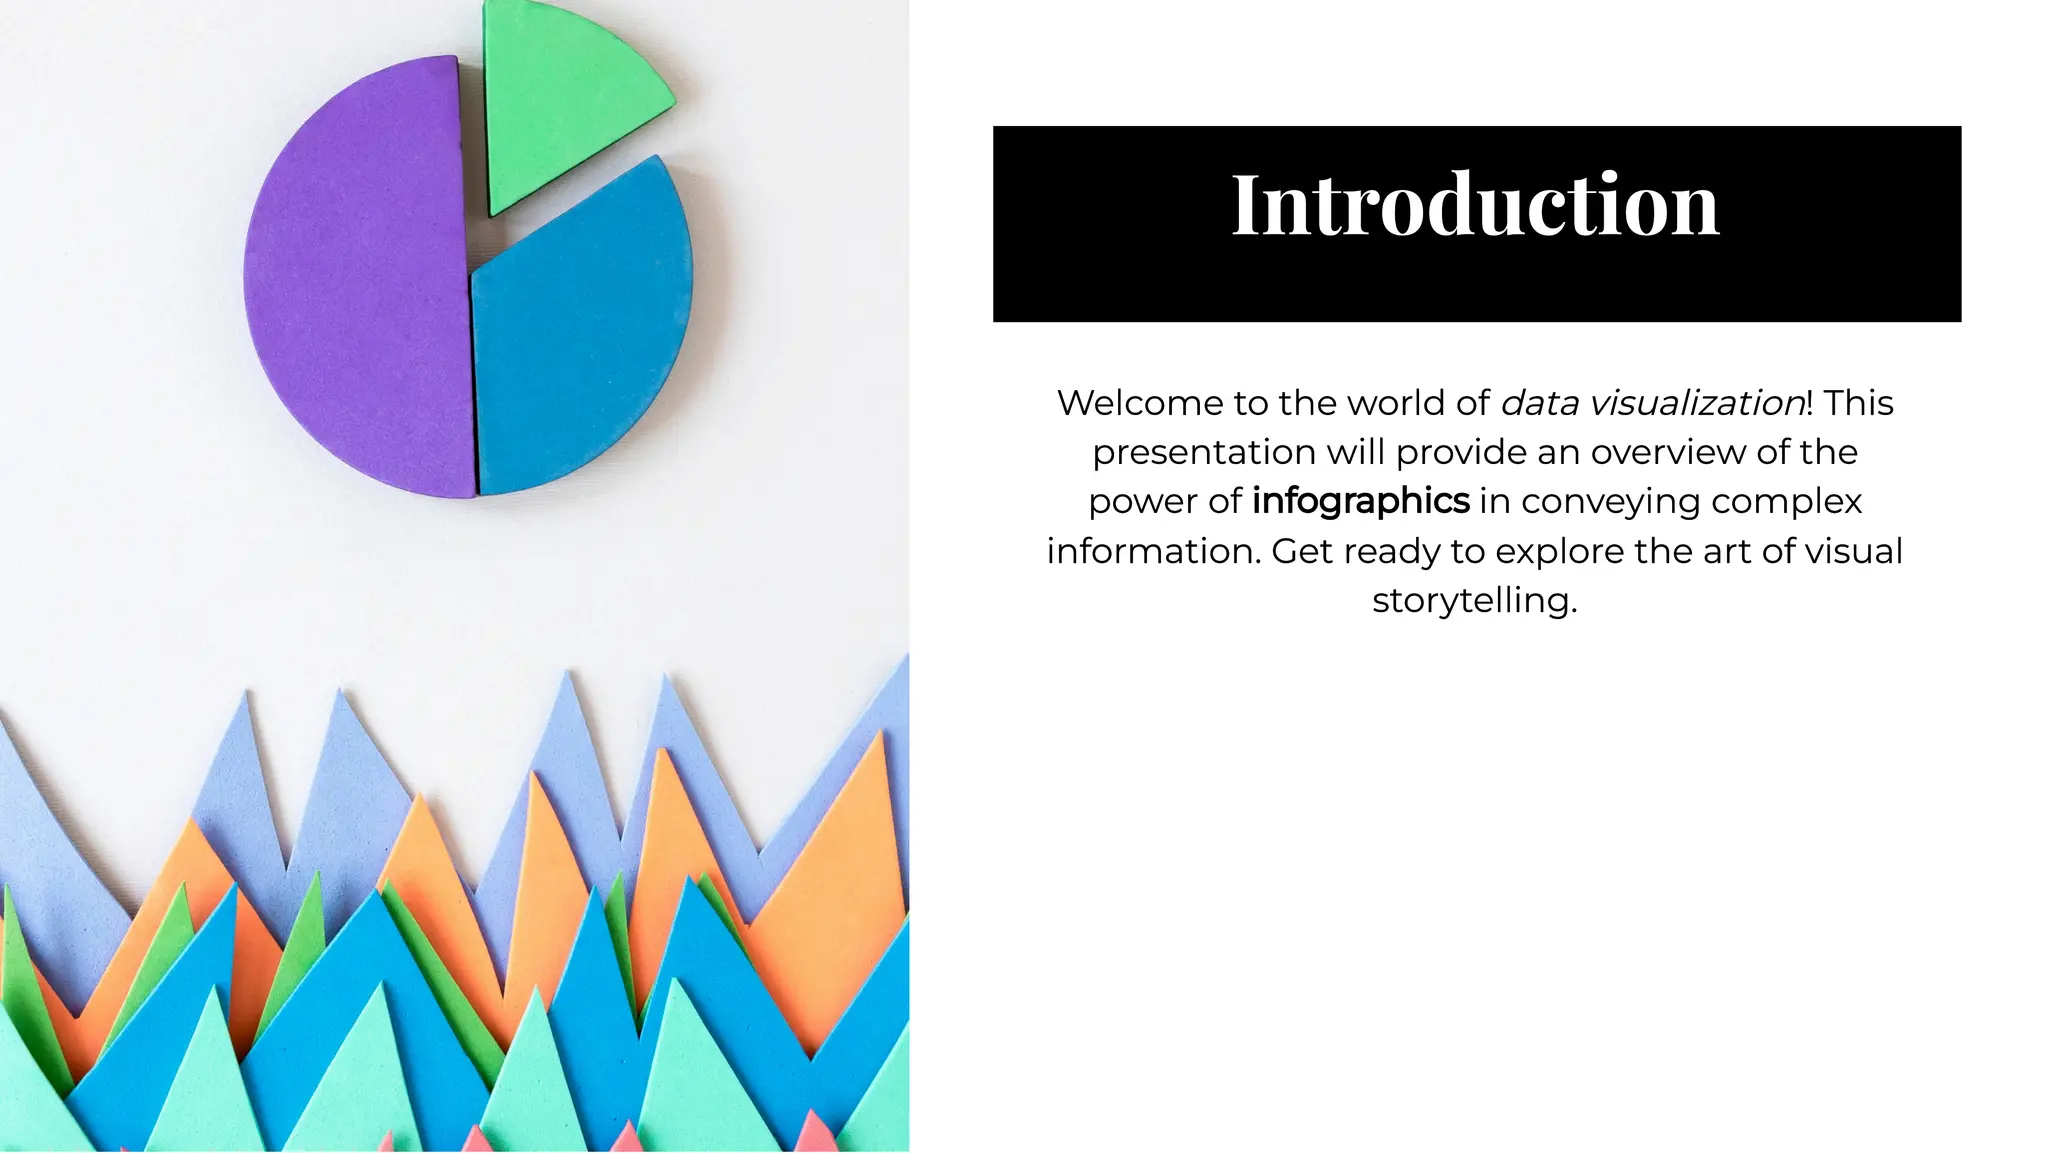
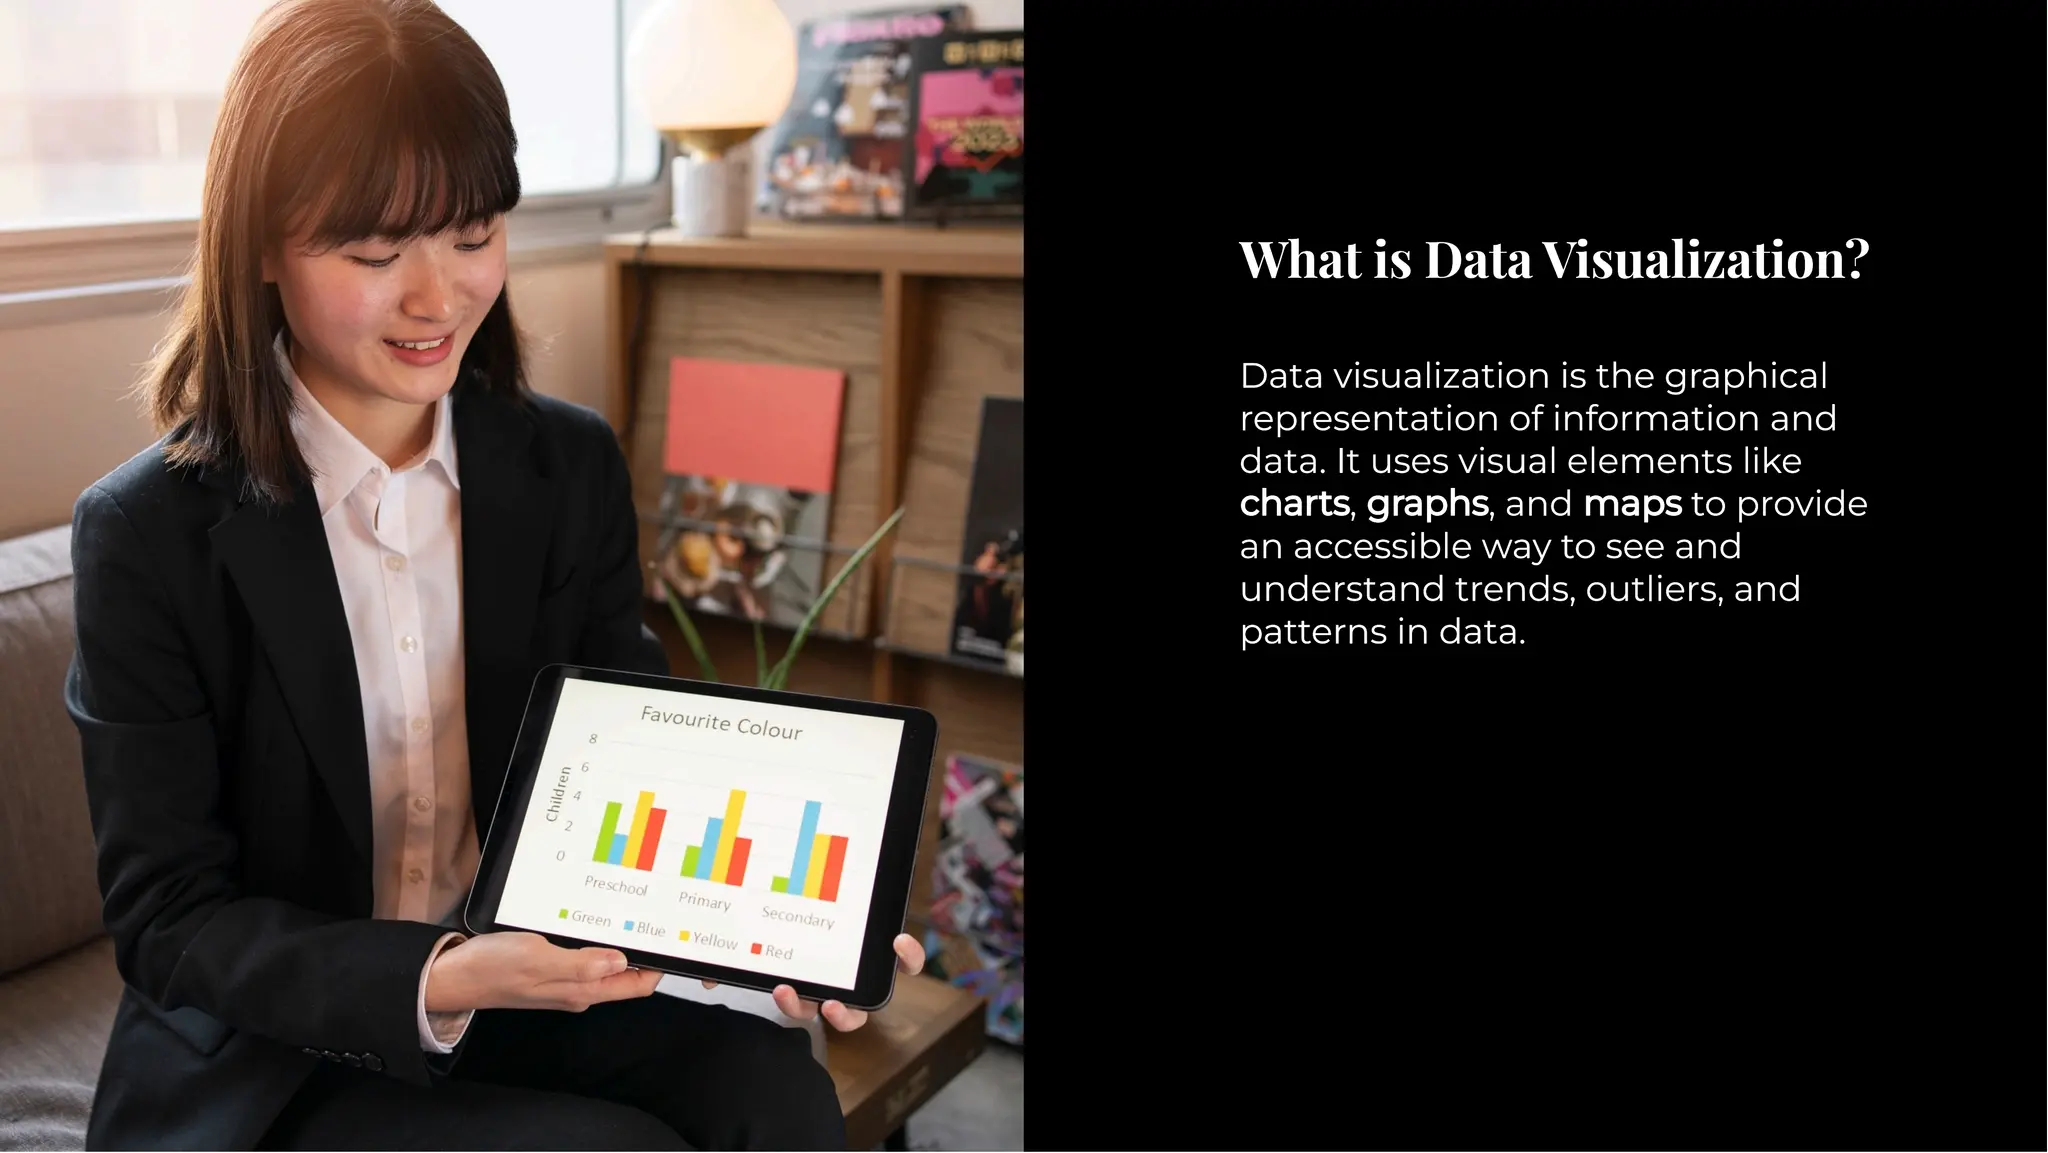
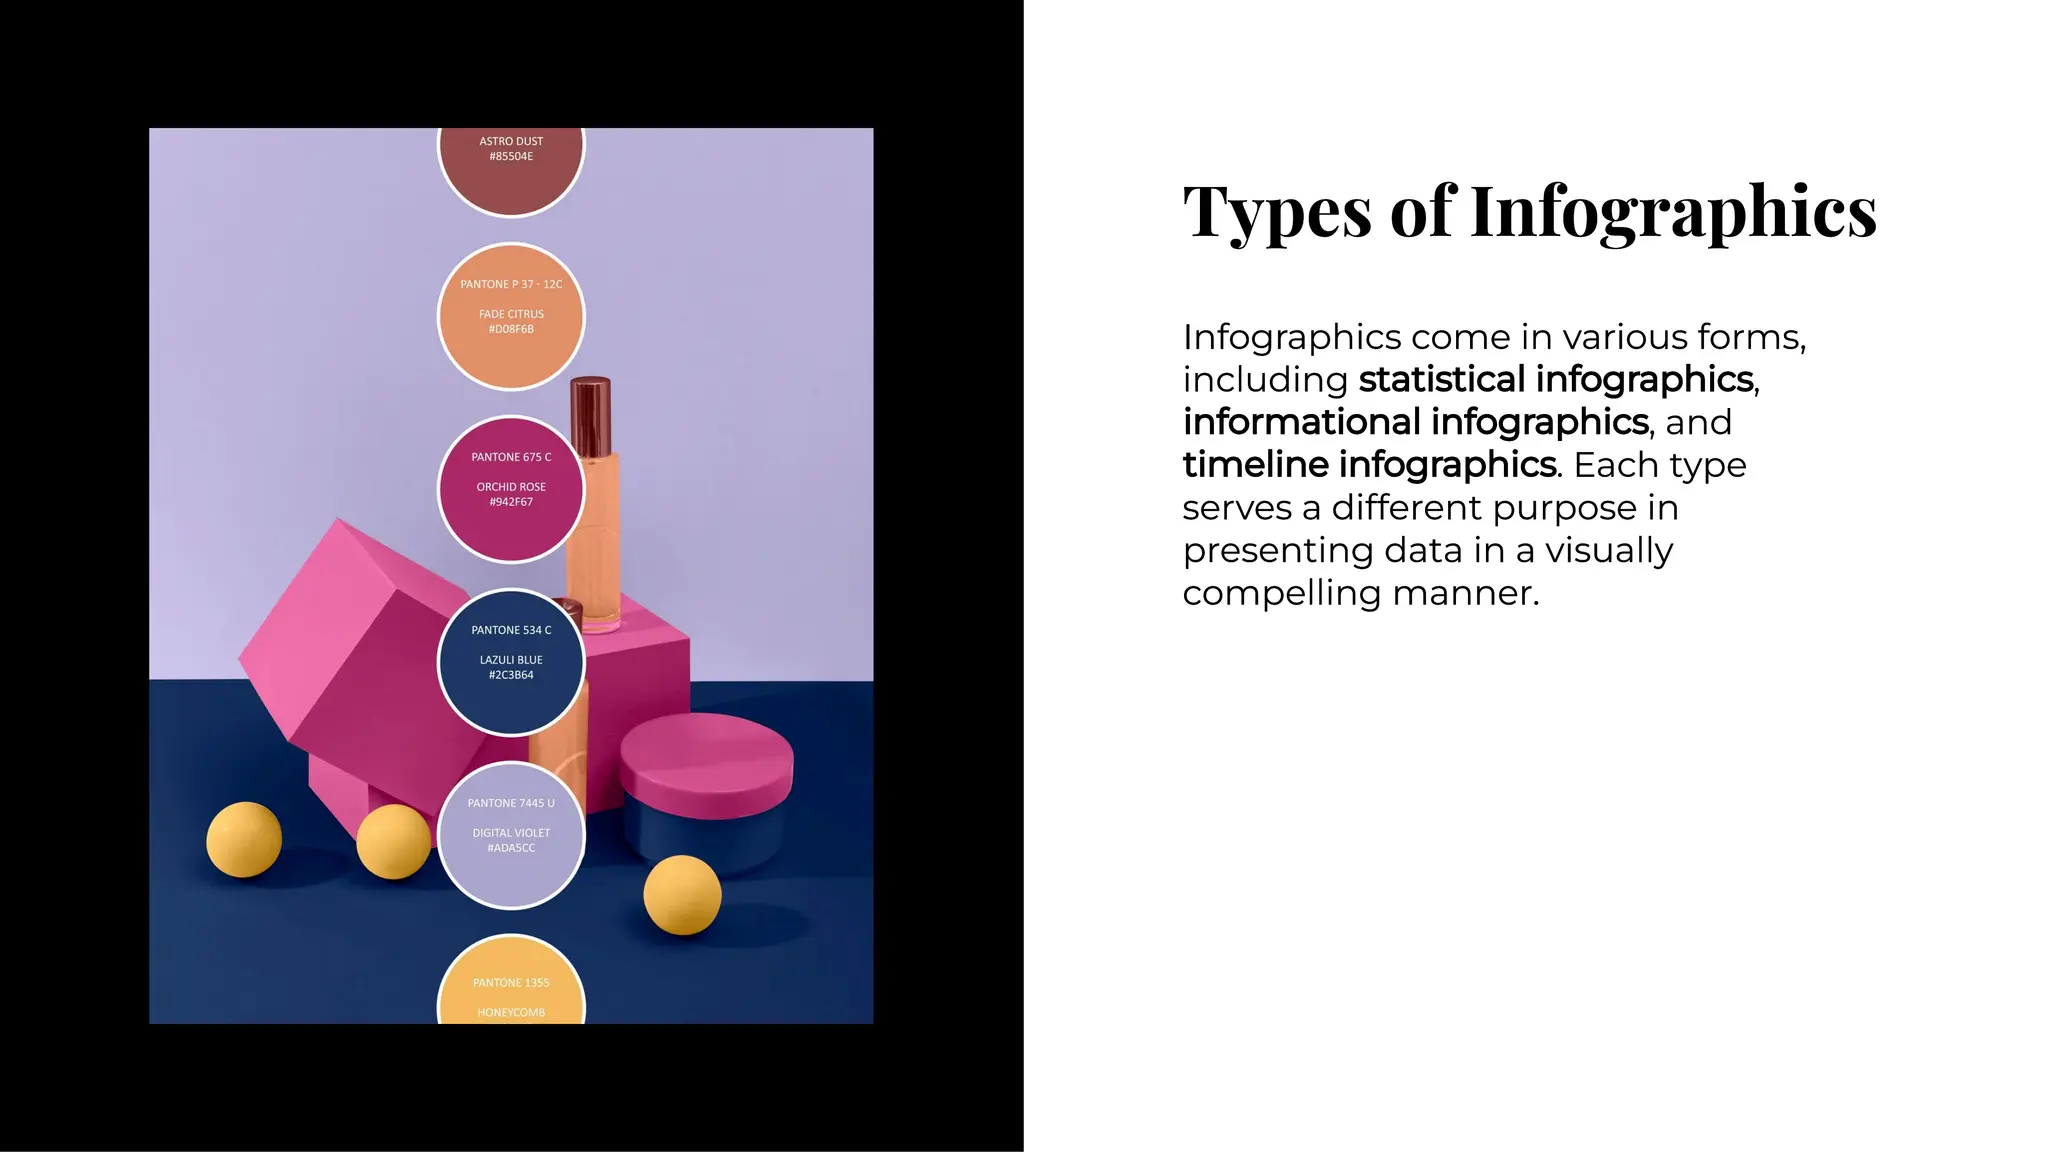
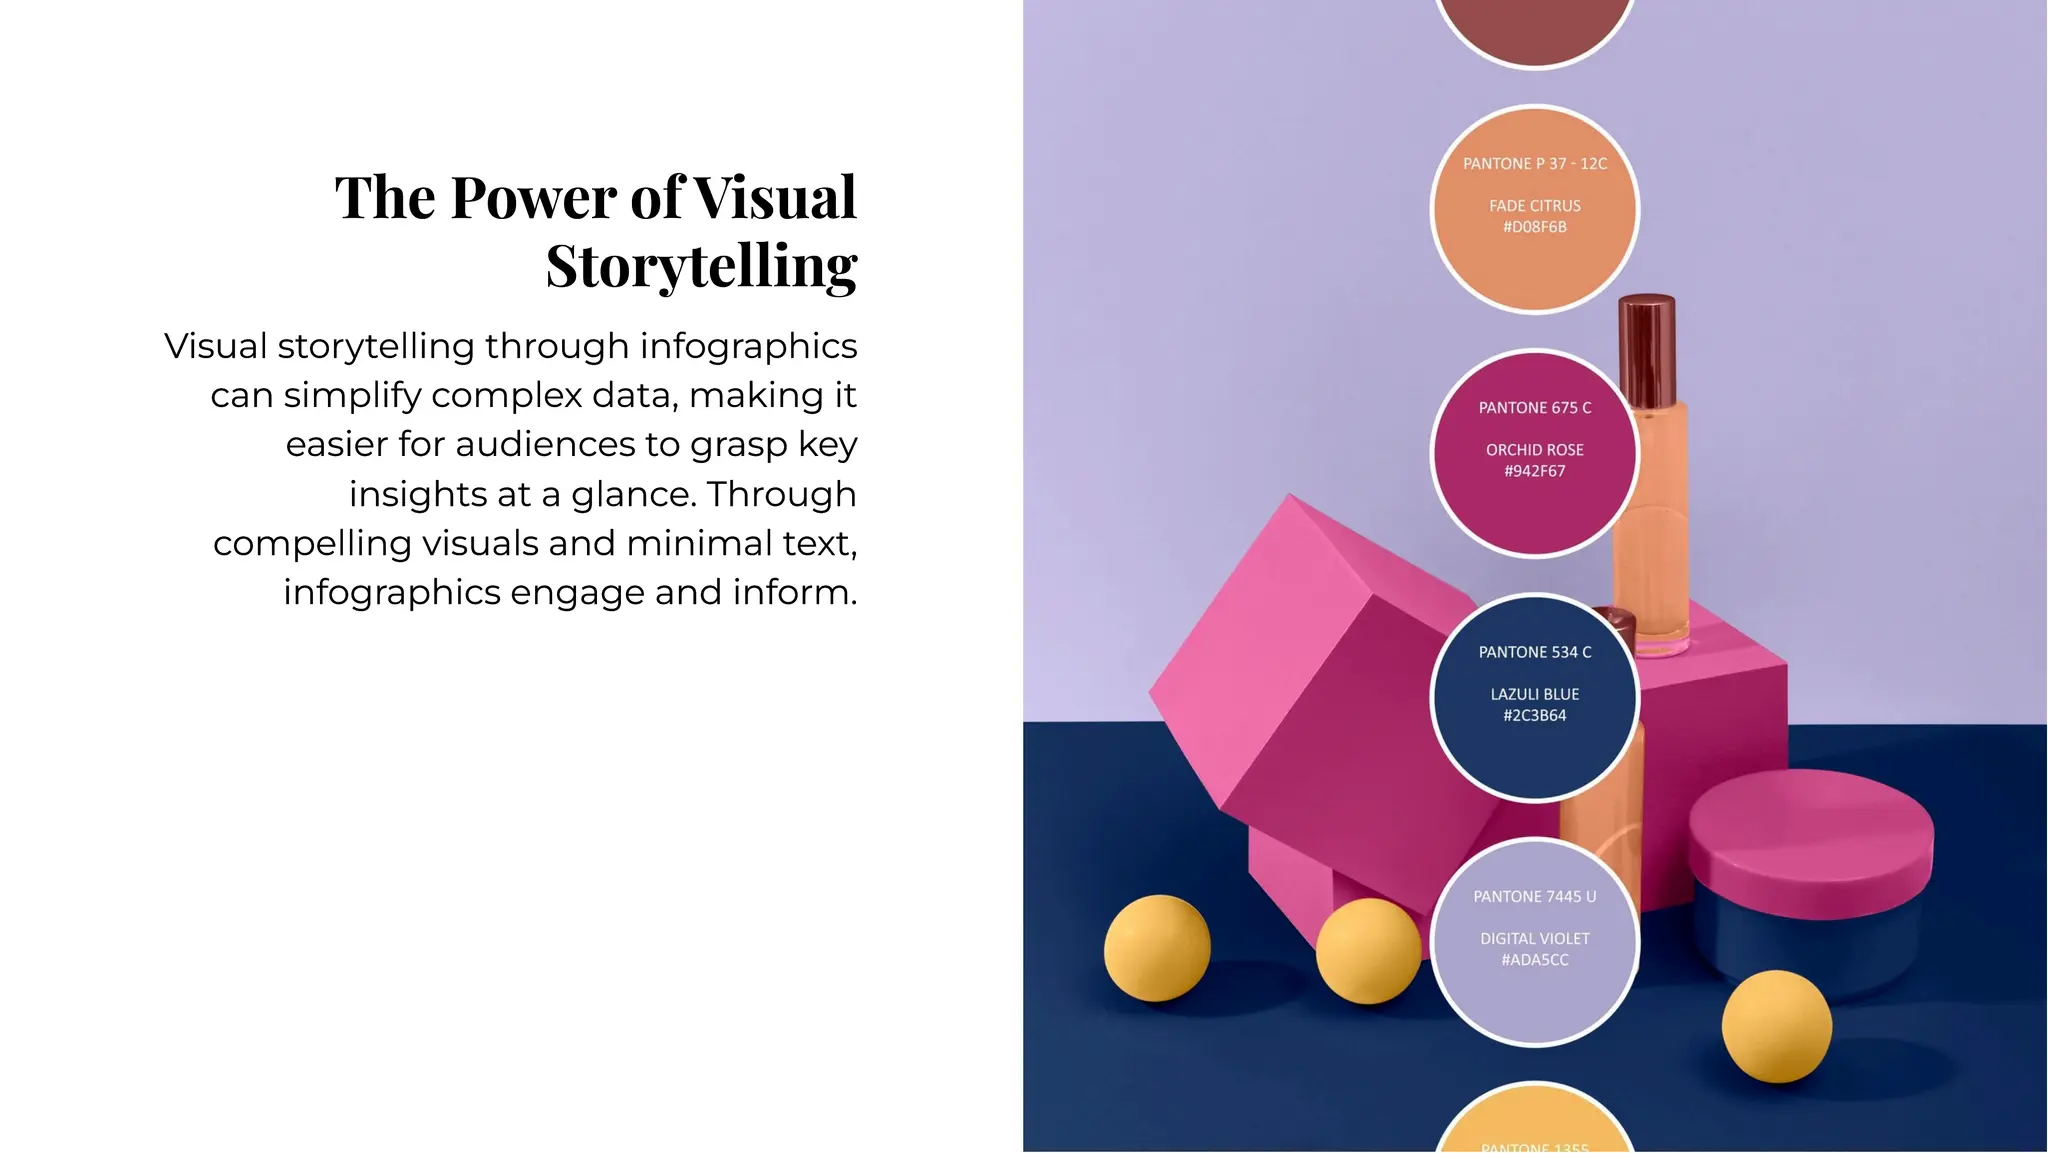
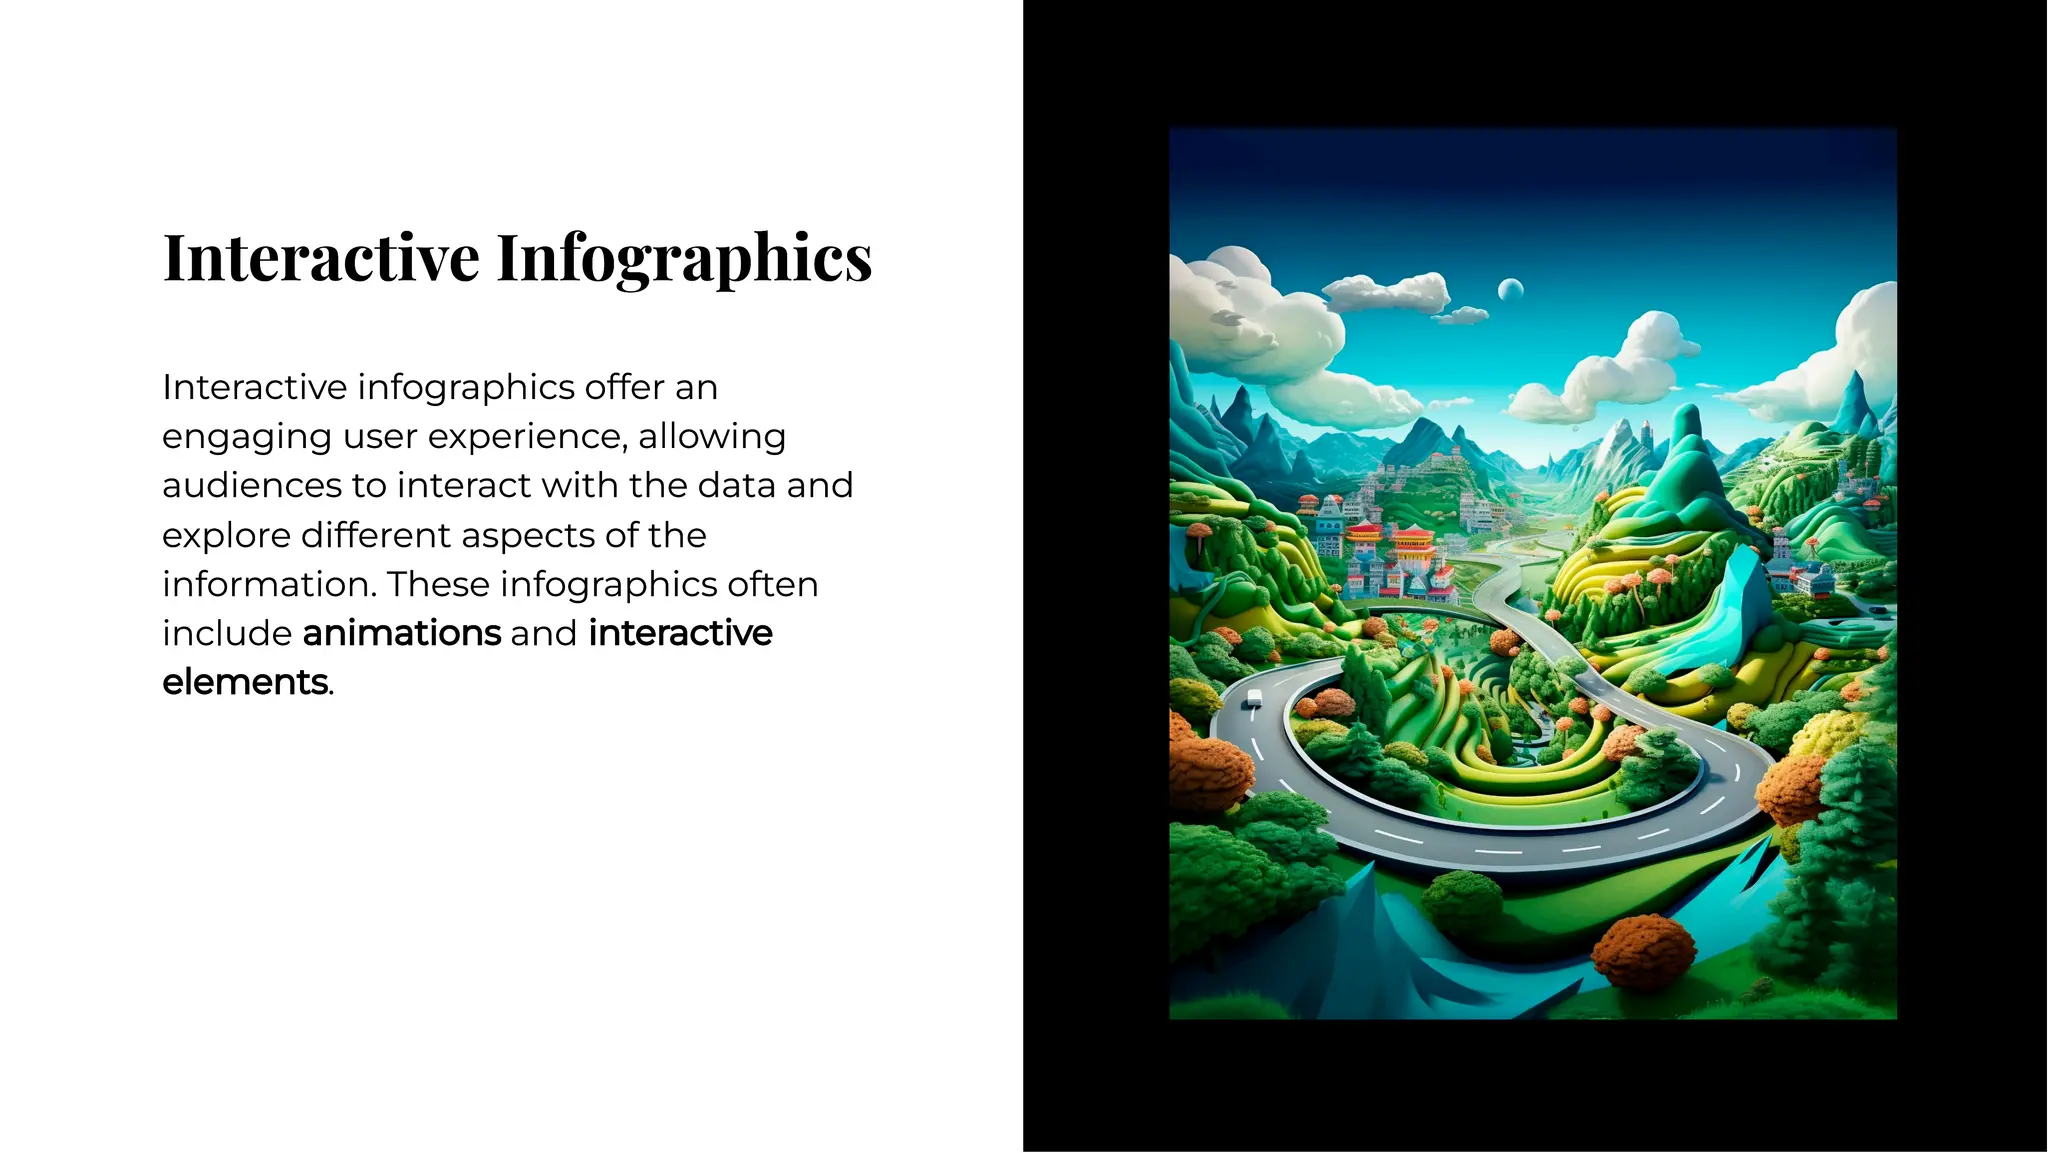
Insightful
Infographics: A
Data
Visualization
Overview
Insightful
Infographics: A
Data
Visualization
Overview
Introduction
Introduction
Welcome to the world of data visualization! This
presentation will provide an overview of the
power of infographics in conveying complex
information. Get ready to explore the art of visual
storytelling.
Welcome to the world of data visualization! This
presentation will provide an overview of the
power of infographics in conveying complex
information. Get ready to explore the art of visual
storytelling.
What is Data Visualization?
Data visualization is the graphical
representation of information and
data. It uses visual elements like
charts, graphs, and maps to provide
an accessible way to see and
understand trends, outliers, and
patterns in data.
Data visualization is the graphical
representation of information and
data. It uses visual elements like
charts, graphs, and maps to provide
an accessible way to see and
understand trends, outliers, and
patterns in data.
Types of Infographics
Infographics come in various forms,
including statistical infographics,
informational infographics, and
timeline infographics. Each type
serves a different purpose in
presenting data in a visually
compelling manner.
Infographics come in various forms,
including statistical infographics,
informational infographics, and
timeline infographics. Each type
serves a different purpose in
presenting data in a visually
compelling manner.
The Power of Visual
Storytelling
The Power of Visual
Storytelling
Visual storytelling through infographics
can simplify complex data, making it
easier for audiences to grasp key
insights at a glance. Through
compelling visuals and minimal text,
infographics engage and inform.
Visual storytelling through infographics
can simplify complex data, making it
easier for audiences to grasp key
insights at a glance. Through
compelling visuals and minimal text,
infographics engage and inform.
Design Principles for
Infographics
Design Principles for
Infographics
Effective infographics adhere to design
principles such as simplicity, clarity, and
visual hierarchy. These principles
ensure that the information is
presented in a clear and engaging
manner.
Effective infographics adhere to design
principles such as simplicity, clarity, and
visual hierarchy. These principles
ensure that the information is
presented in a clear and engaging
manner.
Data Visualization Tools
There are numerous tools available for
creating stunning infographics,
including Canva, Tableau, and
Infogram. These tools offer a range of
templates and customization options
for impactful visualizations.
There are numerous tools available for
creating stunning infographics,
including Canva, Tableau, and
Infogram. These tools offer a range of
templates and customization options
for impactful visualizations.
Best Practices for
Infographic Creation
Best Practices for
Infographic Creation
When creating infographics, it's
essential to focus on data accuracy,
visual appeal, and audience relevance.
By following best practices,
infographics can effectively convey
information and insights.
When creating infographics, it's
essential to focus on data accuracy,
visual appeal, and audience relevance.
By following best practices,
infographics can effectively convey
information and insights.
Interactive Infographics
Interactive infographics offer an
engaging user experience, allowing
audiences to interact with the data and
explore different aspects of the
information. These infographics often
include animations and interactive
elements.
Interactive infographics offer an
engaging user experience, allowing
audiences to interact with the data and
explore different aspects of the
information. These infographics often
include animations and interactive
elements.
Storytelling with Data
Combining the art of storytelling
with data visualization can create
impactful narratives that resonate
with audiences. By weaving a
compelling story through data,
infographics can evoke emotion
and understanding.
Combining the art of storytelling
with data visualization can create
impactful narratives that resonate
with audiences. By weaving a
compelling story through data,
infographics can evoke emotion
and understanding.
Visualizing Trends and
Patterns
Visualizing Trends and
Patterns
Infographics excel at highlighting
trends, patterns, and comparisons
within data. By visually representing
these insights, infographics provide a
comprehensive view of complex
information.
Infographics excel at highlighting
trends, patterns, and comparisons
within data. By visually representing
these insights, infographics provide a
comprehensive view of complex
information.
Ethical Considerations in
Data Visualization
Ethical Considerations in
Data Visualization
Data visualization comes with ethical
responsibilities, including accurate
representation, informed consent, and
transparency. It's crucial to uphold
ethical standards when presenting
data visually.
Data visualization comes with ethical
responsibilities, including accurate
representation, informed consent, and
transparency. It's crucial to uphold
ethical standards when presenting
data visually.
Future of Data
Visualization
Future of Data
Visualization
The future of data visualization is
poised for advancements in AI-
driven design, virtual reality, and
augmented reality. These
technologies will revolutionize how
we interact with and interpret data
visually.
The future of data visualization is
poised for advancements in AI-
driven design, virtual reality, and
augmented reality. These
technologies will revolutionize how
we interact with and interpret data
visually.
Conclusion
Conclusion
In conclusion, infographics are a powerful tool for conveying
complex data in a visually compelling manner. By embracing
the art of data visualization, we can unlock new insights and
engage audiences effectively.
In conclusion, infographics are a powerful tool for conveying
complex data in a visually compelling manner. By embracing
the art of data visualization, we can unlock new insights and
engage audiences effectively.
Thanks!
Thanks!
Do you have any questions?
youremail@email.com
+91 620 421 838
www.yourwebsite.com
@yourusername
Do you have any questions?
youremail@email.com
+91 620 421 838
www.yourwebsite.com
@yourusername

wepik-insightful-infographics-a-data-visualization-overview-20240401133220kwr4.pdf

  • 1.
  • 2.
    Introduction Introduction Welcome to theworld of data visualization! This presentation will provide an overview of the power of infographics in conveying complex information. Get ready to explore the art of visual storytelling. Welcome to the world of data visualization! This presentation will provide an overview of the power of infographics in conveying complex information. Get ready to explore the art of visual storytelling.
  • 3.
    What is DataVisualization? What is Data Visualization? Data visualization is the graphical representation of information and data. It uses visual elements like charts, graphs, and maps to provide an accessible way to see and understand trends, outliers, and patterns in data. Data visualization is the graphical representation of information and data. It uses visual elements like charts, graphs, and maps to provide an accessible way to see and understand trends, outliers, and patterns in data.
  • 4.
    Types of Infographics Typesof Infographics Infographics come in various forms, including statistical infographics, informational infographics, and timeline infographics. Each type serves a different purpose in presenting data in a visually compelling manner. Infographics come in various forms, including statistical infographics, informational infographics, and timeline infographics. Each type serves a different purpose in presenting data in a visually compelling manner.
  • 5.
    The Power ofVisual Storytelling The Power of Visual Storytelling Visual storytelling through infographics can simplify complex data, making it easier for audiences to grasp key insights at a glance. Through compelling visuals and minimal text, infographics engage and inform. Visual storytelling through infographics can simplify complex data, making it easier for audiences to grasp key insights at a glance. Through compelling visuals and minimal text, infographics engage and inform.
  • 6.
    Design Principles for Infographics DesignPrinciples for Infographics Effective infographics adhere to design principles such as simplicity, clarity, and visual hierarchy. These principles ensure that the information is presented in a clear and engaging manner. Effective infographics adhere to design principles such as simplicity, clarity, and visual hierarchy. These principles ensure that the information is presented in a clear and engaging manner.
  • 7.
    Data Visualization Tools DataVisualization Tools There are numerous tools available for creating stunning infographics, including Canva, Tableau, and Infogram. These tools offer a range of templates and customization options for impactful visualizations. There are numerous tools available for creating stunning infographics, including Canva, Tableau, and Infogram. These tools offer a range of templates and customization options for impactful visualizations.
  • 8.
    Best Practices for InfographicCreation Best Practices for Infographic Creation When creating infographics, it's essential to focus on data accuracy, visual appeal, and audience relevance. By following best practices, infographics can effectively convey information and insights. When creating infographics, it's essential to focus on data accuracy, visual appeal, and audience relevance. By following best practices, infographics can effectively convey information and insights.
  • 9.
    Interactive Infographics Interactive Infographics Interactiveinfographics offer an engaging user experience, allowing audiences to interact with the data and explore different aspects of the information. These infographics often include animations and interactive elements. Interactive infographics offer an engaging user experience, allowing audiences to interact with the data and explore different aspects of the information. These infographics often include animations and interactive elements.
  • 10.
    Storytelling with Data Storytellingwith Data Combining the art of storytelling with data visualization can create impactful narratives that resonate with audiences. By weaving a compelling story through data, infographics can evoke emotion and understanding. Combining the art of storytelling with data visualization can create impactful narratives that resonate with audiences. By weaving a compelling story through data, infographics can evoke emotion and understanding.
  • 11.
    Visualizing Trends and Patterns VisualizingTrends and Patterns Infographics excel at highlighting trends, patterns, and comparisons within data. By visually representing these insights, infographics provide a comprehensive view of complex information. Infographics excel at highlighting trends, patterns, and comparisons within data. By visually representing these insights, infographics provide a comprehensive view of complex information.
  • 12.
    Ethical Considerations in DataVisualization Ethical Considerations in Data Visualization Data visualization comes with ethical responsibilities, including accurate representation, informed consent, and transparency. It's crucial to uphold ethical standards when presenting data visually. Data visualization comes with ethical responsibilities, including accurate representation, informed consent, and transparency. It's crucial to uphold ethical standards when presenting data visually.
  • 13.
    Future of Data Visualization Futureof Data Visualization The future of data visualization is poised for advancements in AI- driven design, virtual reality, and augmented reality. These technologies will revolutionize how we interact with and interpret data visually. The future of data visualization is poised for advancements in AI- driven design, virtual reality, and augmented reality. These technologies will revolutionize how we interact with and interpret data visually.
  • 14.
    Conclusion Conclusion In conclusion, infographicsare a powerful tool for conveying complex data in a visually compelling manner. By embracing the art of data visualization, we can unlock new insights and engage audiences effectively. In conclusion, infographics are a powerful tool for conveying complex data in a visually compelling manner. By embracing the art of data visualization, we can unlock new insights and engage audiences effectively.
  • 15.
    Thanks! Thanks! Do you haveany questions? youremail@email.com +91 620 421 838 www.yourwebsite.com @yourusername Do you have any questions? youremail@email.com +91 620 421 838 www.yourwebsite.com @yourusername