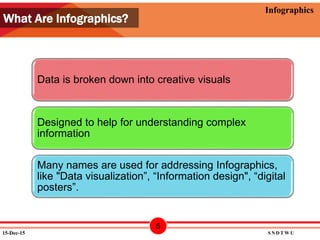
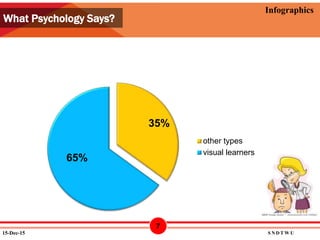
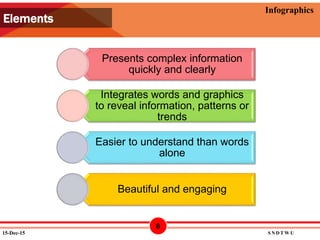
12/15/2015
Infographics
Content Outline
 Introduction
 Objectives
 What are Infographics?
 Why are Infographics important?
 History: How it all started!
 Steps to keep in mind while making an Infographic
 Educational implications of Infographics
 Drawbacks of Infographics
 Types of Infographics
 Tools to use for making Infographics
15-Dec-15 S N D T W U
2
12/15/2015
Infographics
 It is an age of “Big Data”
 In one day we create:
 1.5 billion pieces of content
140 million messages and
Around 2 million videos
 We make constant attempts to organize and collate
information
 Now we have a powerful strategy which is called
“Infographics”.
Introduction
15-Dec-15 S N D T W U
3
12/15/2015
Infographics
At the end of this seminar, you will be able to:
 Explain the concept of Infographics in your own
words
 Differentiate between Infographics and other visual
data representations
 Describe the educational implications of
Inforgraphics in your own words
 Discuss the drawbacks of Infographics
 Identify and state the types of Infographics
 Create info graphics with the help of appropriate
tools
 Use info graphics in various arenas of teaching and
learning
Objectives
15-Dec-15 S N D T W U
4
12/15/2015
Infographics
Data is broken down into creative visuals
Designed to help for understanding complex
information
Many names are used for addressing Infographics,
like "Data visualization”, “Information design", “digital
posters”.
What Are Infographics?
15-Dec-15 S N D T W U
5
12/15/2015
Infographics
• Consumers are attracted to the information.
• It is engaging
• Better than posting plain bullets and text.
STORE/SHARE
• A common side effect of the look at me syndrome
Look At Me Syndrome
15-Dec-15 S N D T W U
6
12/15/2015
Infographics
35%
65%
other types
visual learners
What Psychology Says?
15-Dec-15 S N D T W U
7
12/15/2015
Infographics
Presents complex information
quickly and clearly
Integrates words and graphics
to reveal information, patterns or
trends
Easier to understand than words
alone
Beautiful and engaging
Elements
15-Dec-15 S N D T W U
8
12/15/2015
Infographics
A common question that may arise:
Why suddenly the use of Infographics
Why Are They Important?
15-Dec-15 S N D T W U
9
12/15/2015
Infographics
To convey a complicated subjects
easily
Presentation of statistics in a very
simple manner
A way to grab the attention of your
audience
New way of seeing data
Makes information presentable and
digestible
Clear and straightforward
The Answer…
15-Dec-15 S N D T W U
10
12/15/2015
Infographics
• Infographics have a flow to them
• Presents complex information quickly and clearly
• Examples: maps, signs, and charts
• Deep data is presented in visual format
• Mix of design and writing
• Communication is visually compelling
How Are They Different?
15-Dec-15 S N D T W U
11
12/15/2015
Infographics
• Cave paintings from 30,000 BC
• Egyptian hieroglyphics around 3000 BC
• 1933- Harry Beck
How It All Started?
15-Dec-15 S N D T W U
12
12/15/2015
Infographics
• Recent history includes the advent of charts in office-
oriented software, particularly Excel and PowerPoint
15-Dec-15 S N D T W U
13
Continue….
12/15/2015
Infographics
Add
Context
Do More
Know Your
Options
Strive for
Elegance
and Clarity
Reach out
to people
Steps To Keep In Mind
15-Dec-15 S N D T W U
14
12/15/2015
Infographics
• Short Attention Spans
• Easy to Understand
• More Engaging
• Shows an Expert understanding of a Subject
Educational Implications
15-Dec-15 S N D T W U
15
12/15/2015
Infographics
• Information Overload
• Retention
• Compelling and Attractive
• A Picture is worth a Thousand Words
15-Dec-15 S N D T W U
16
Educational Implications
12/15/2015
Infographics
Seeking
information
is confusing
Difficult to
comprehend
May look
cluttered
Drawbacks
15-Dec-15 S N D T W U
17
12/15/2015
Infographics
15-Dec-15 S N D T W U
18
12/15/2015
Infographics
How To (Process Oriented)
15-Dec-15 S N D T W U
19
12/15/2015
Infographics
Research Result
15-Dec-15 S N D T W U
20
12/15/2015
Infographics
Compare And Contrast
15-Dec-15 S N D T W U
21
12/15/2015
Infographics
Timeline
15-Dec-15 S N D T W U
22
12/15/2015
Infographics
Infogr.am Wordle Dipity
Tools To Use
15-Dec-15 S N D T W U
23
12/15/2015
Infographics
15-Dec-15 S N D T W U
24
Tools To Use
Demonstration
12/15/2015
Infographics
15-Dec-15 S N D T W U
25
If its difficult and you are in a fix…
Don’t worry..
Switch to Infographics!
12/15/2015
Infographics
15-Dec-15 S N D T W U
26
12/15/2015
Infographics
http://www.slideshare.net/adidhotre/slide-share-
itsallaboutinfographics
http://mashable.com/category/infographics/
http://visual.ly/what-is-an-infographic
http://www.ritholtz.com/blog/2013/04/all-about-infographics/
http://infographicjournal.com/
15-Dec-15 S N D T W U
27
Bibliography
12/15/2015
Infographics
15-Dec-15 S N D T W U
28

An Introduction to Infographics