Download as PDF, PPTX


The document discusses the concepts and importance of big data, business intelligence, and data analytics, emphasizing their roles in informed decision-making in today's complex business environment. It outlines the characteristics of big data, types of data, and the significance of bridging the information gap through effective data handling. Additionally, it highlights various opportunities presented by big data, including quality improvement and fraud detection in businesses.
Introduction to Big Data and data analytics by Seta A. Wicaksana. Includes an outline of the modules covered in the presentation.
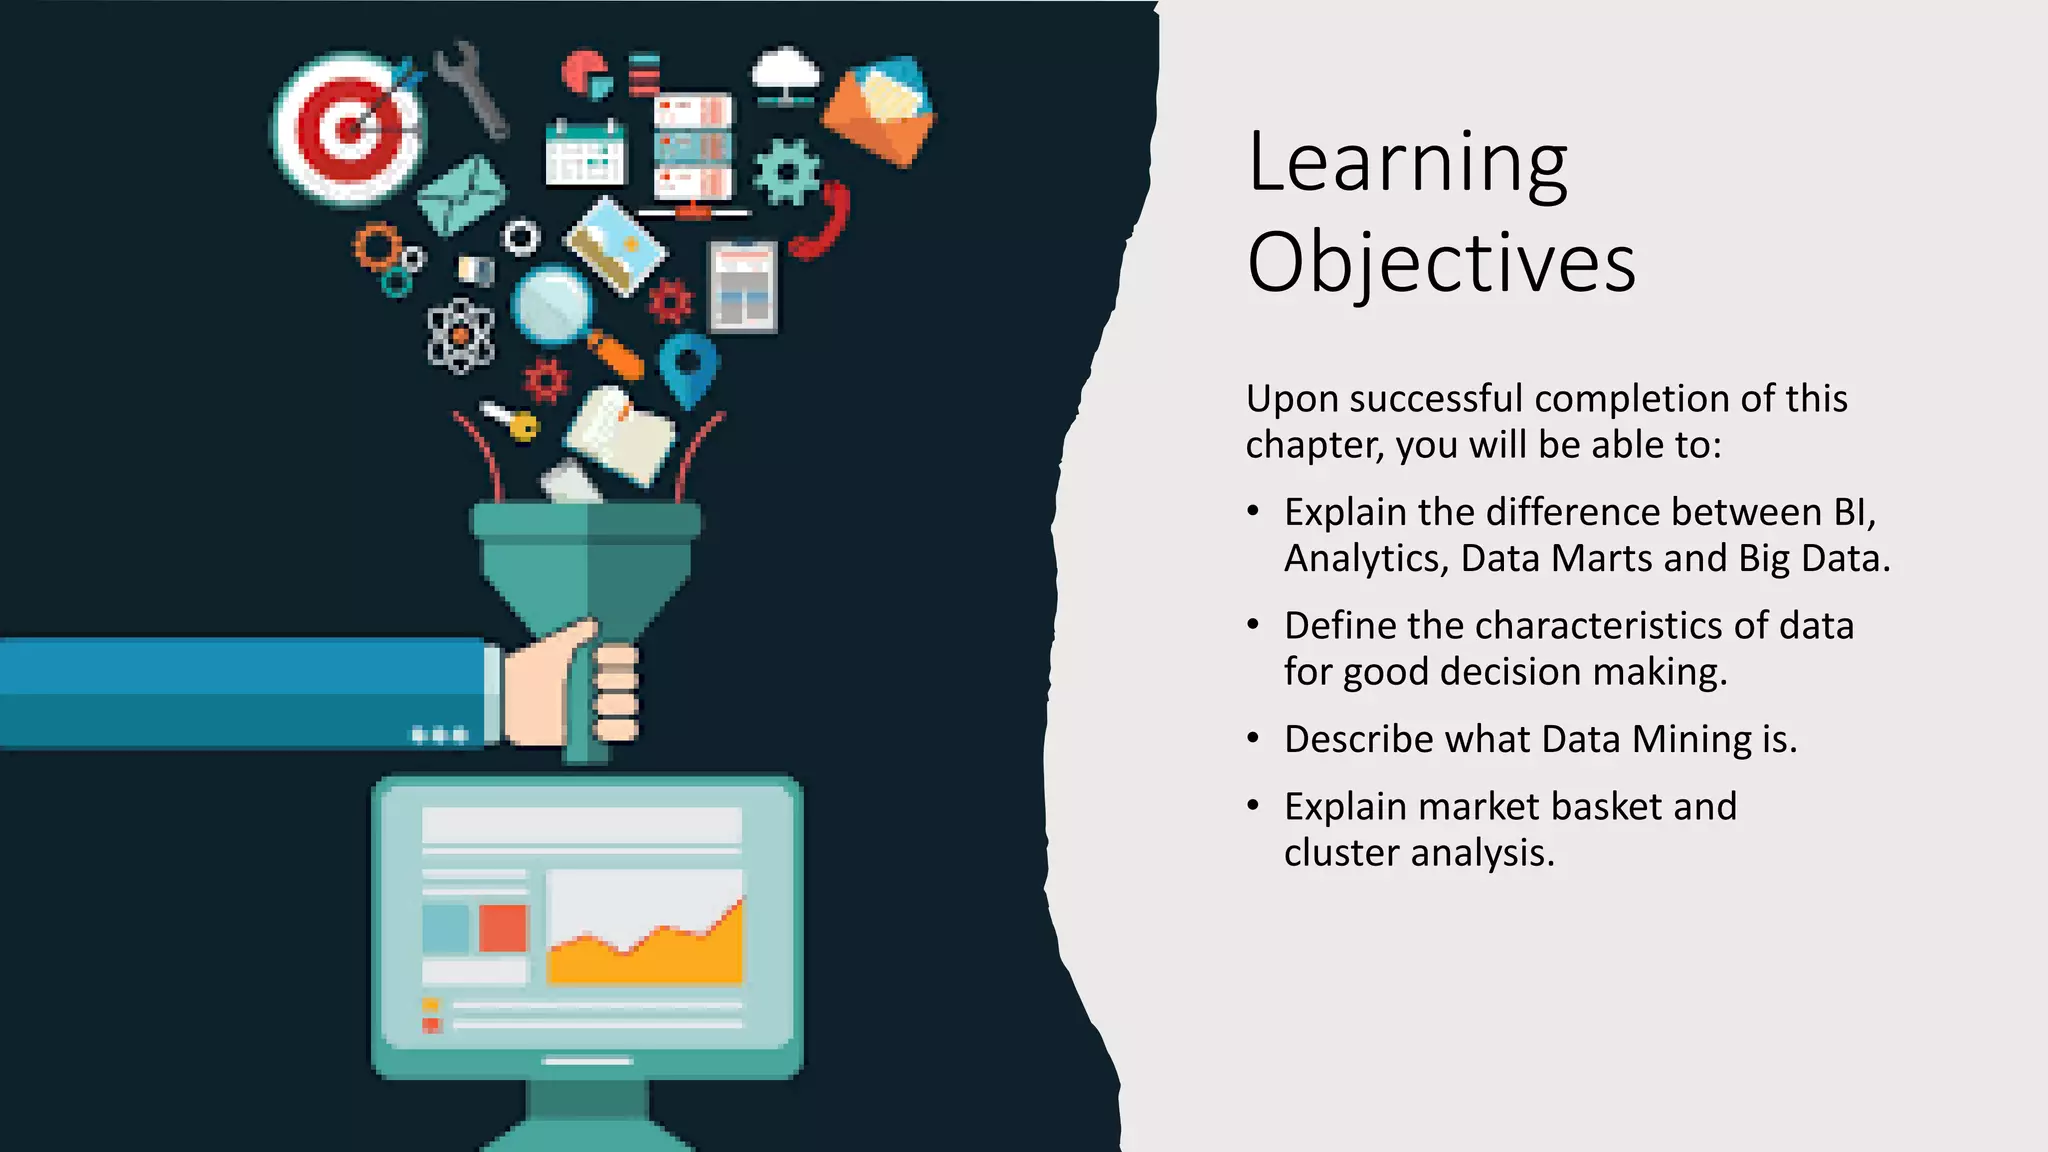
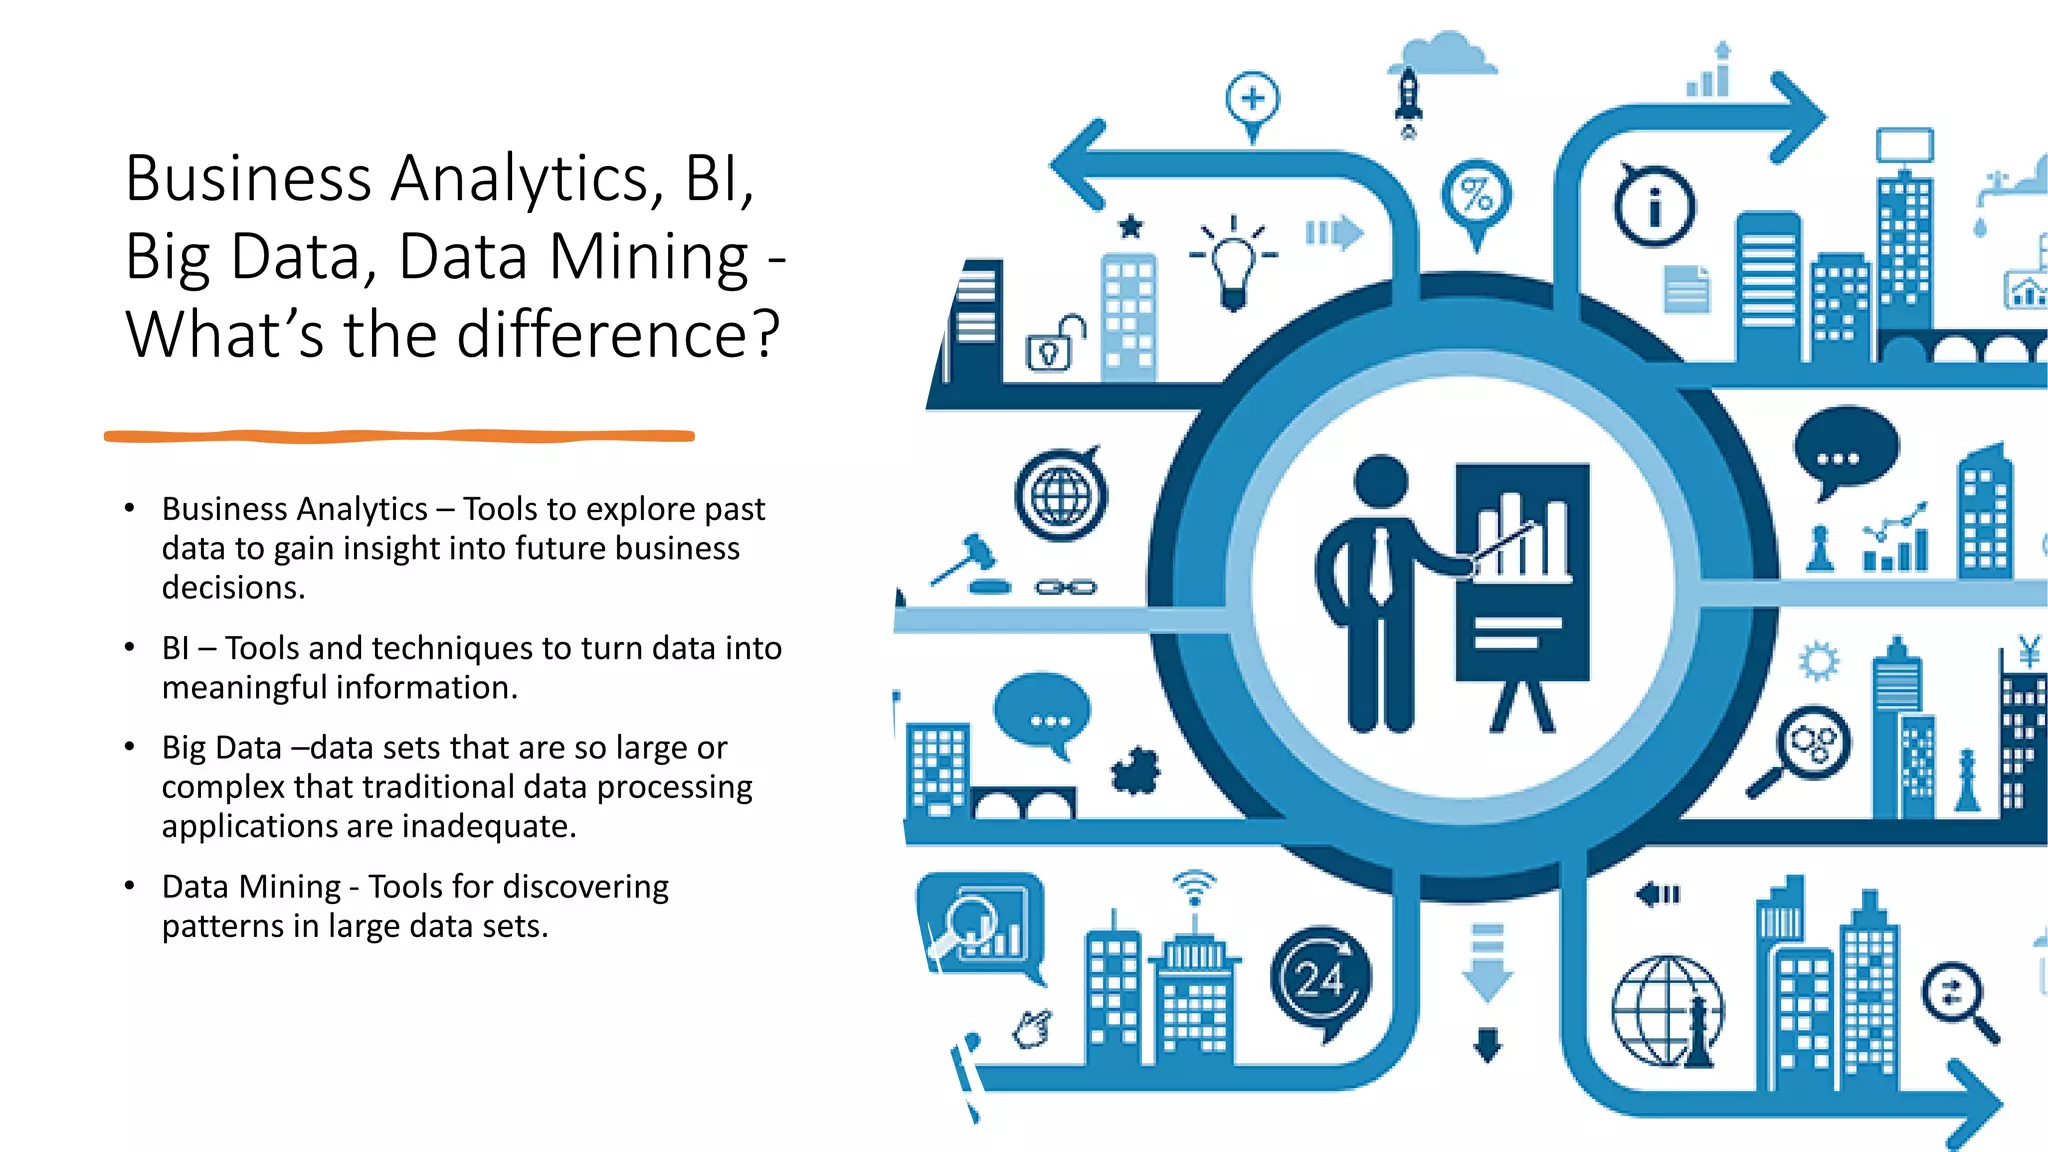
Learning objectives and definitions of Business Analytics, BI, Big Data, and Data Mining. Clarifies their differences.
Learning objectives and definitions of Business Analytics, BI, Big Data, and Data Mining. Clarifies their differences.
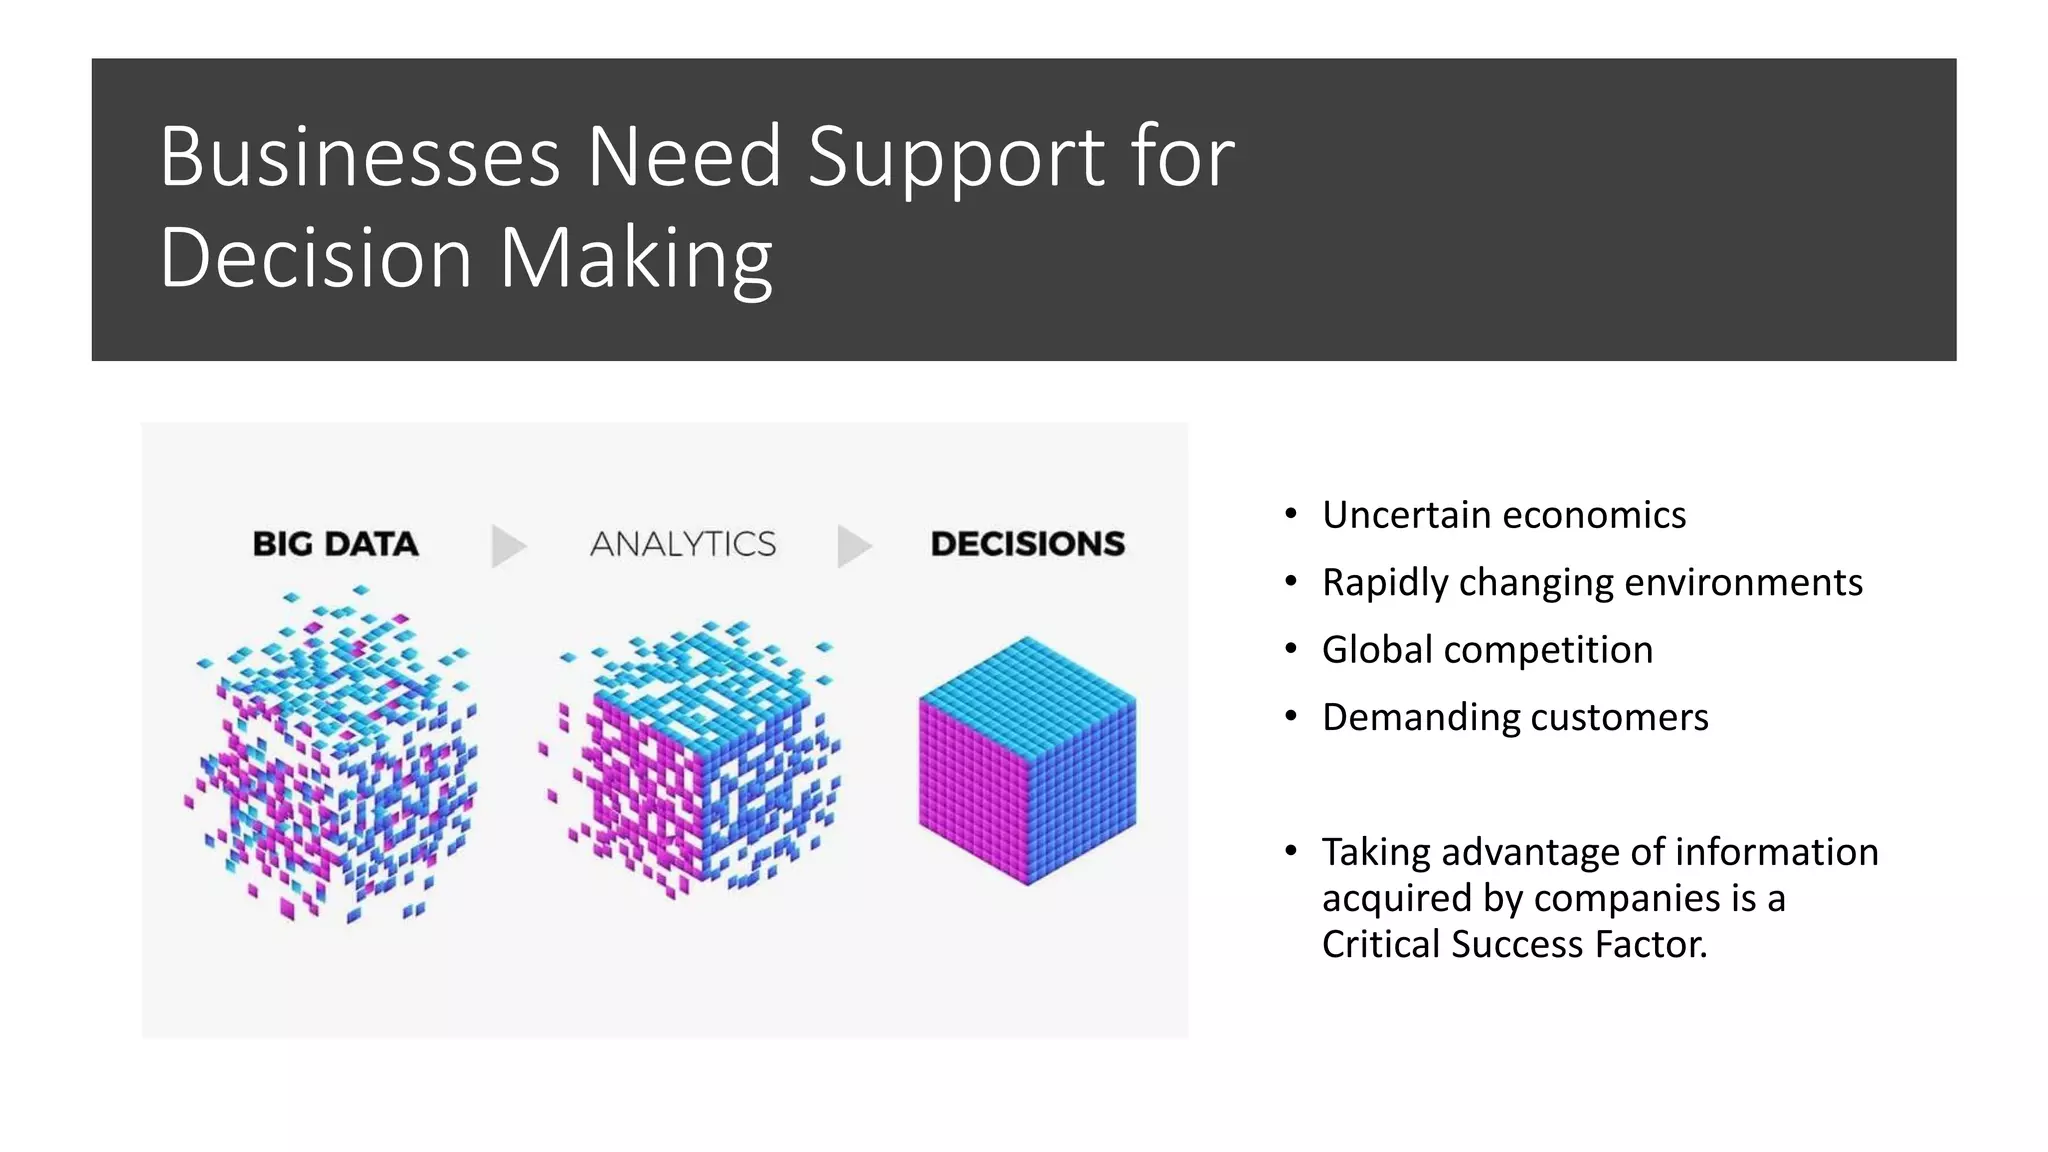
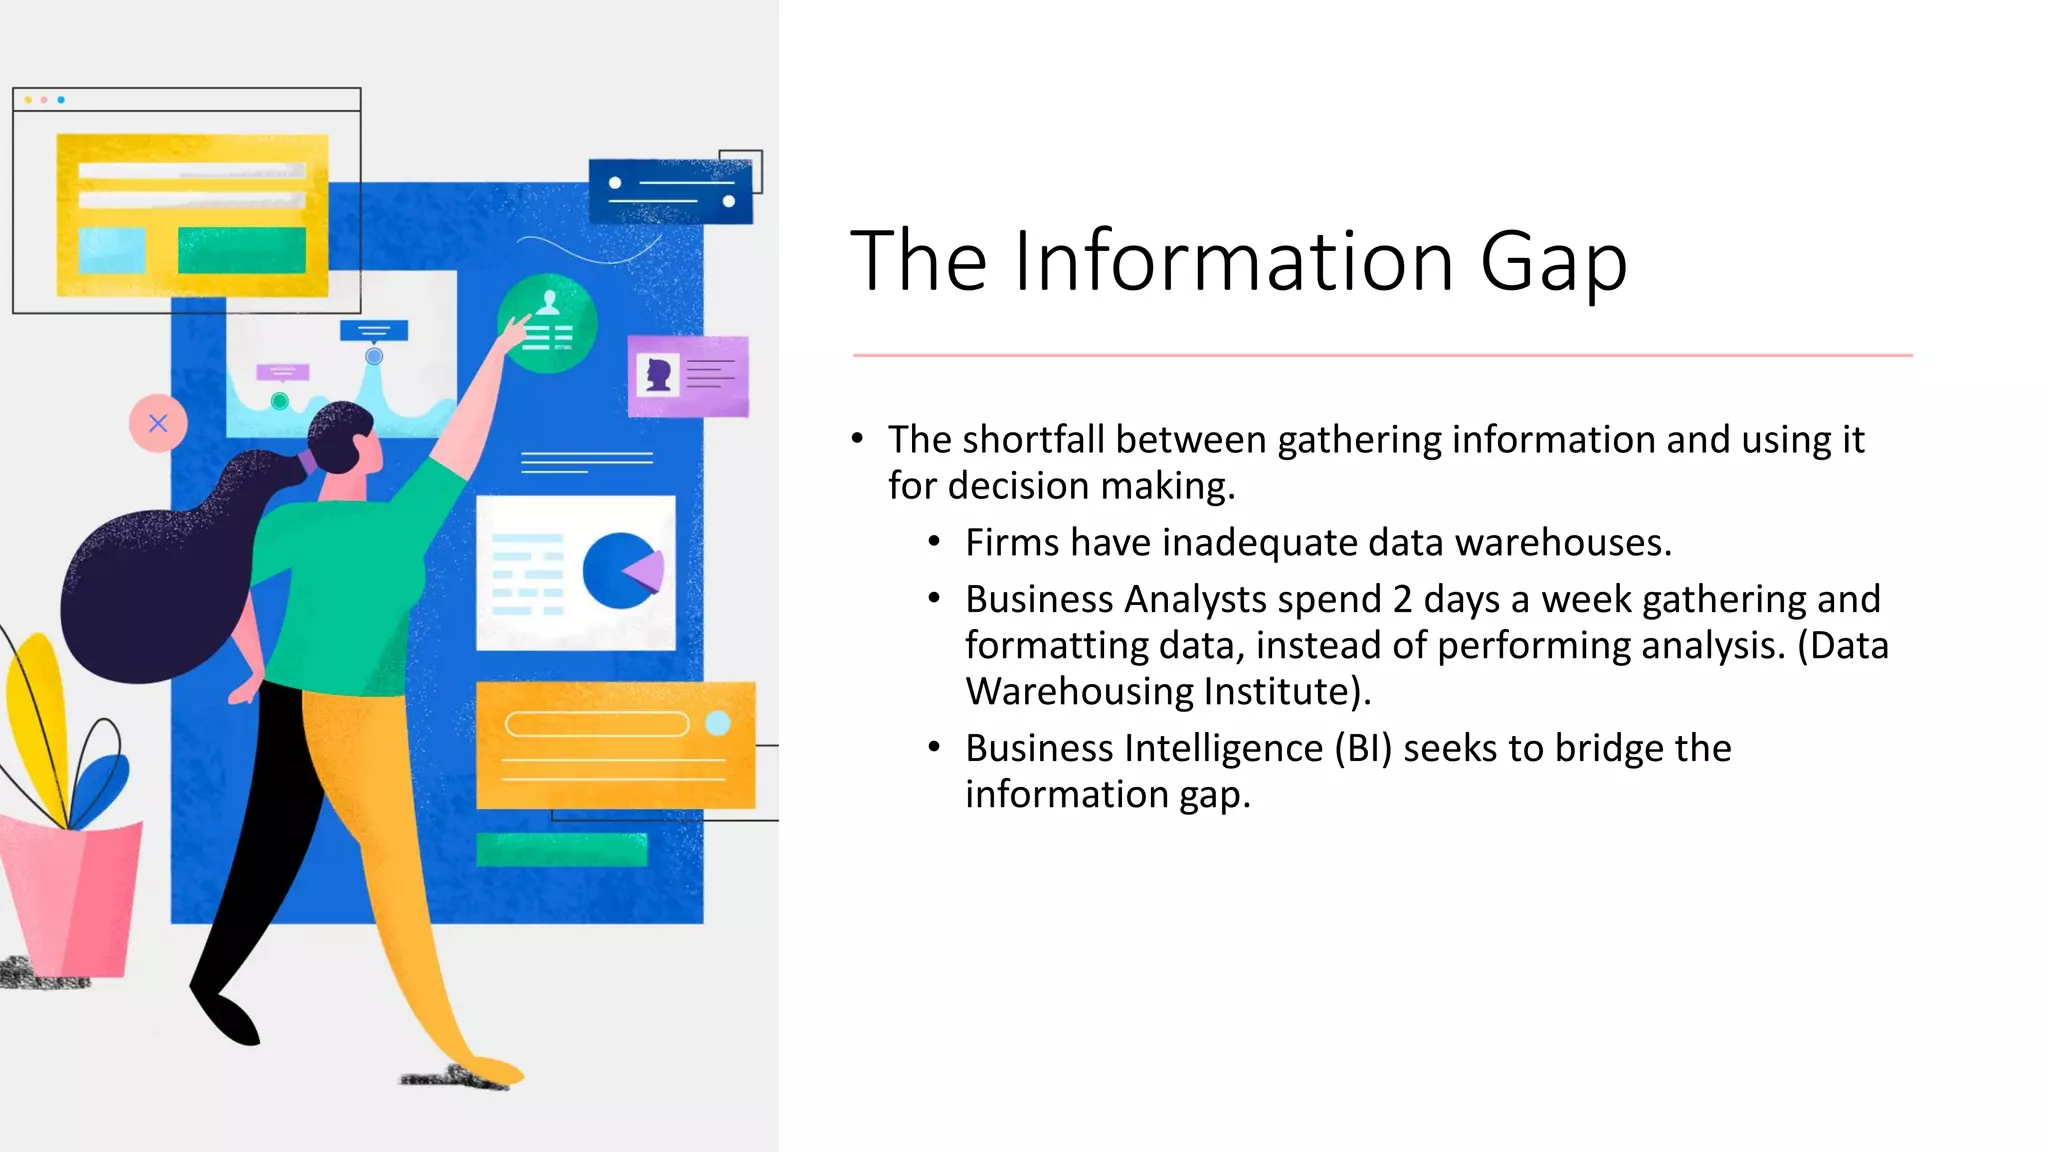
Importance of data in decision making in uncertain environments. Discusses the information gap and time spent by analysts on data.
Importance of data in decision making in uncertain environments. Discusses the information gap and time spent by analysts on data.
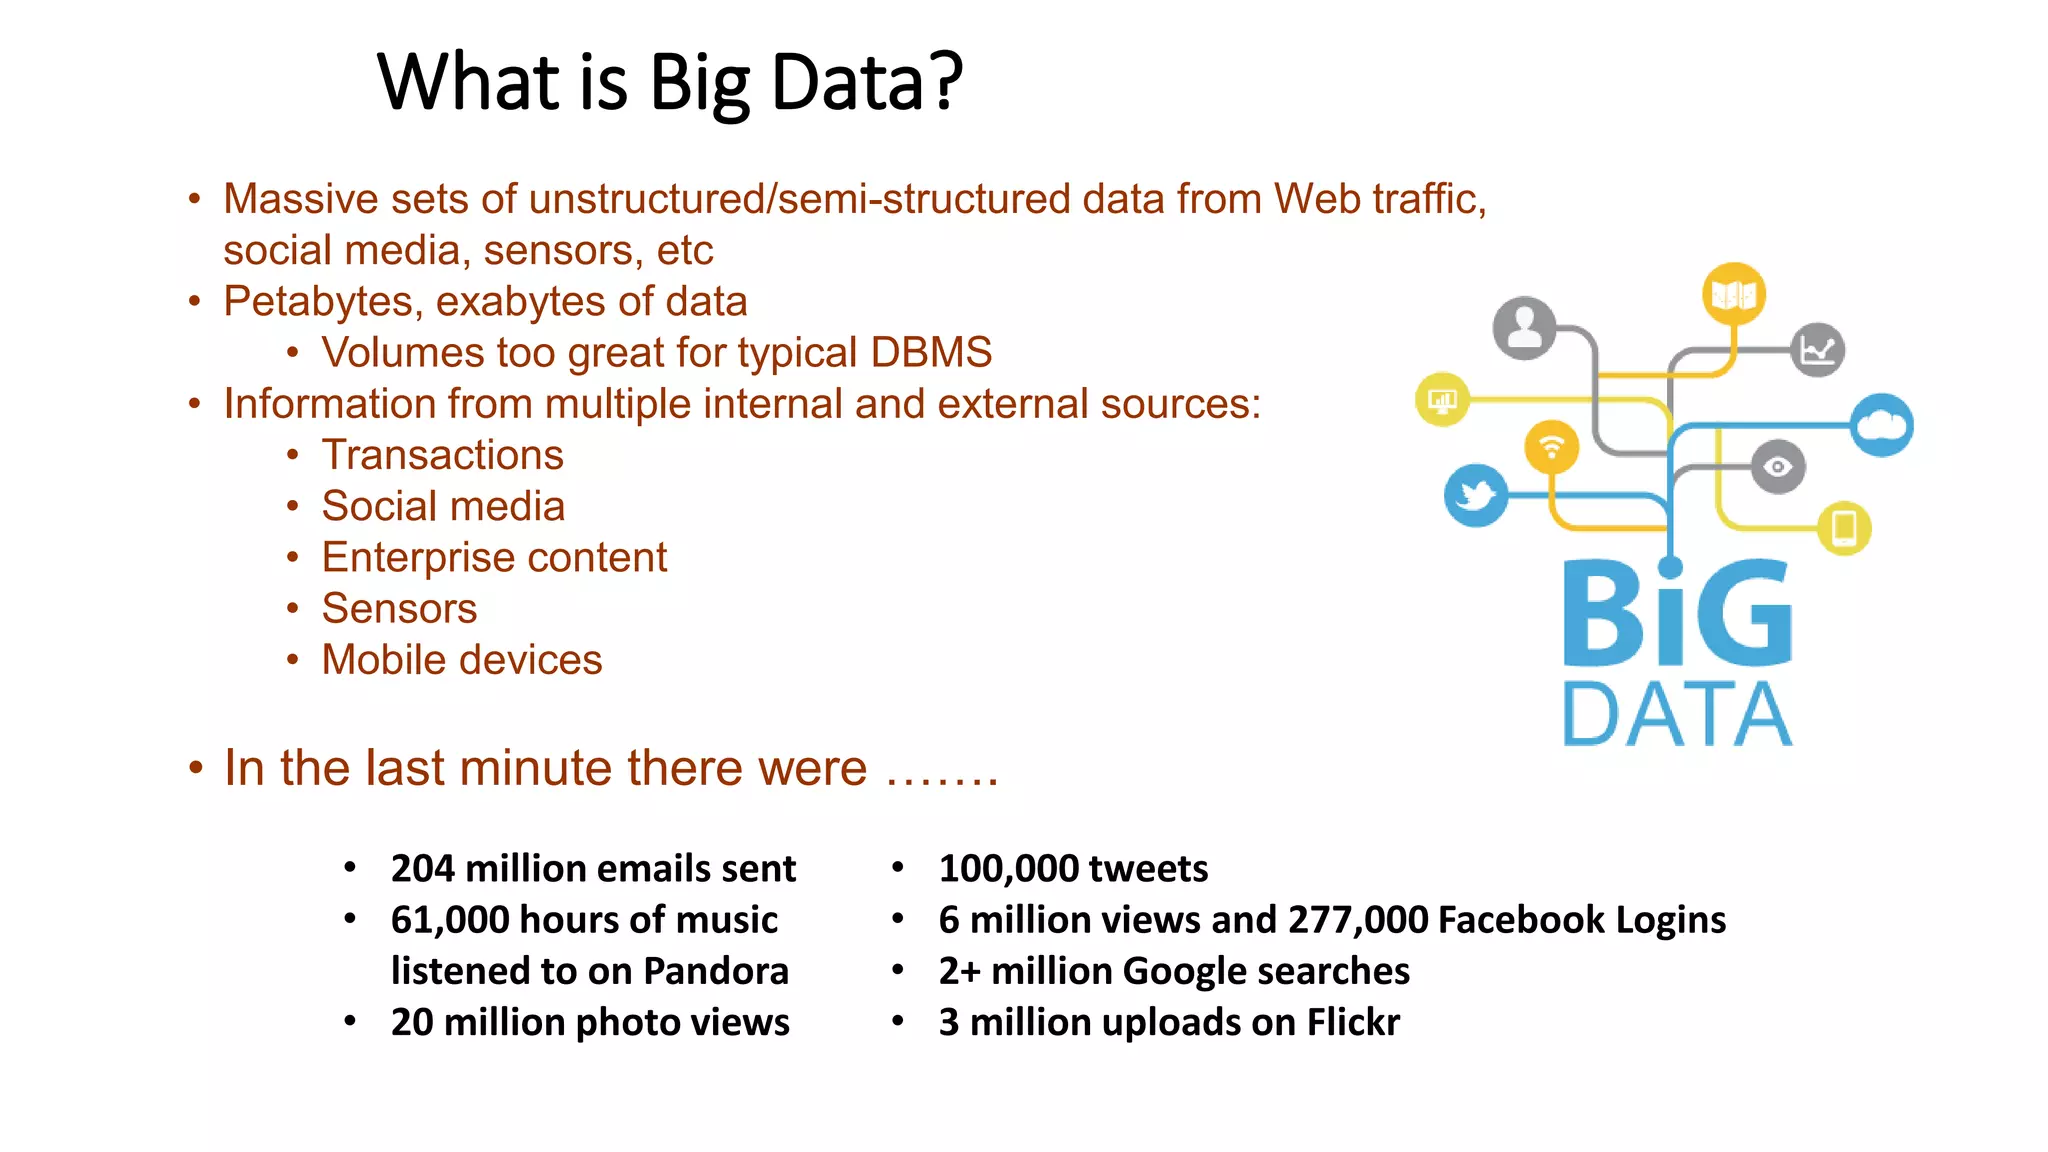
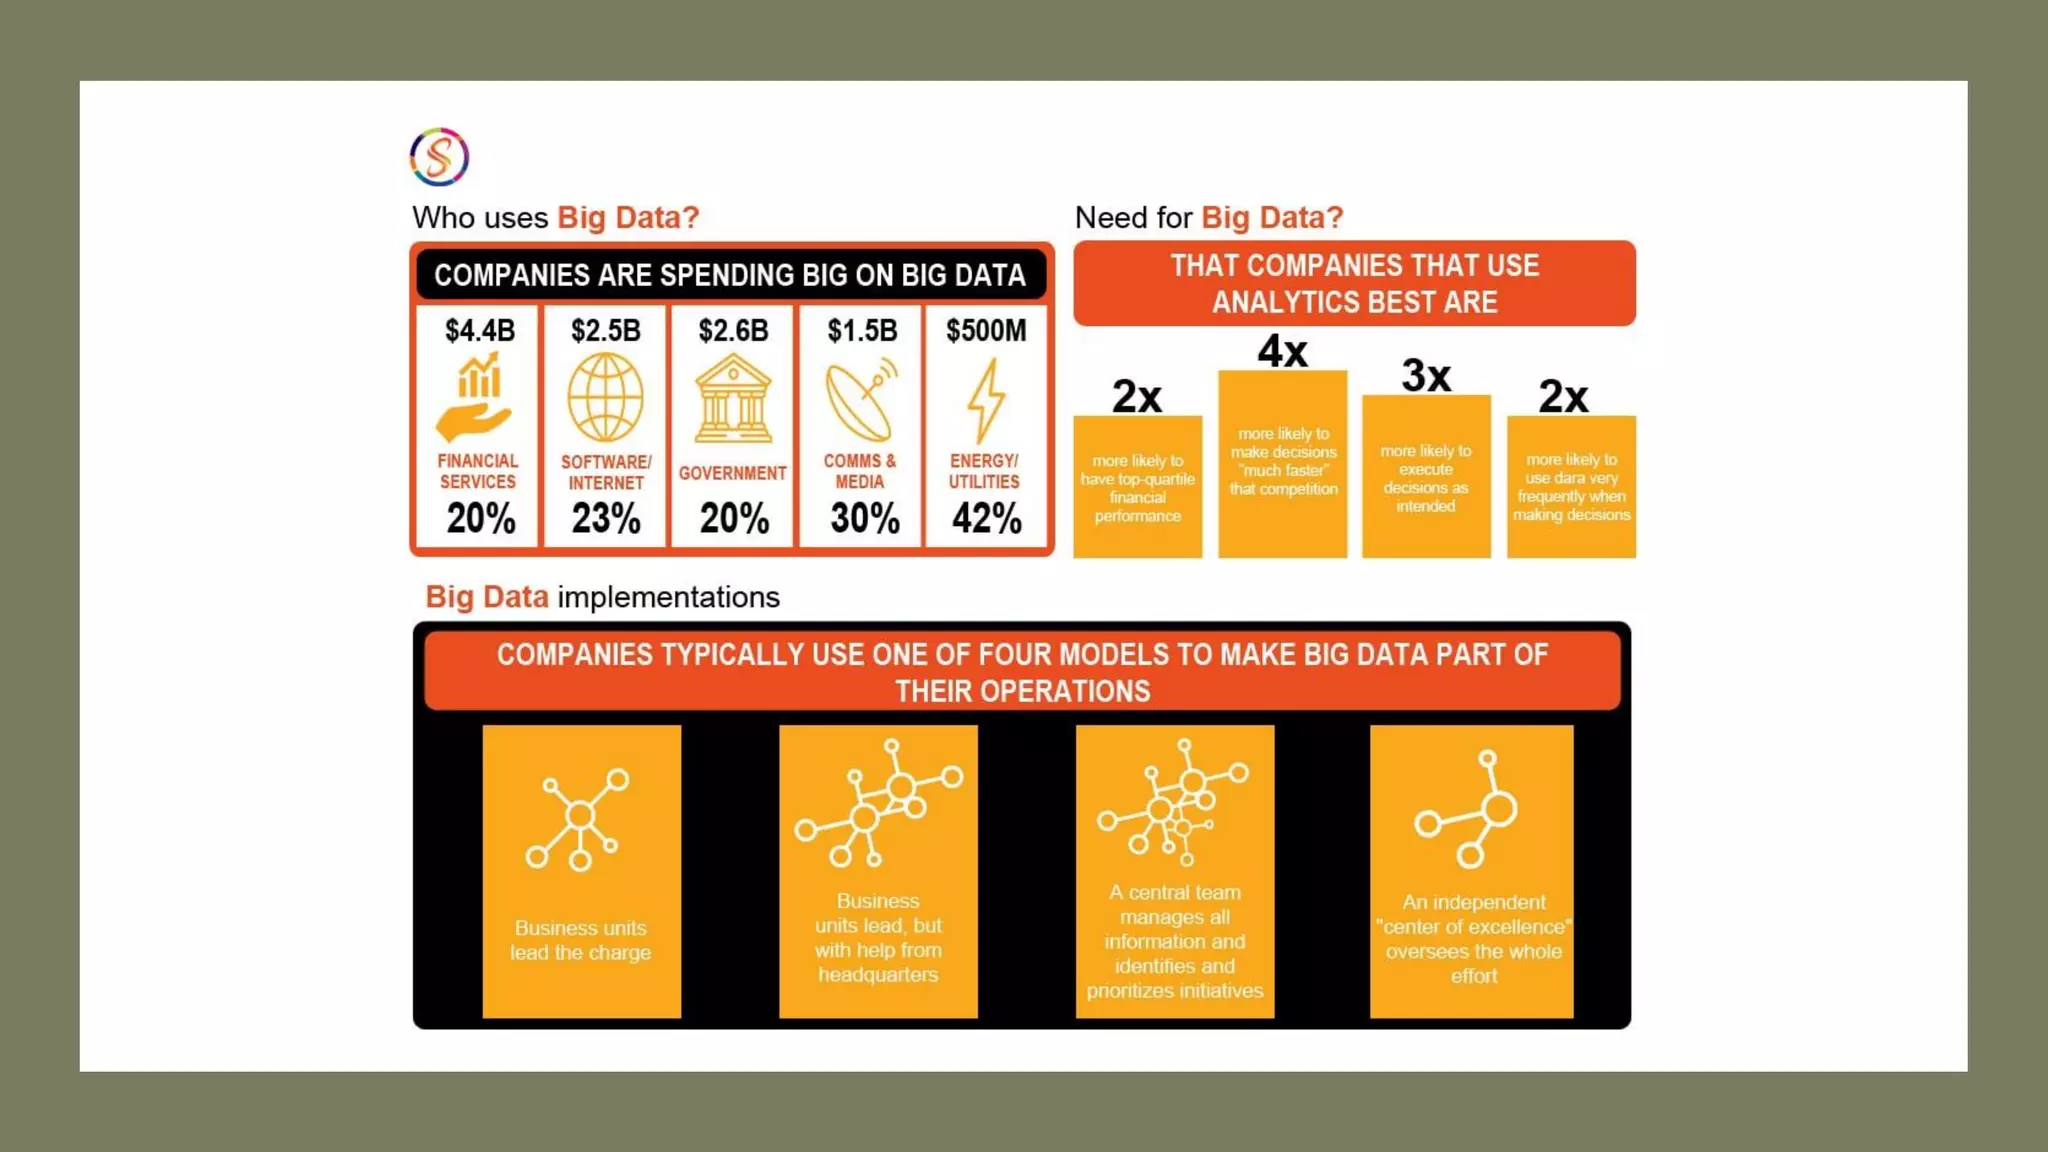
Defining Big Data with examples of volume and sources. Provides numerical data on daily activities related to Big Data.
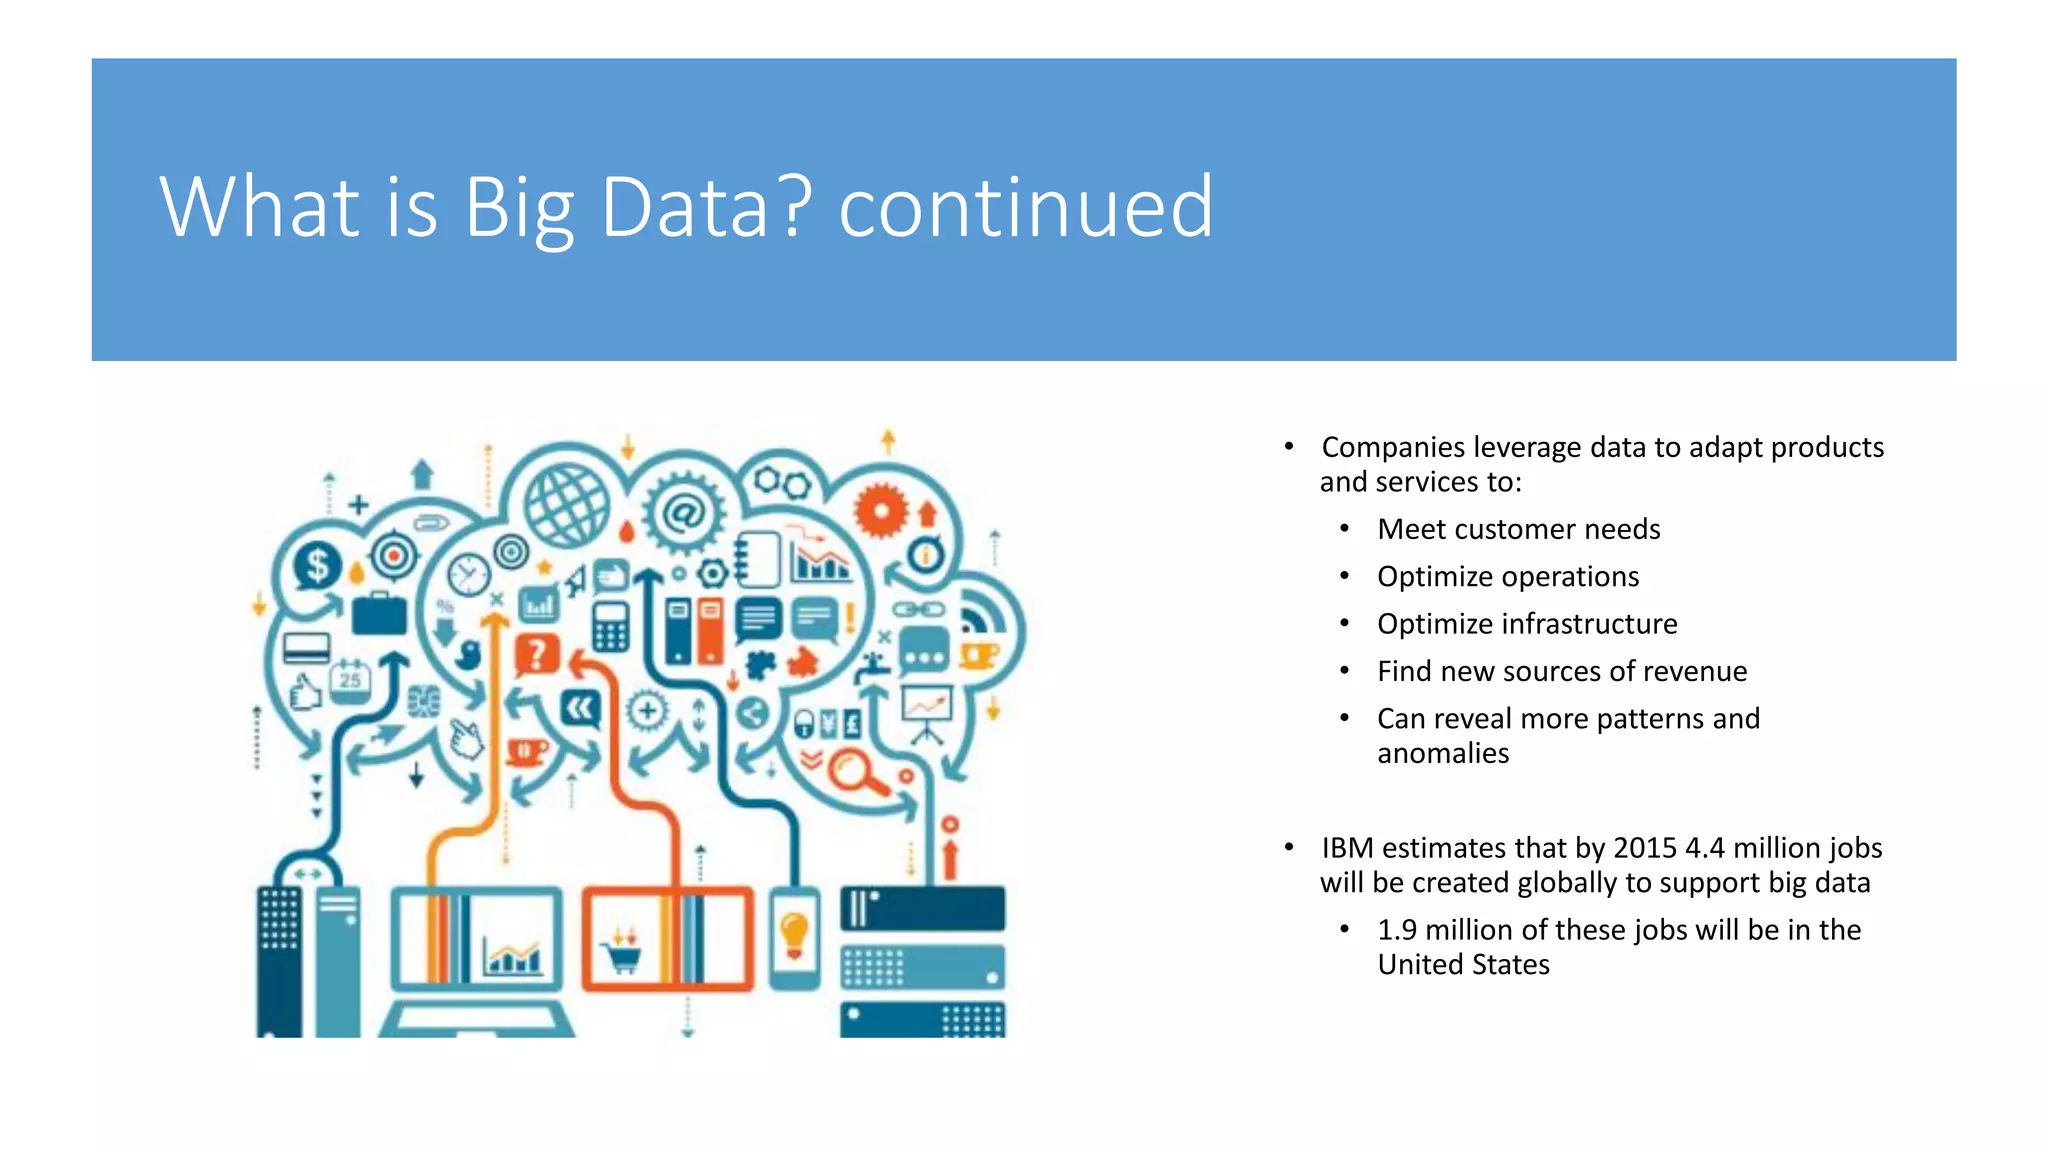
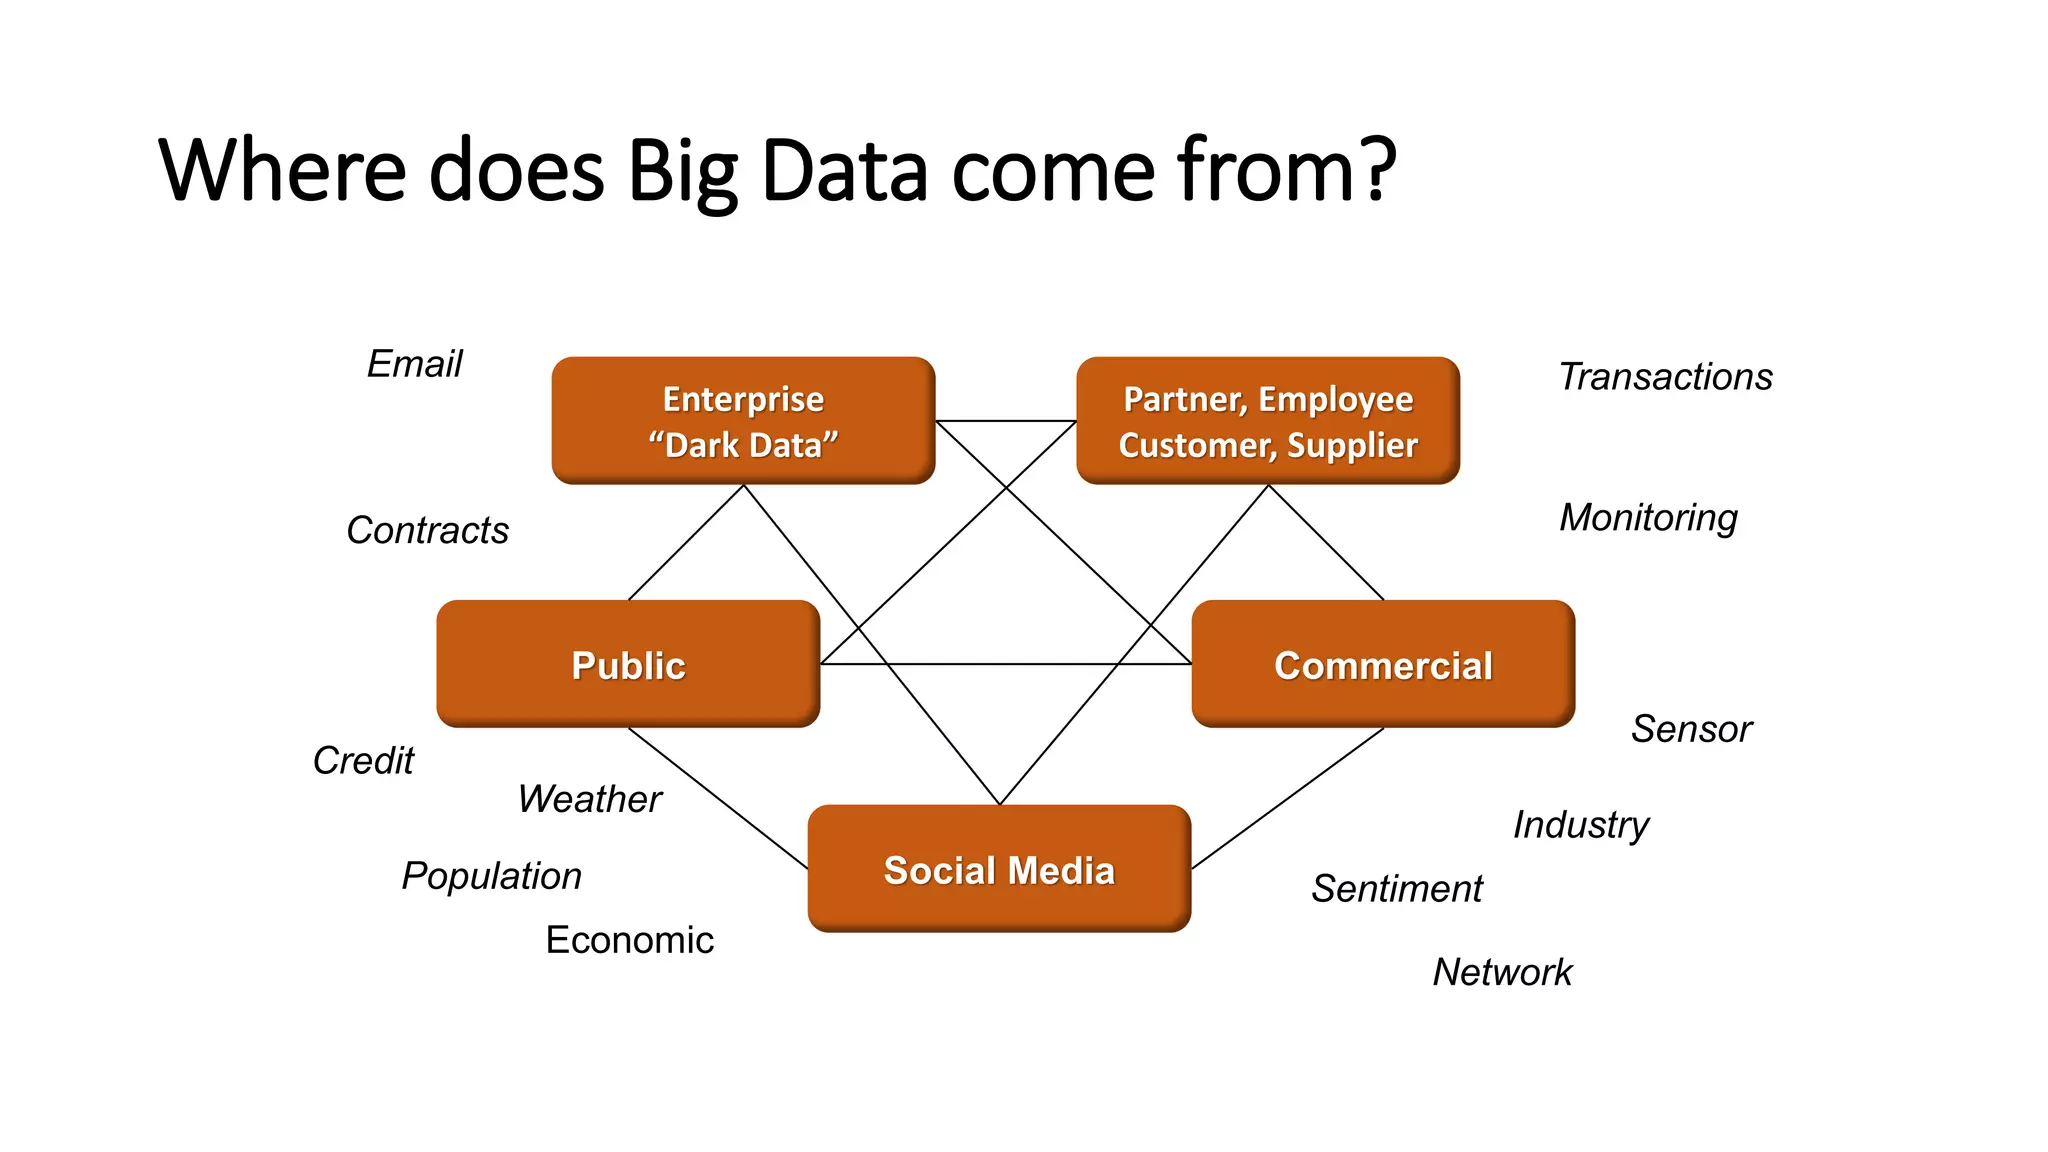
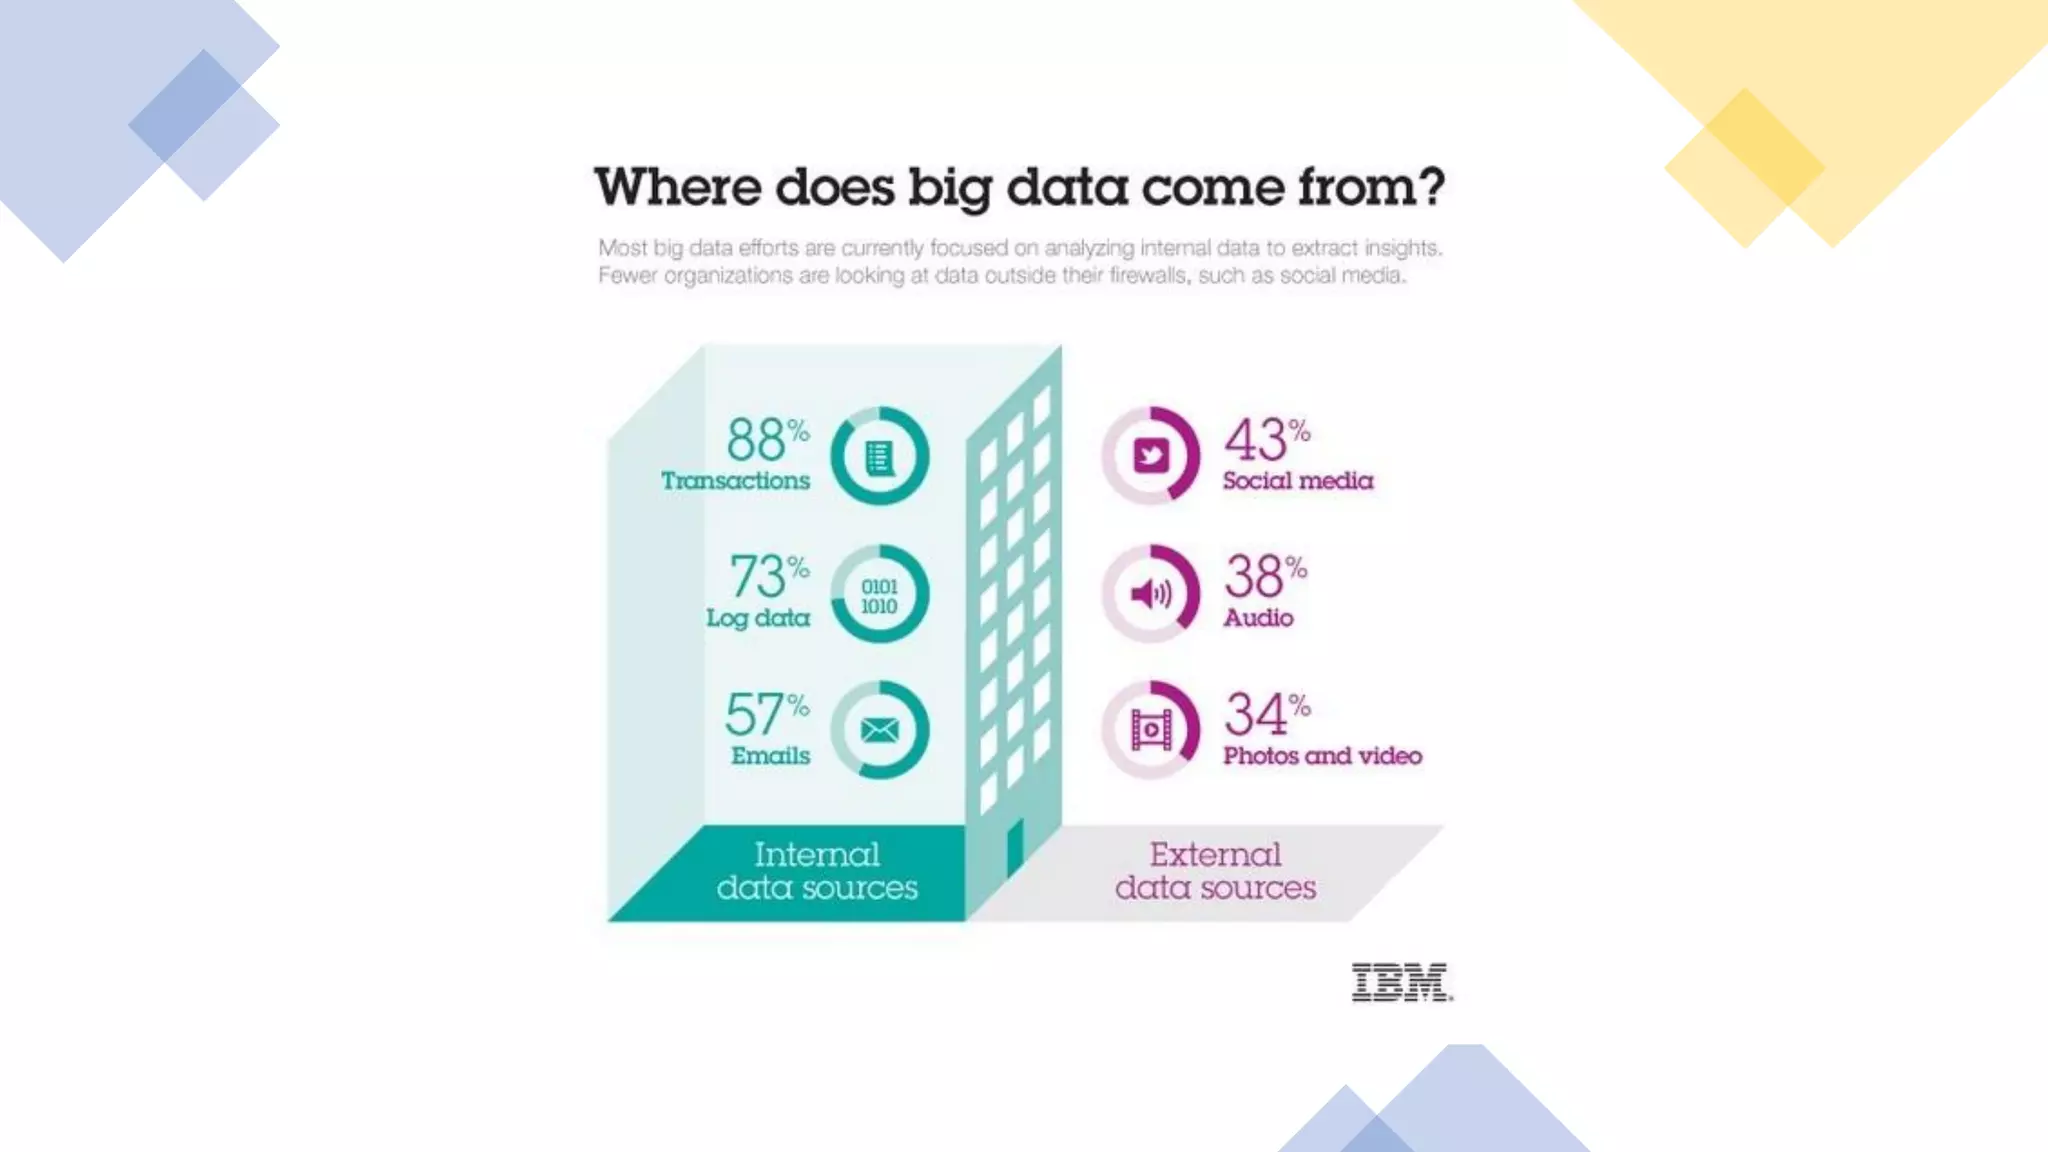
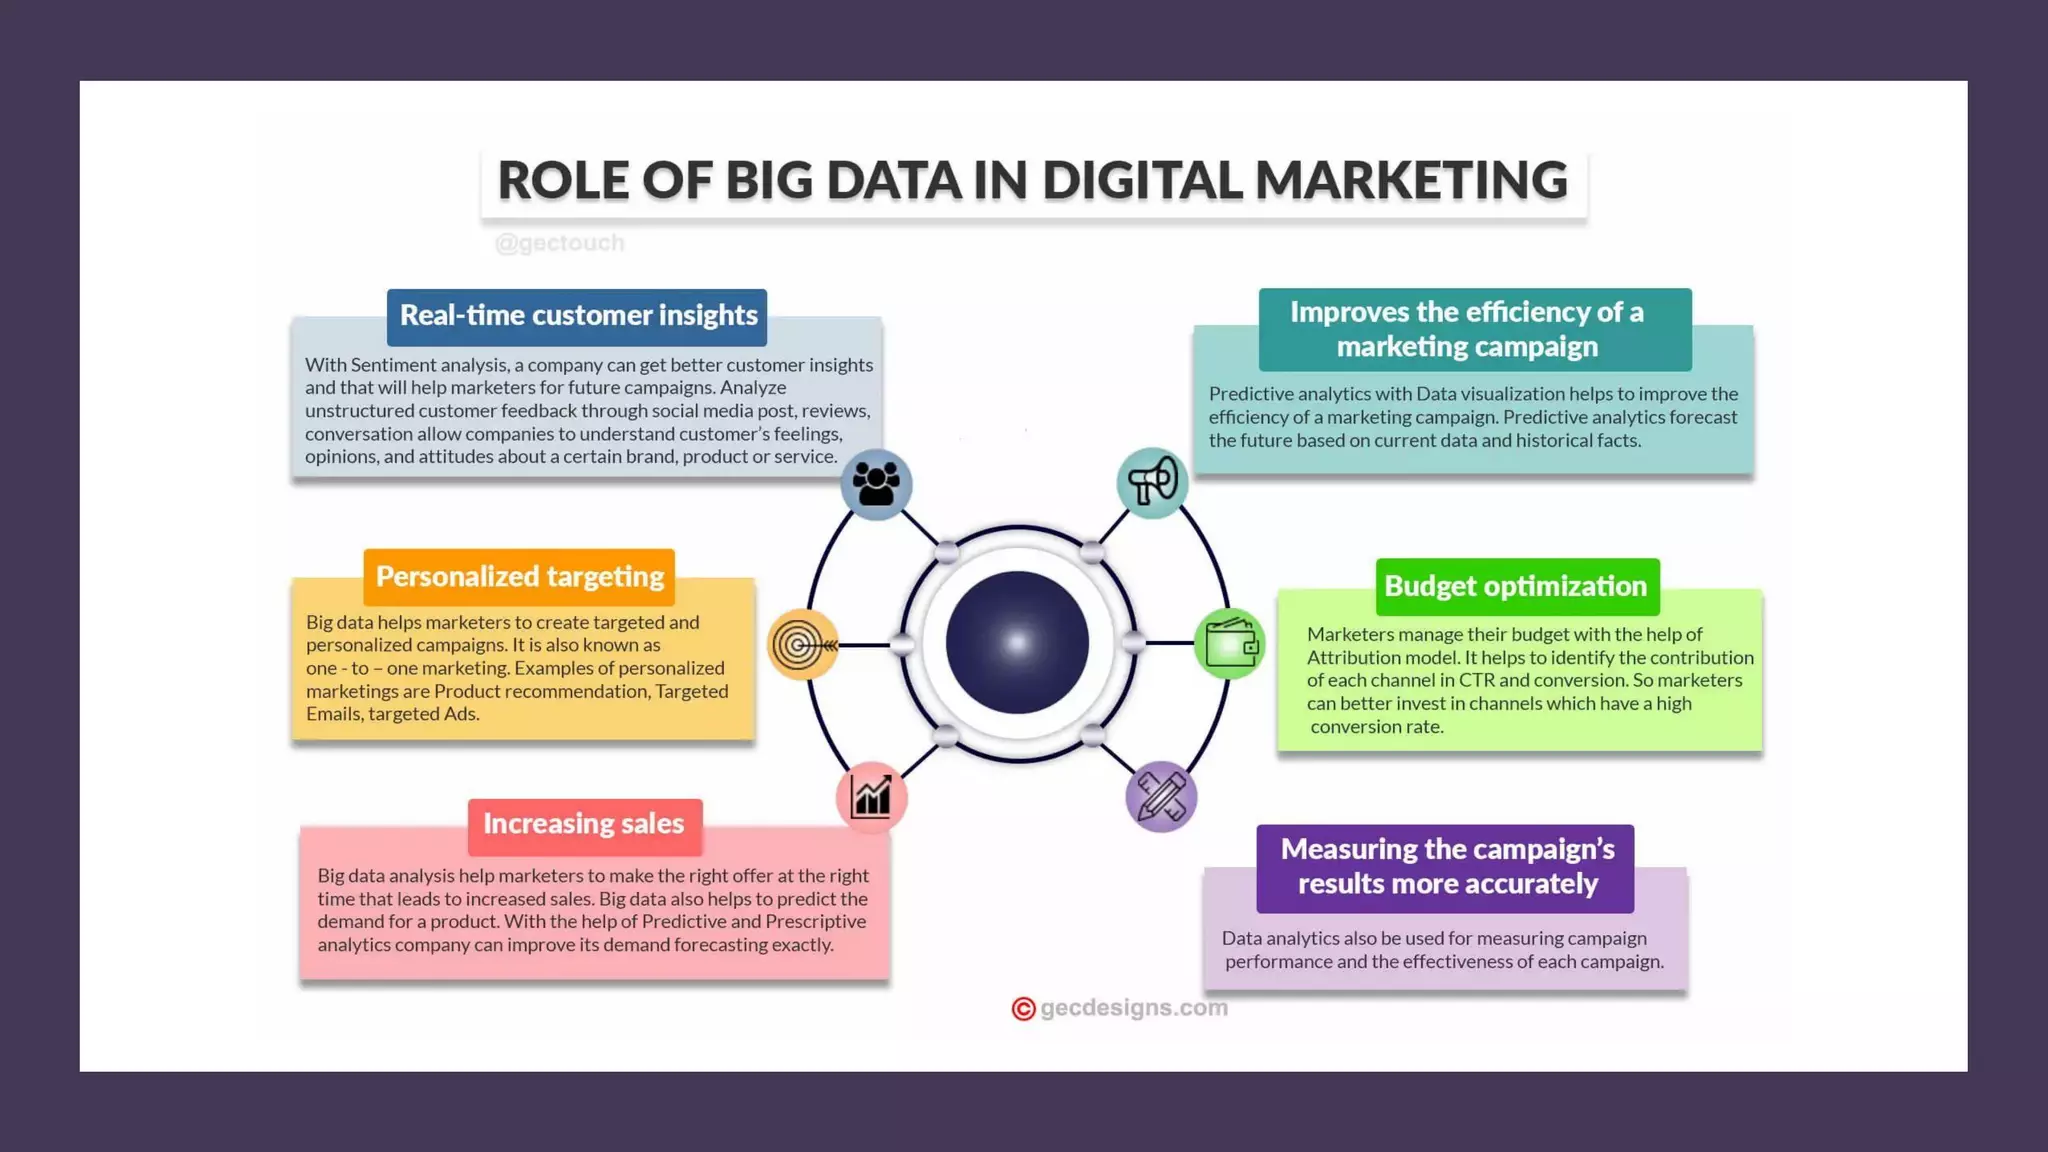
Sources of Big Data including social media and transactions, emphasizing its impact and revenue potential.
Sources of Big Data including social media and transactions, emphasizing its impact and revenue potential.
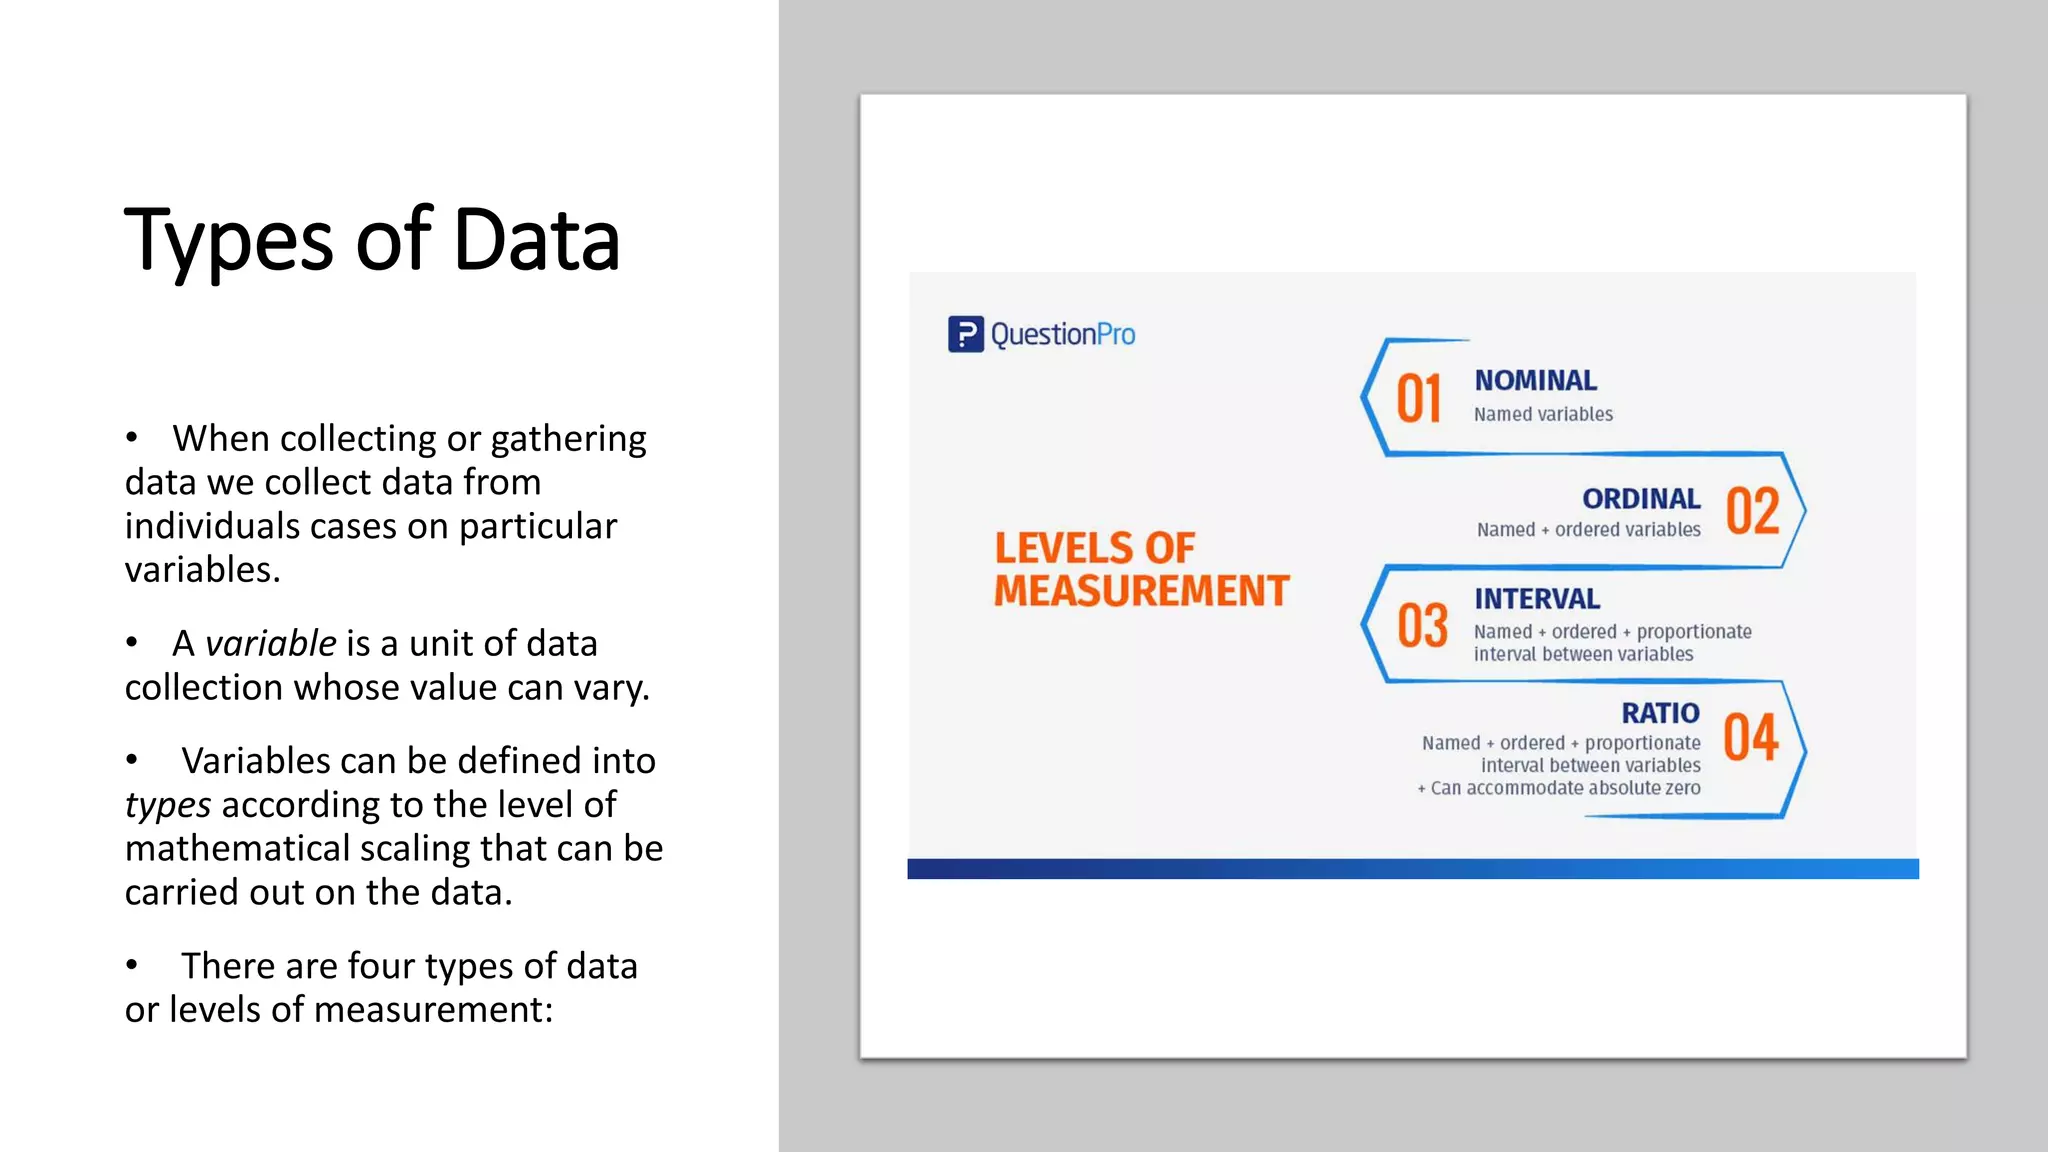
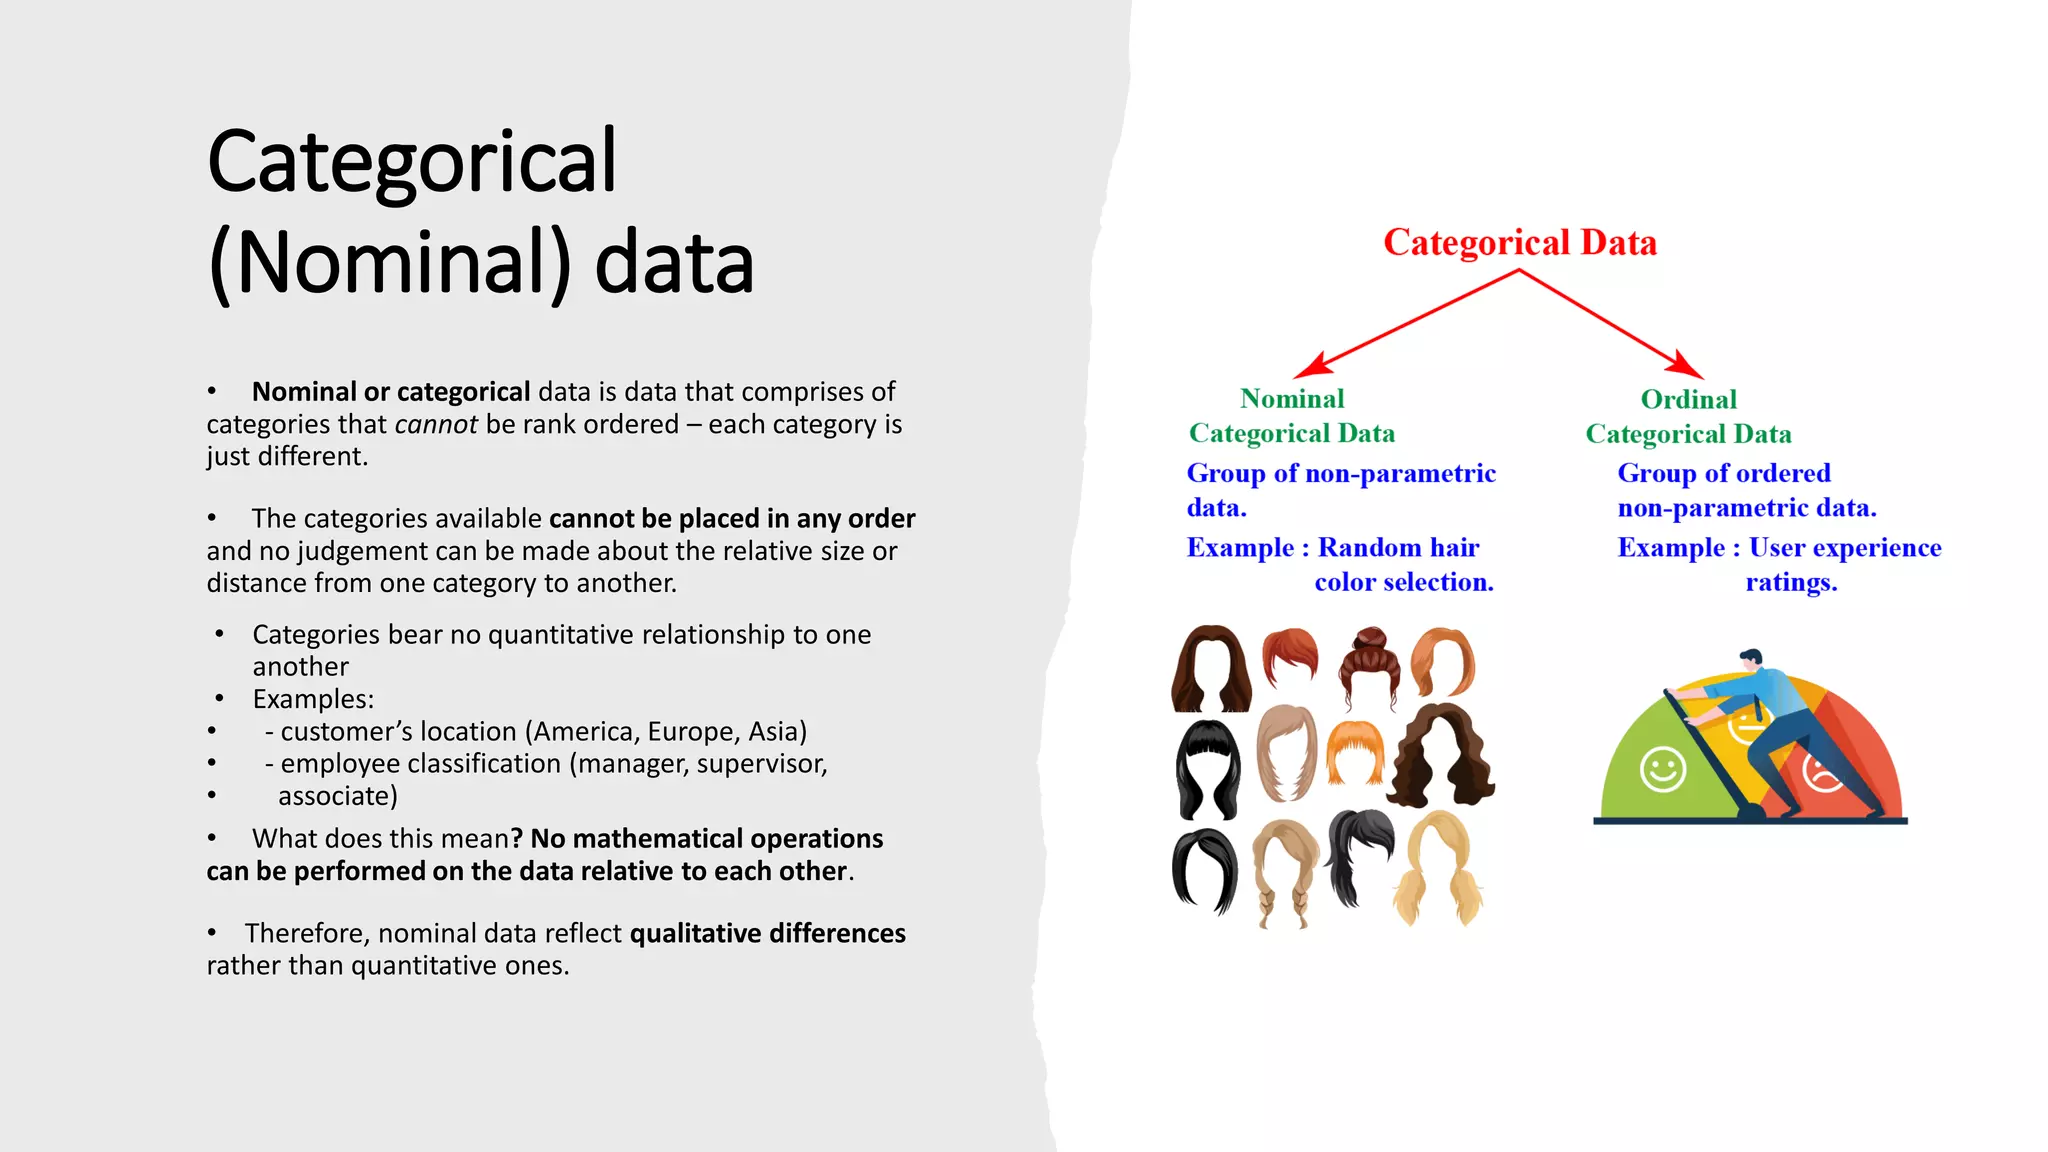
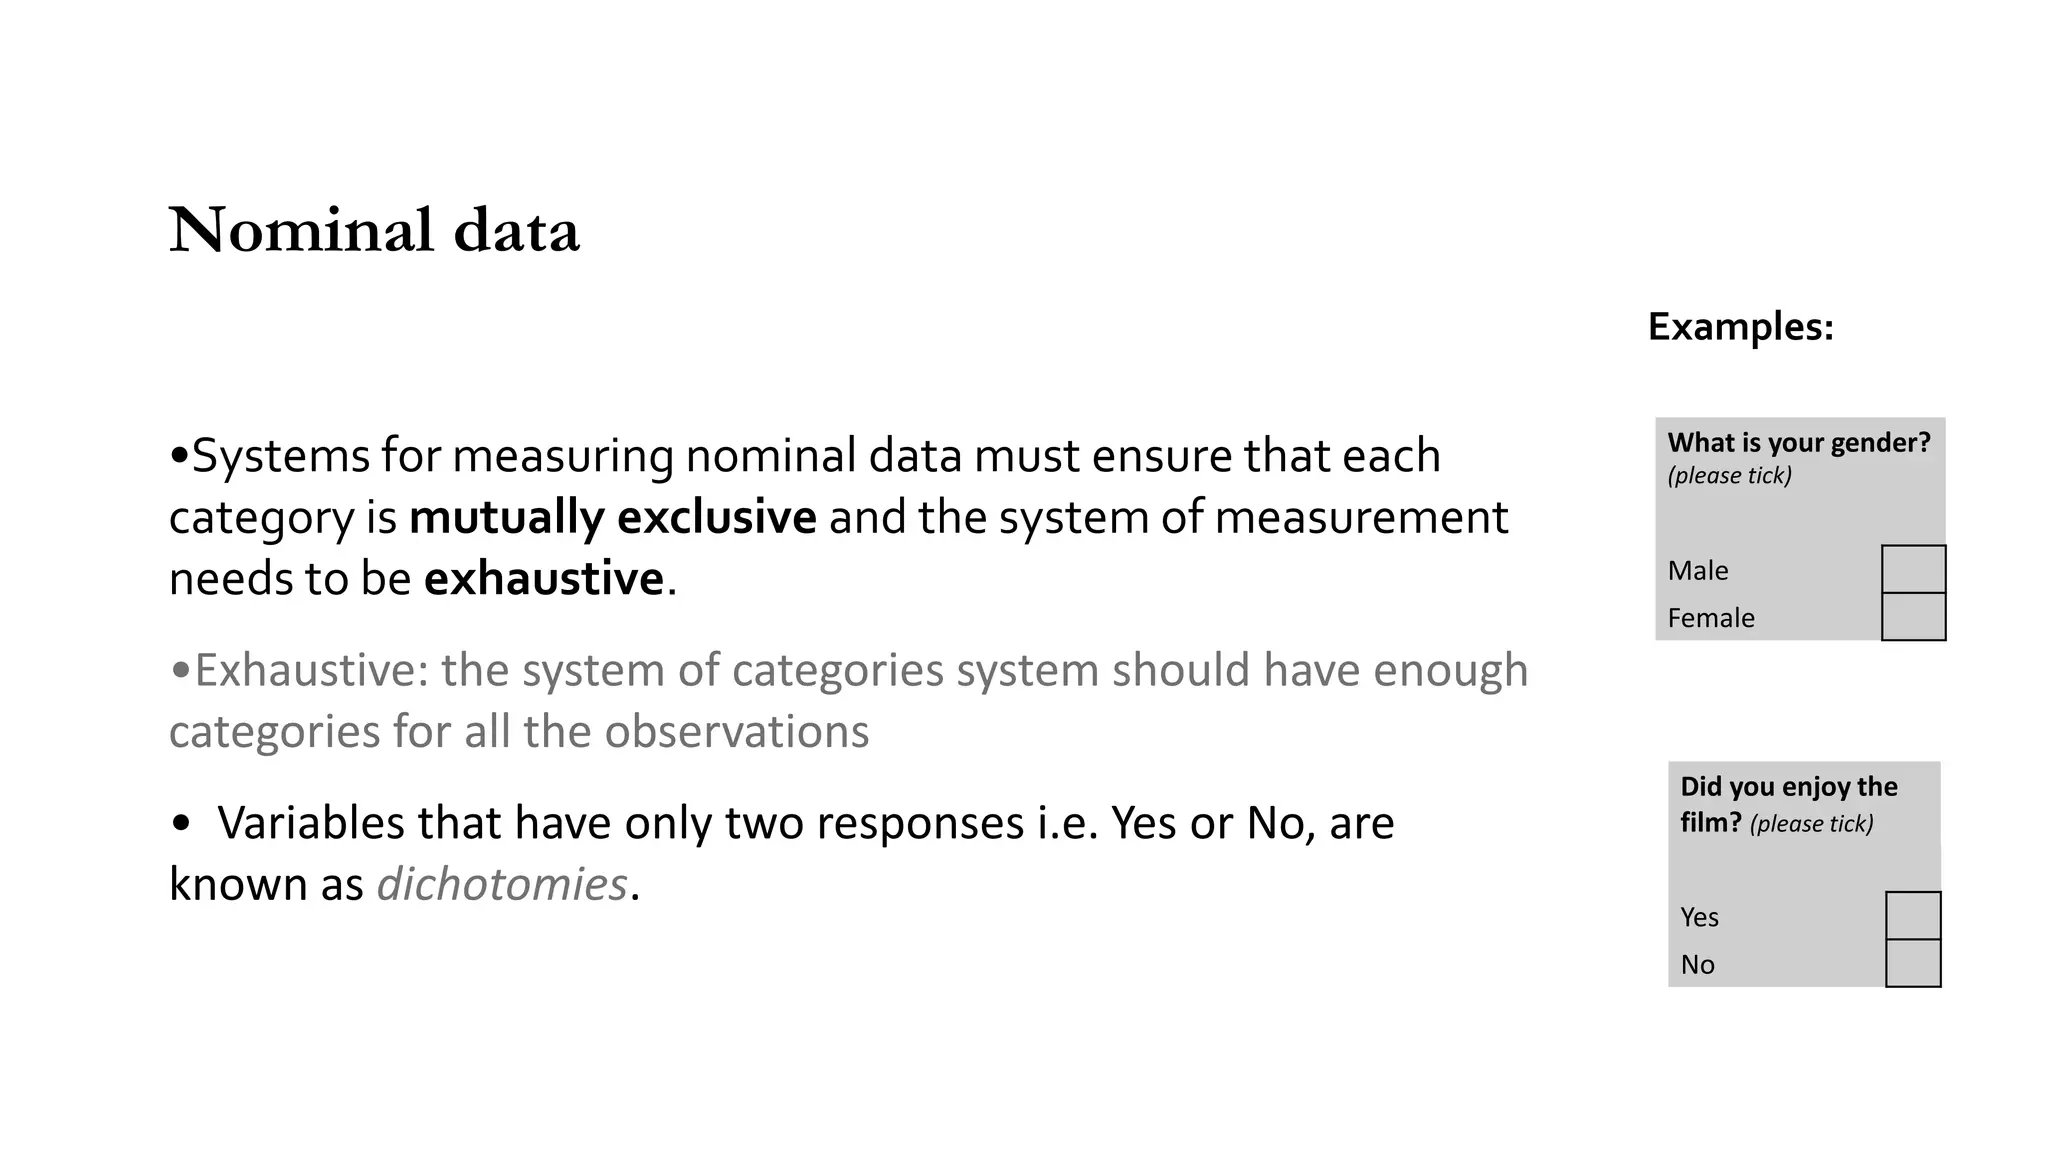
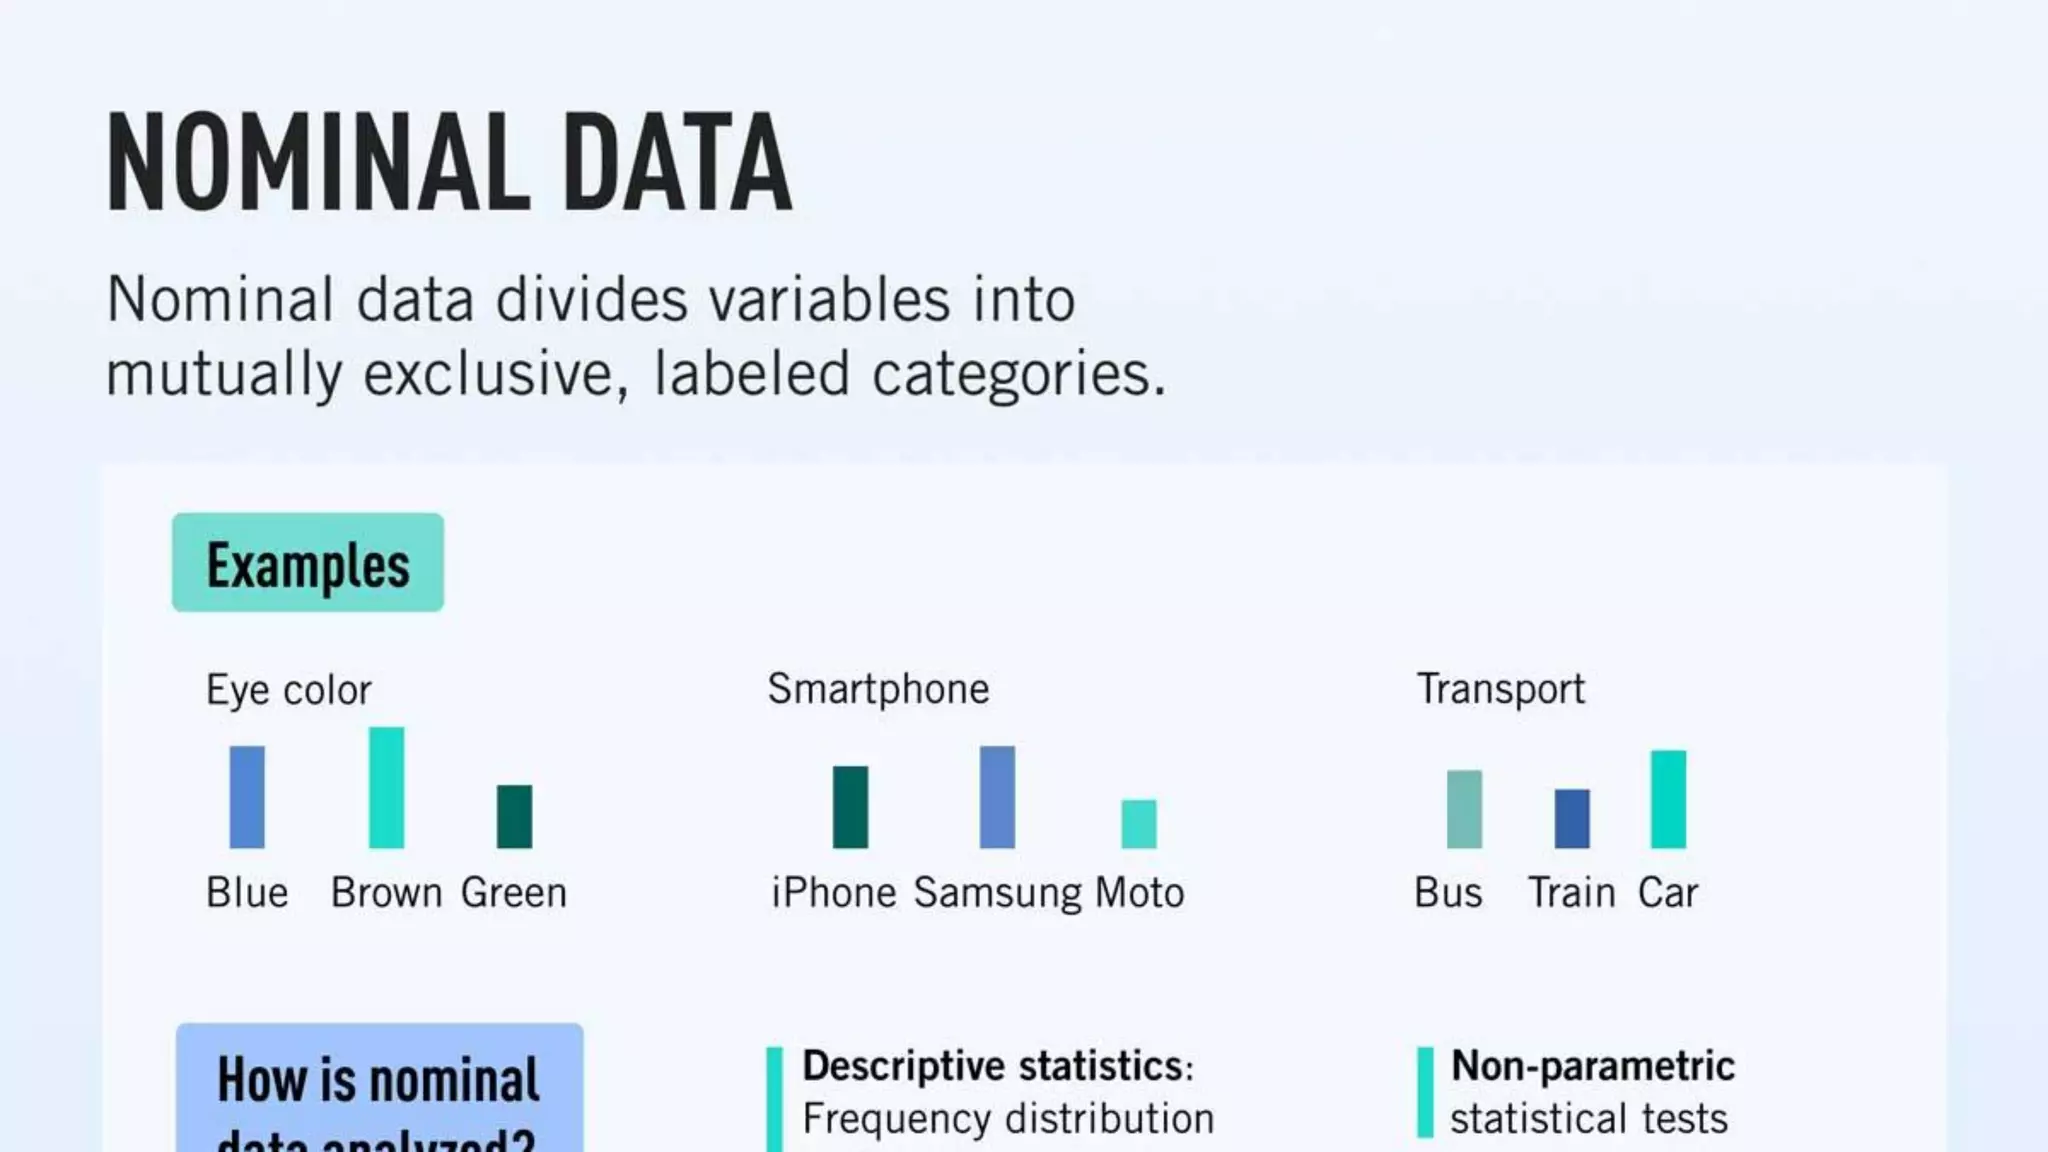
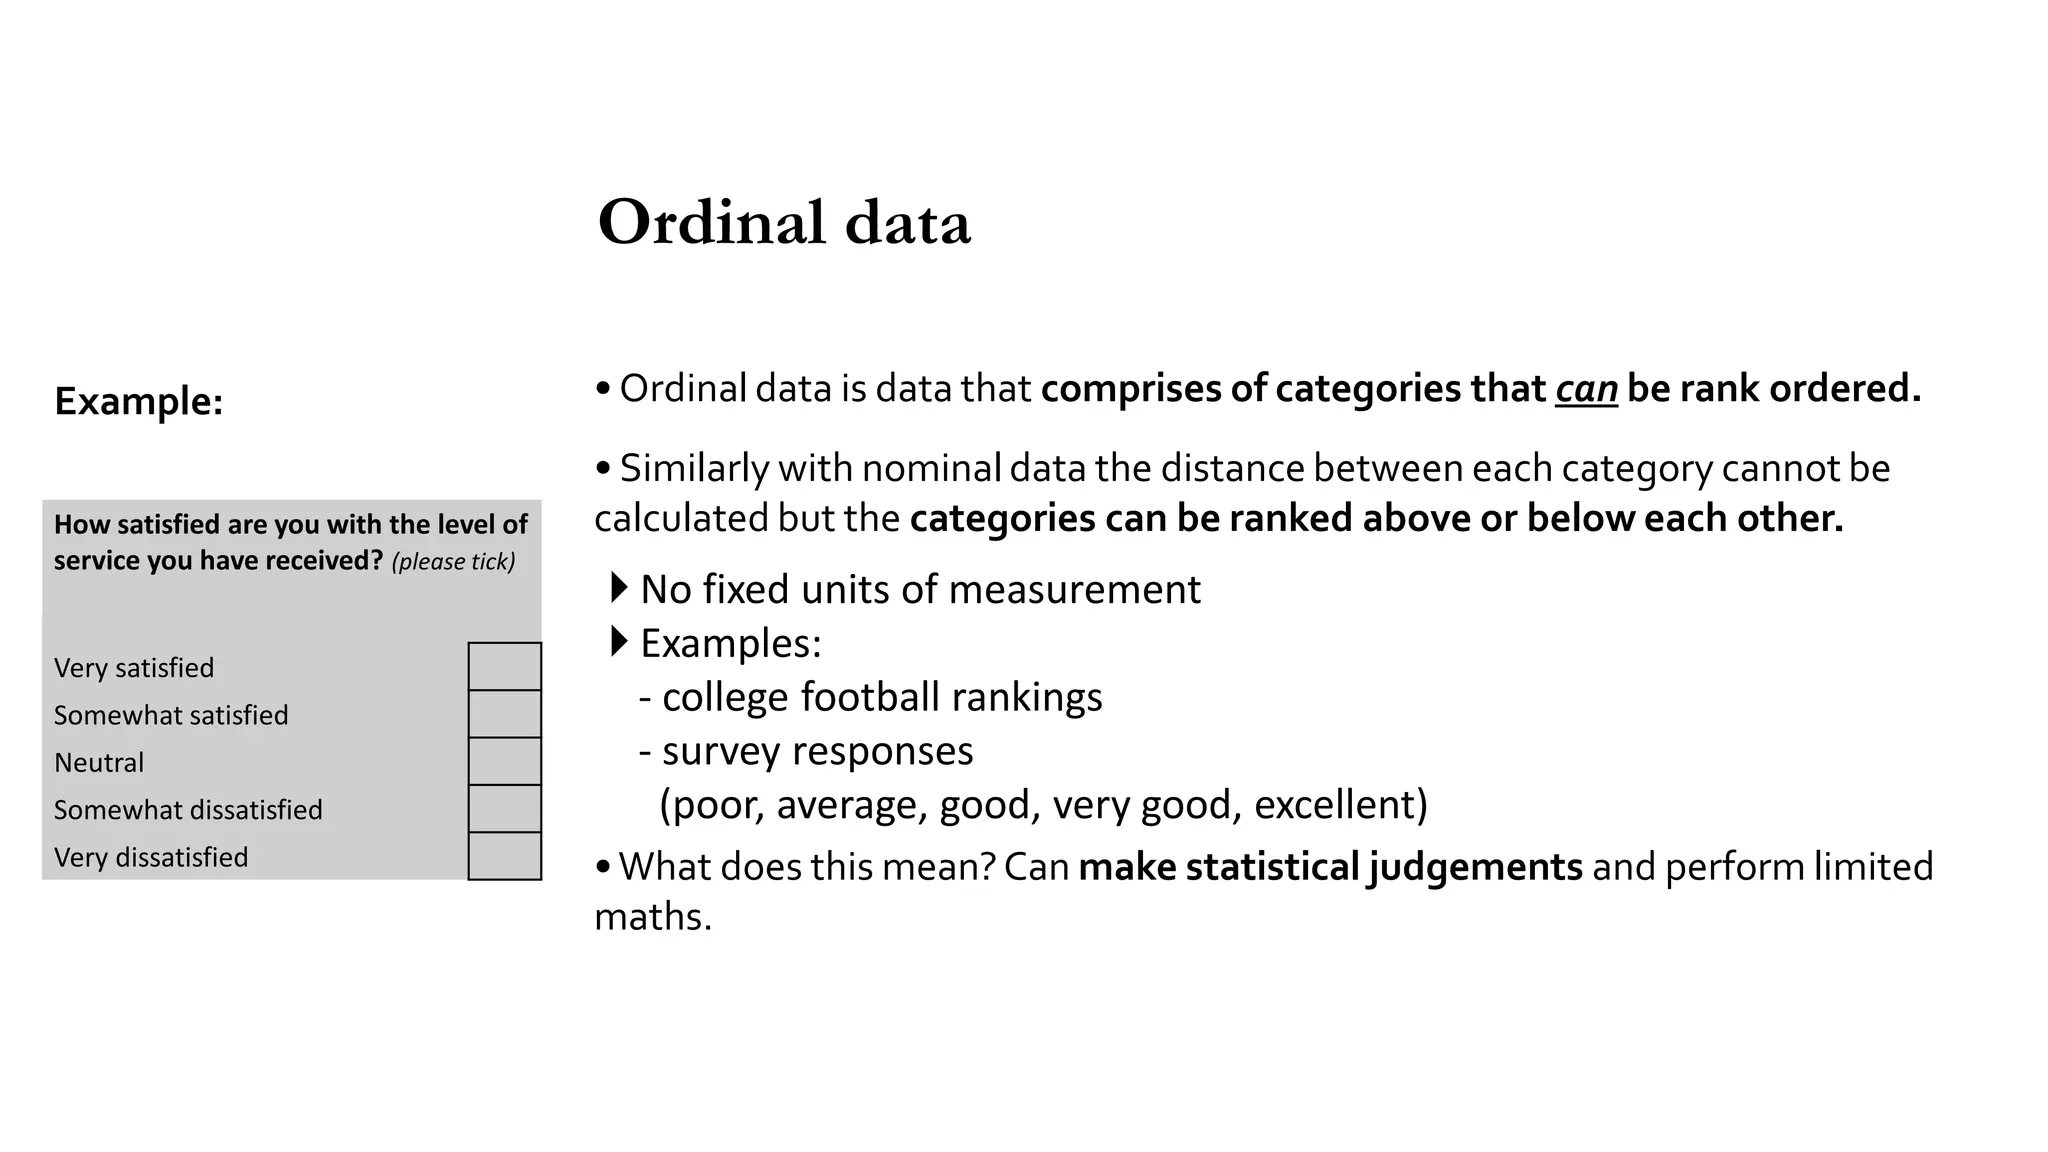
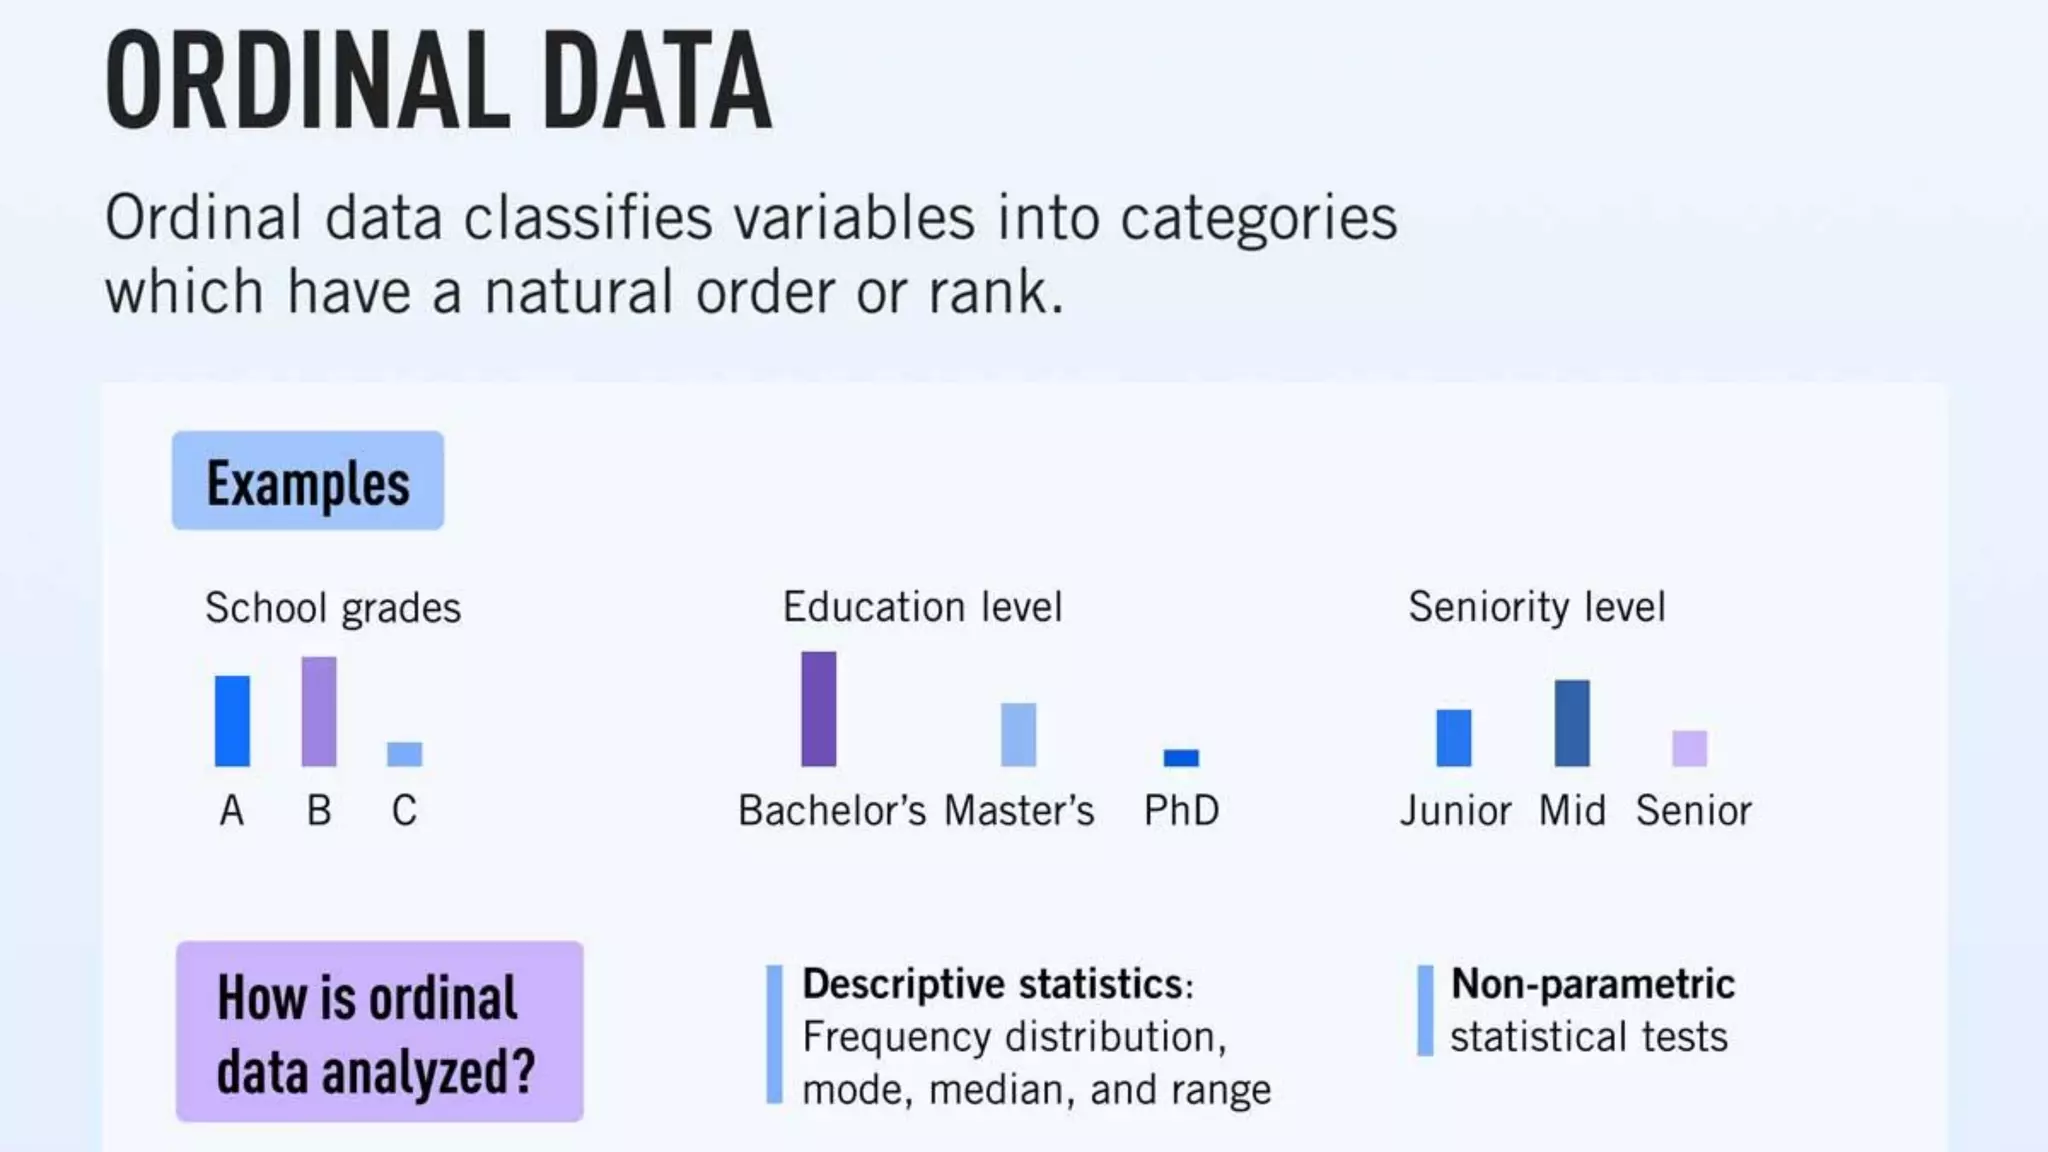
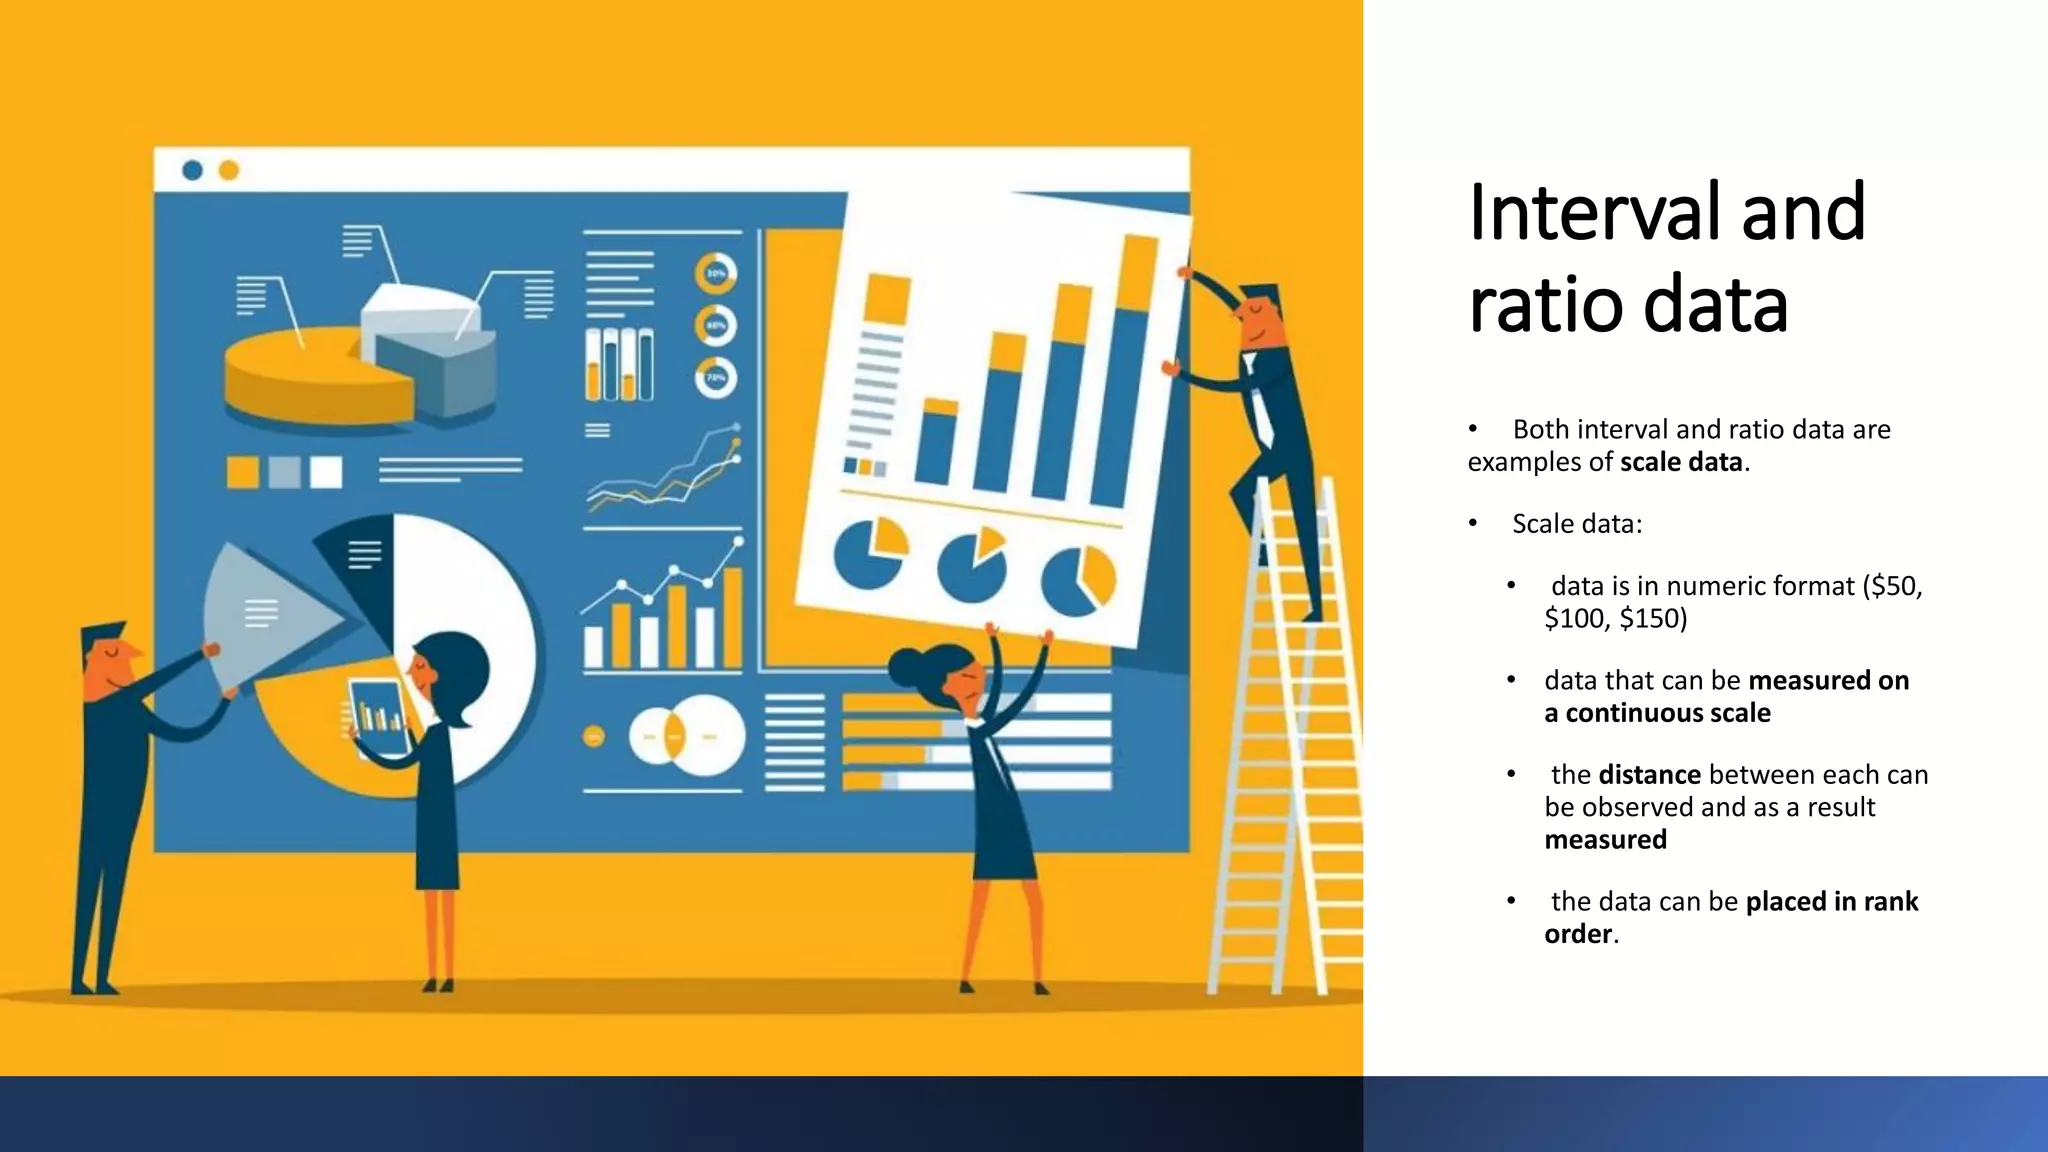
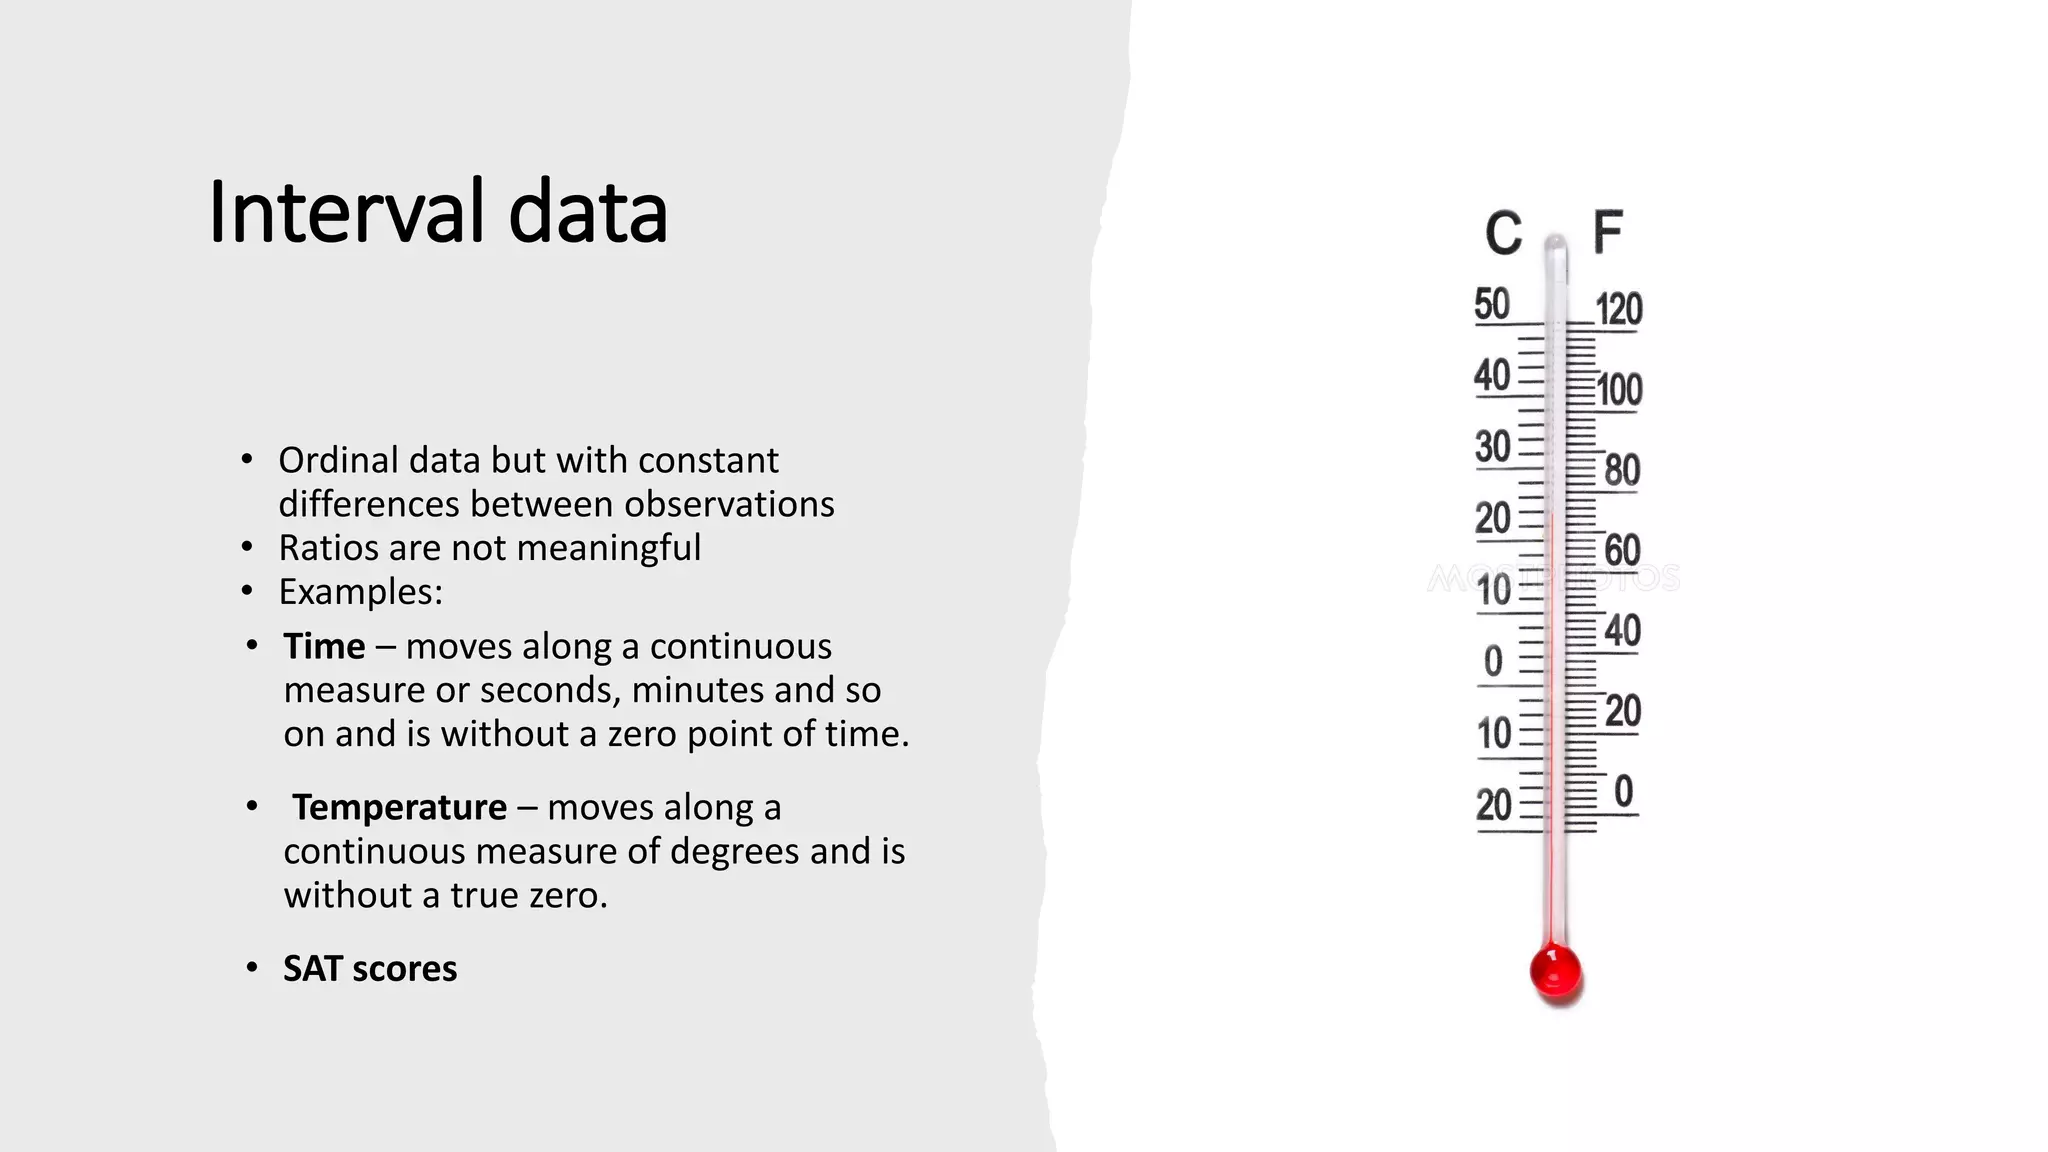
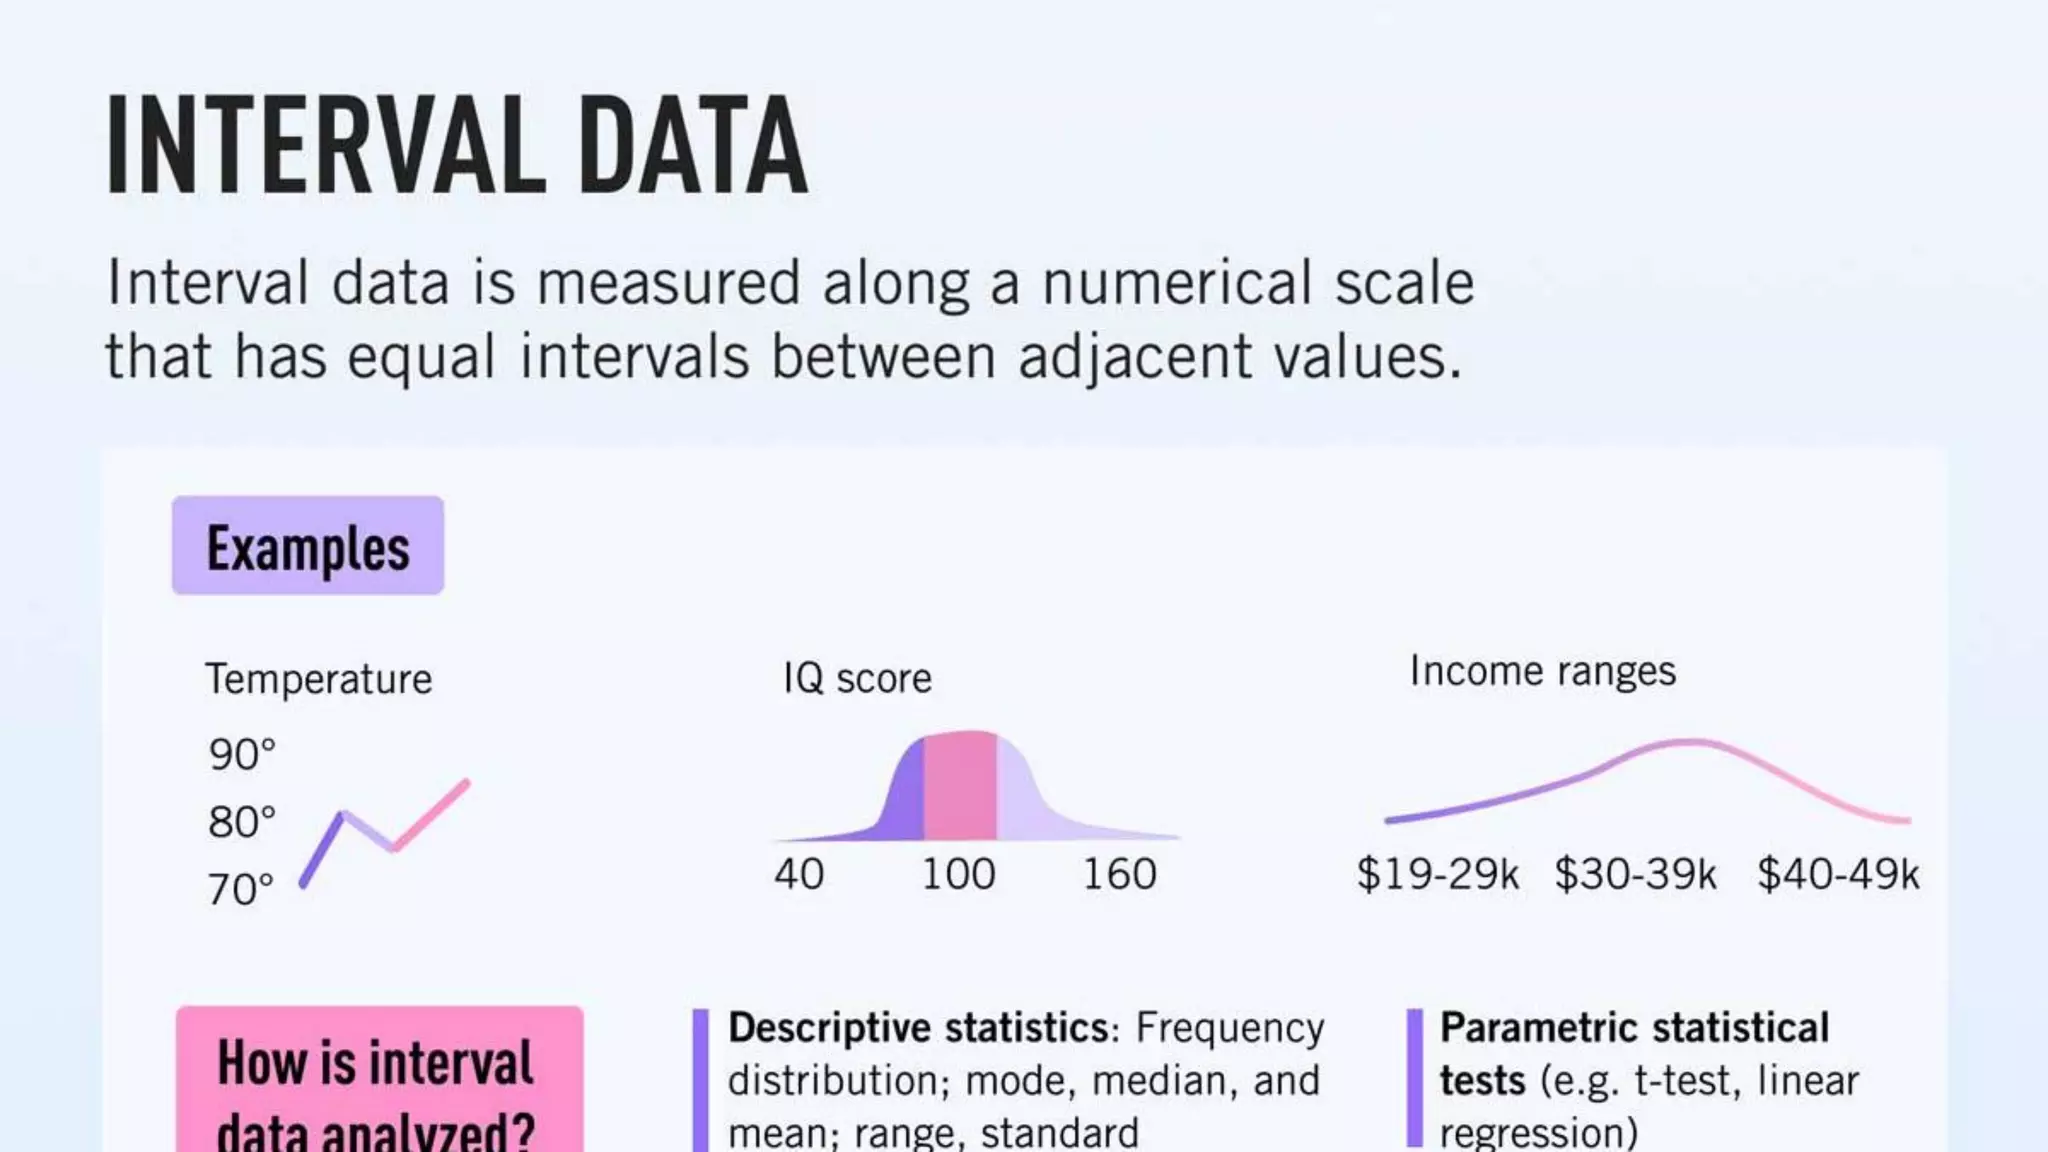
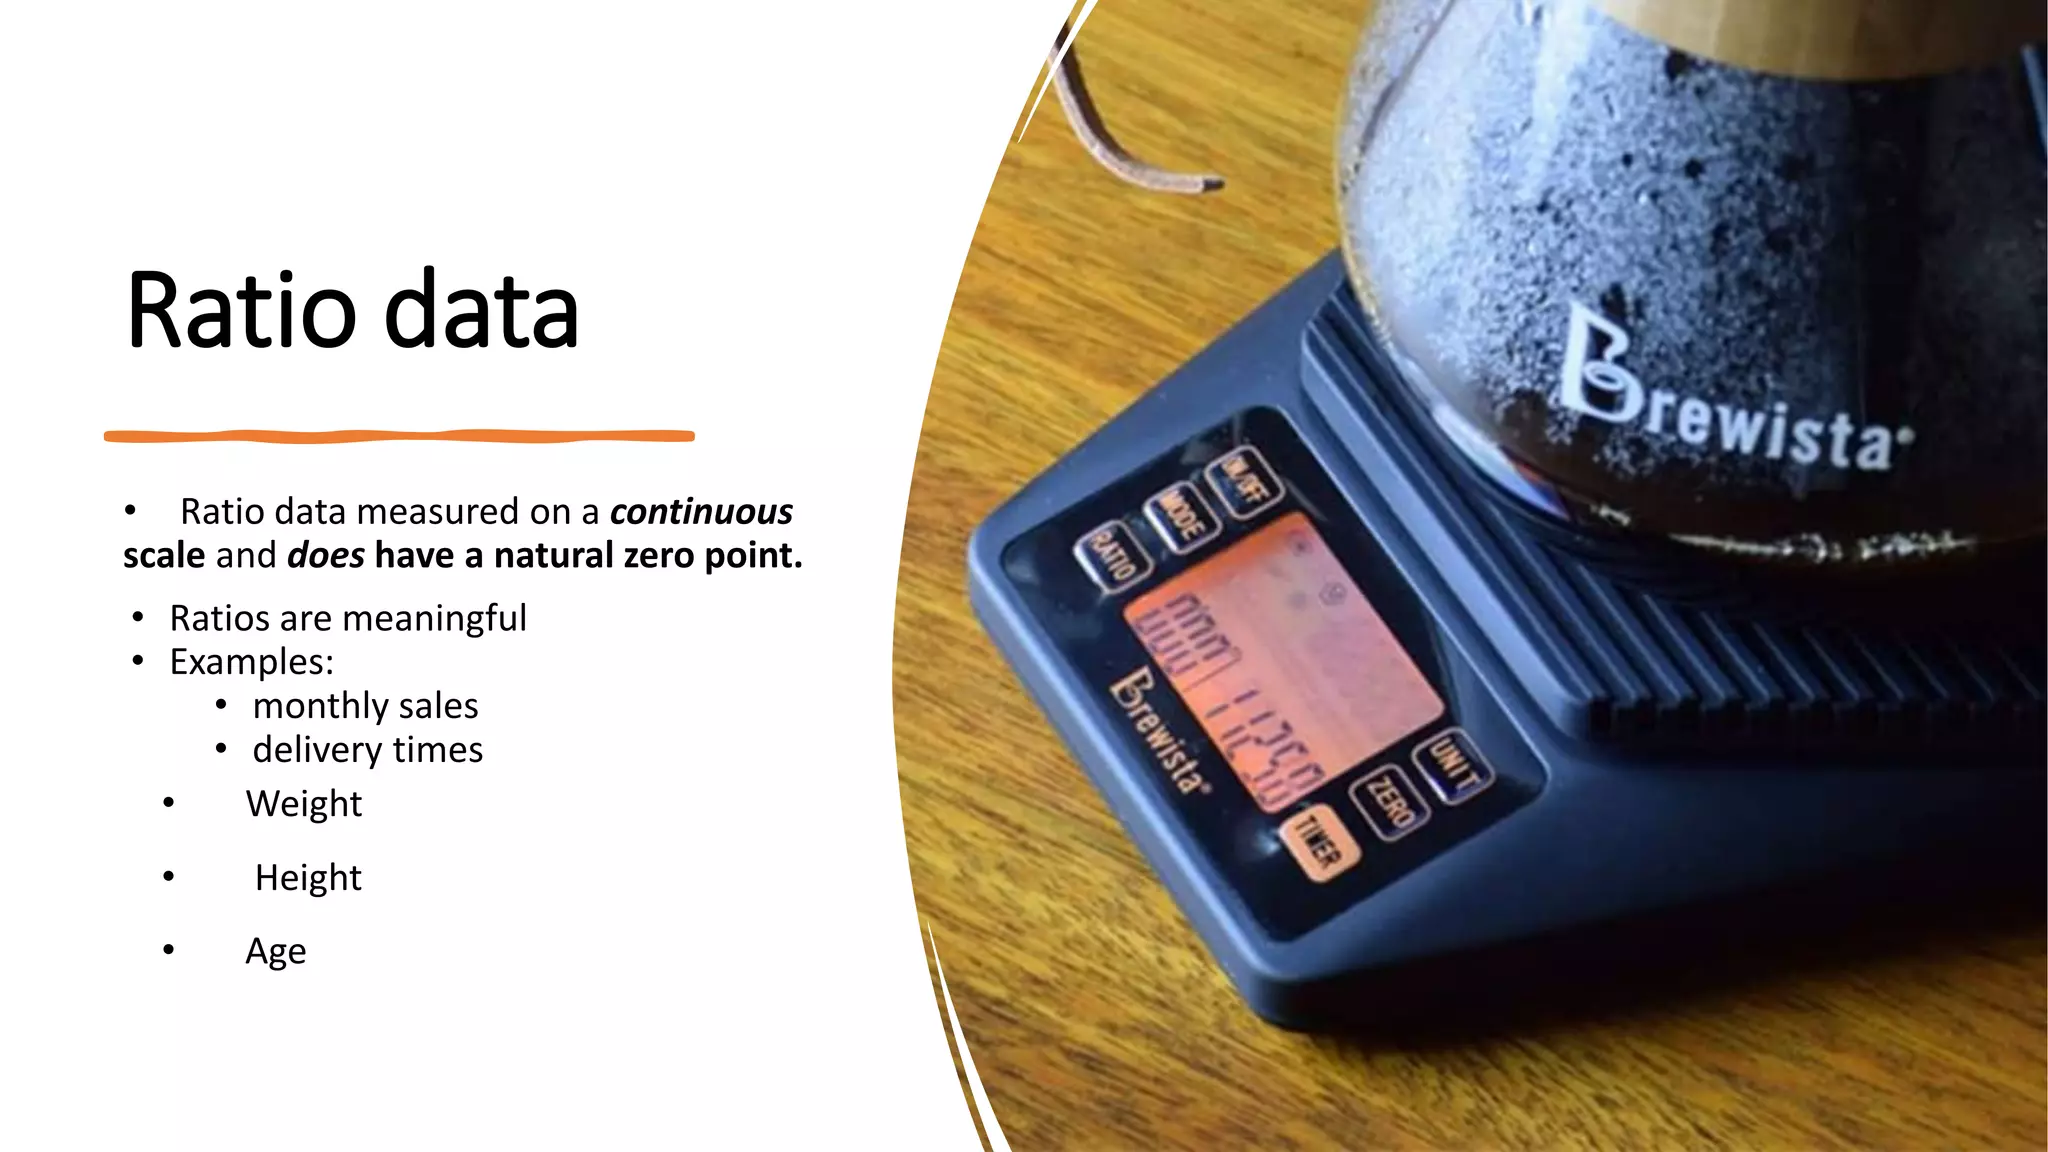
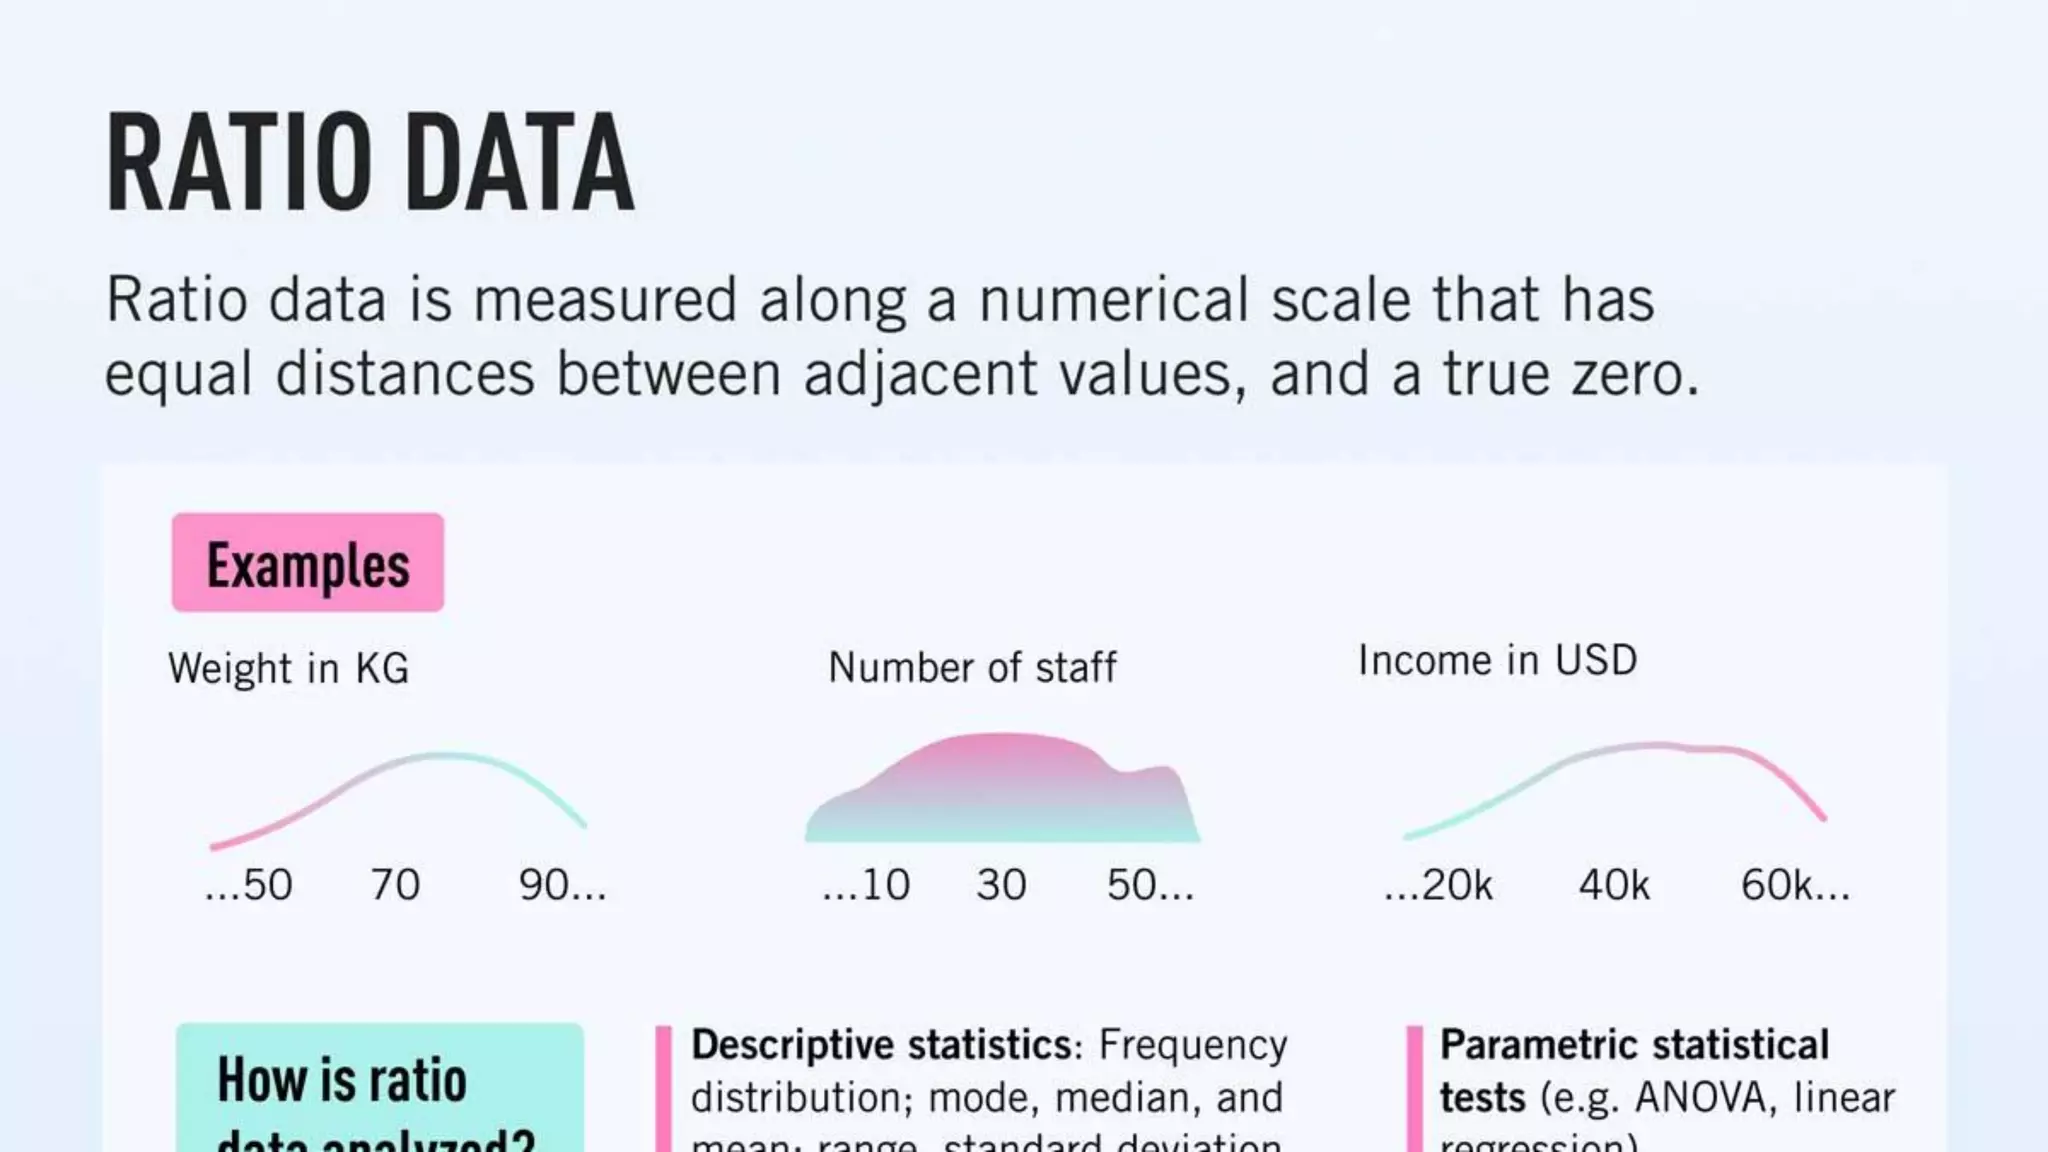
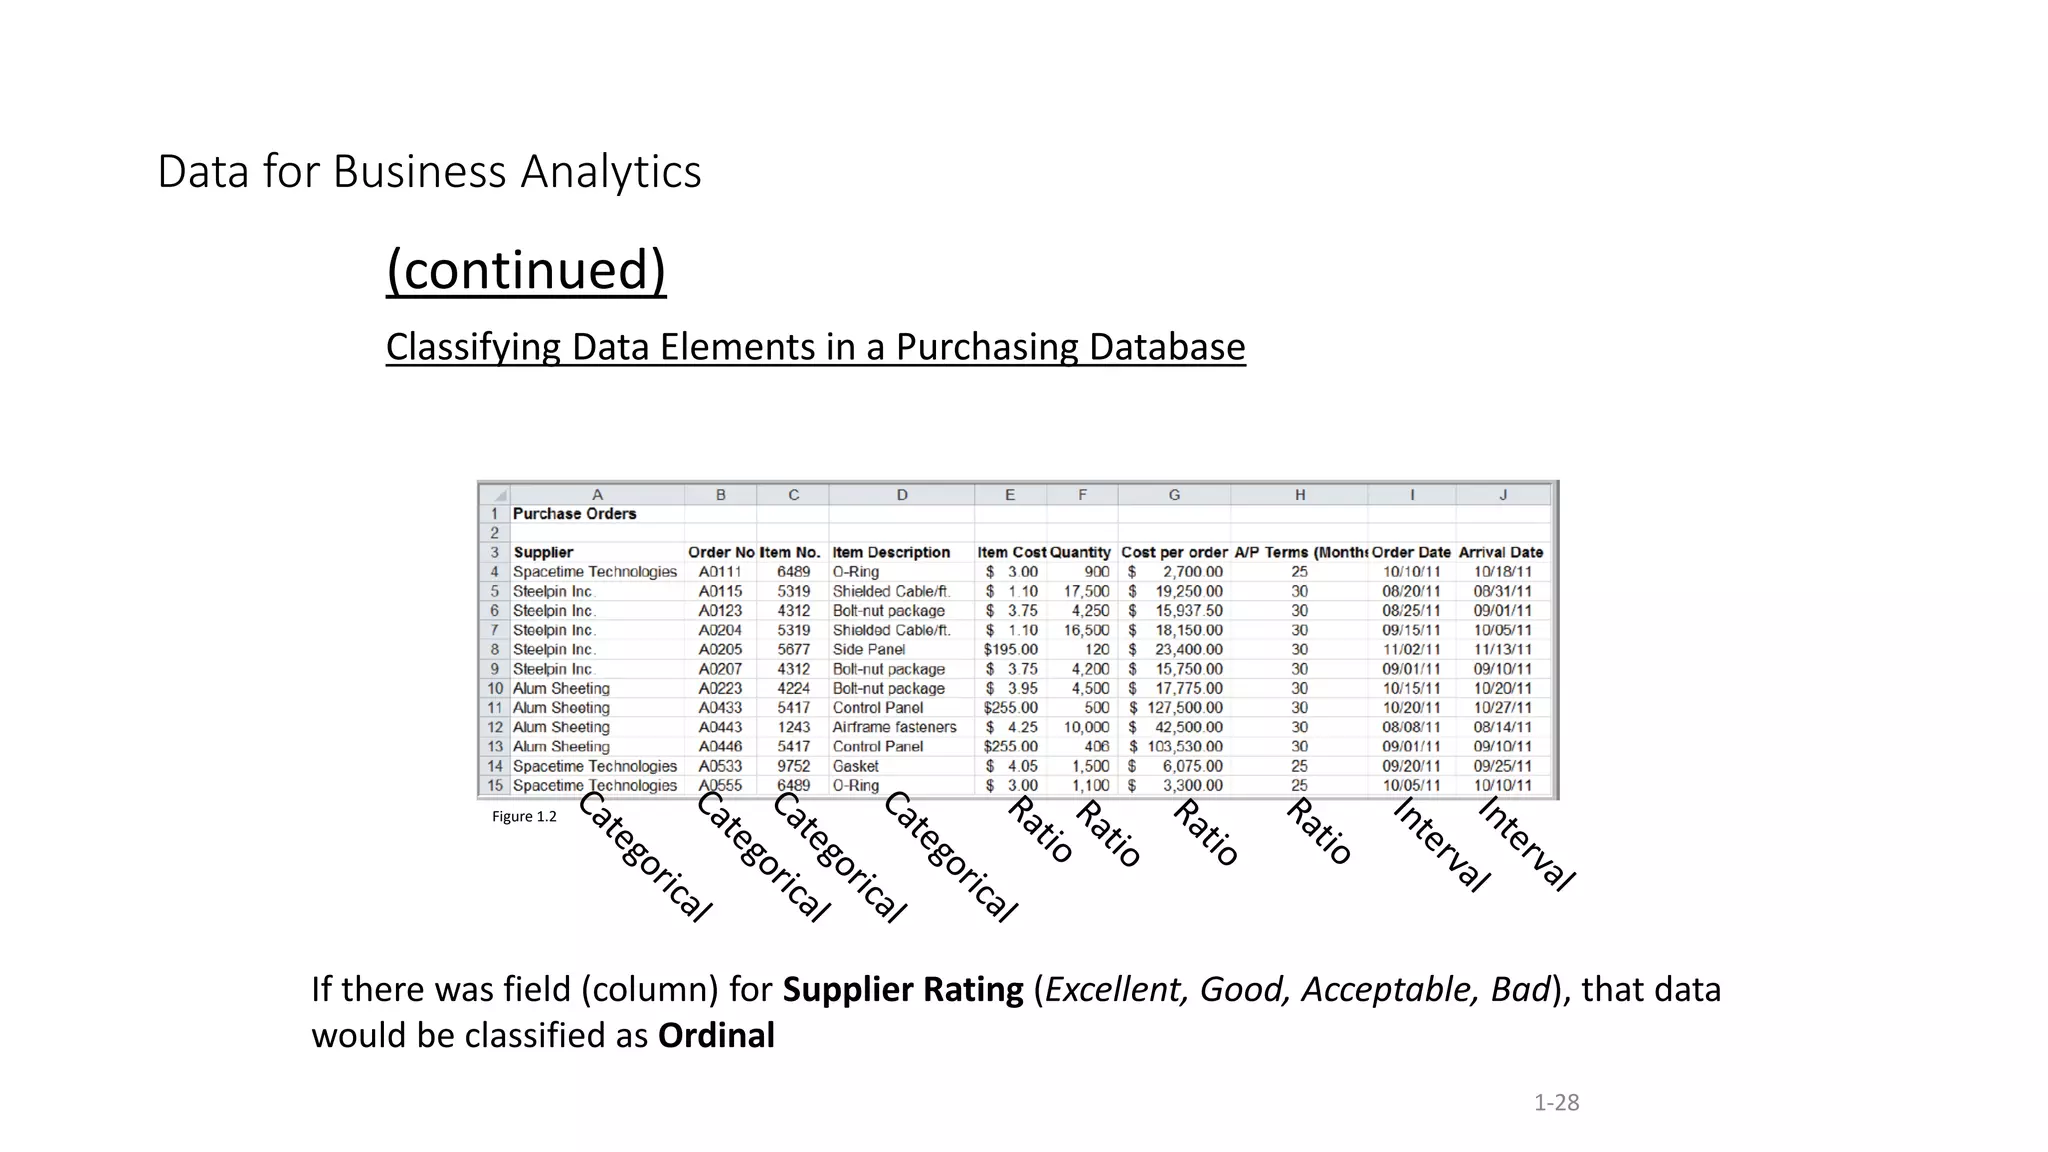
Explains different types of data: nominal, ordinal, interval, and ratio. Includes their characteristics and examples.
Explains different types of data: nominal, ordinal, interval, and ratio. Includes their characteristics and examples.
Explains different types of data: nominal, ordinal, interval, and ratio. Includes their characteristics and examples.
Explains different types of data: nominal, ordinal, interval, and ratio. Includes their characteristics and examples.
Explains different types of data: nominal, ordinal, interval, and ratio. Includes their characteristics and examples.
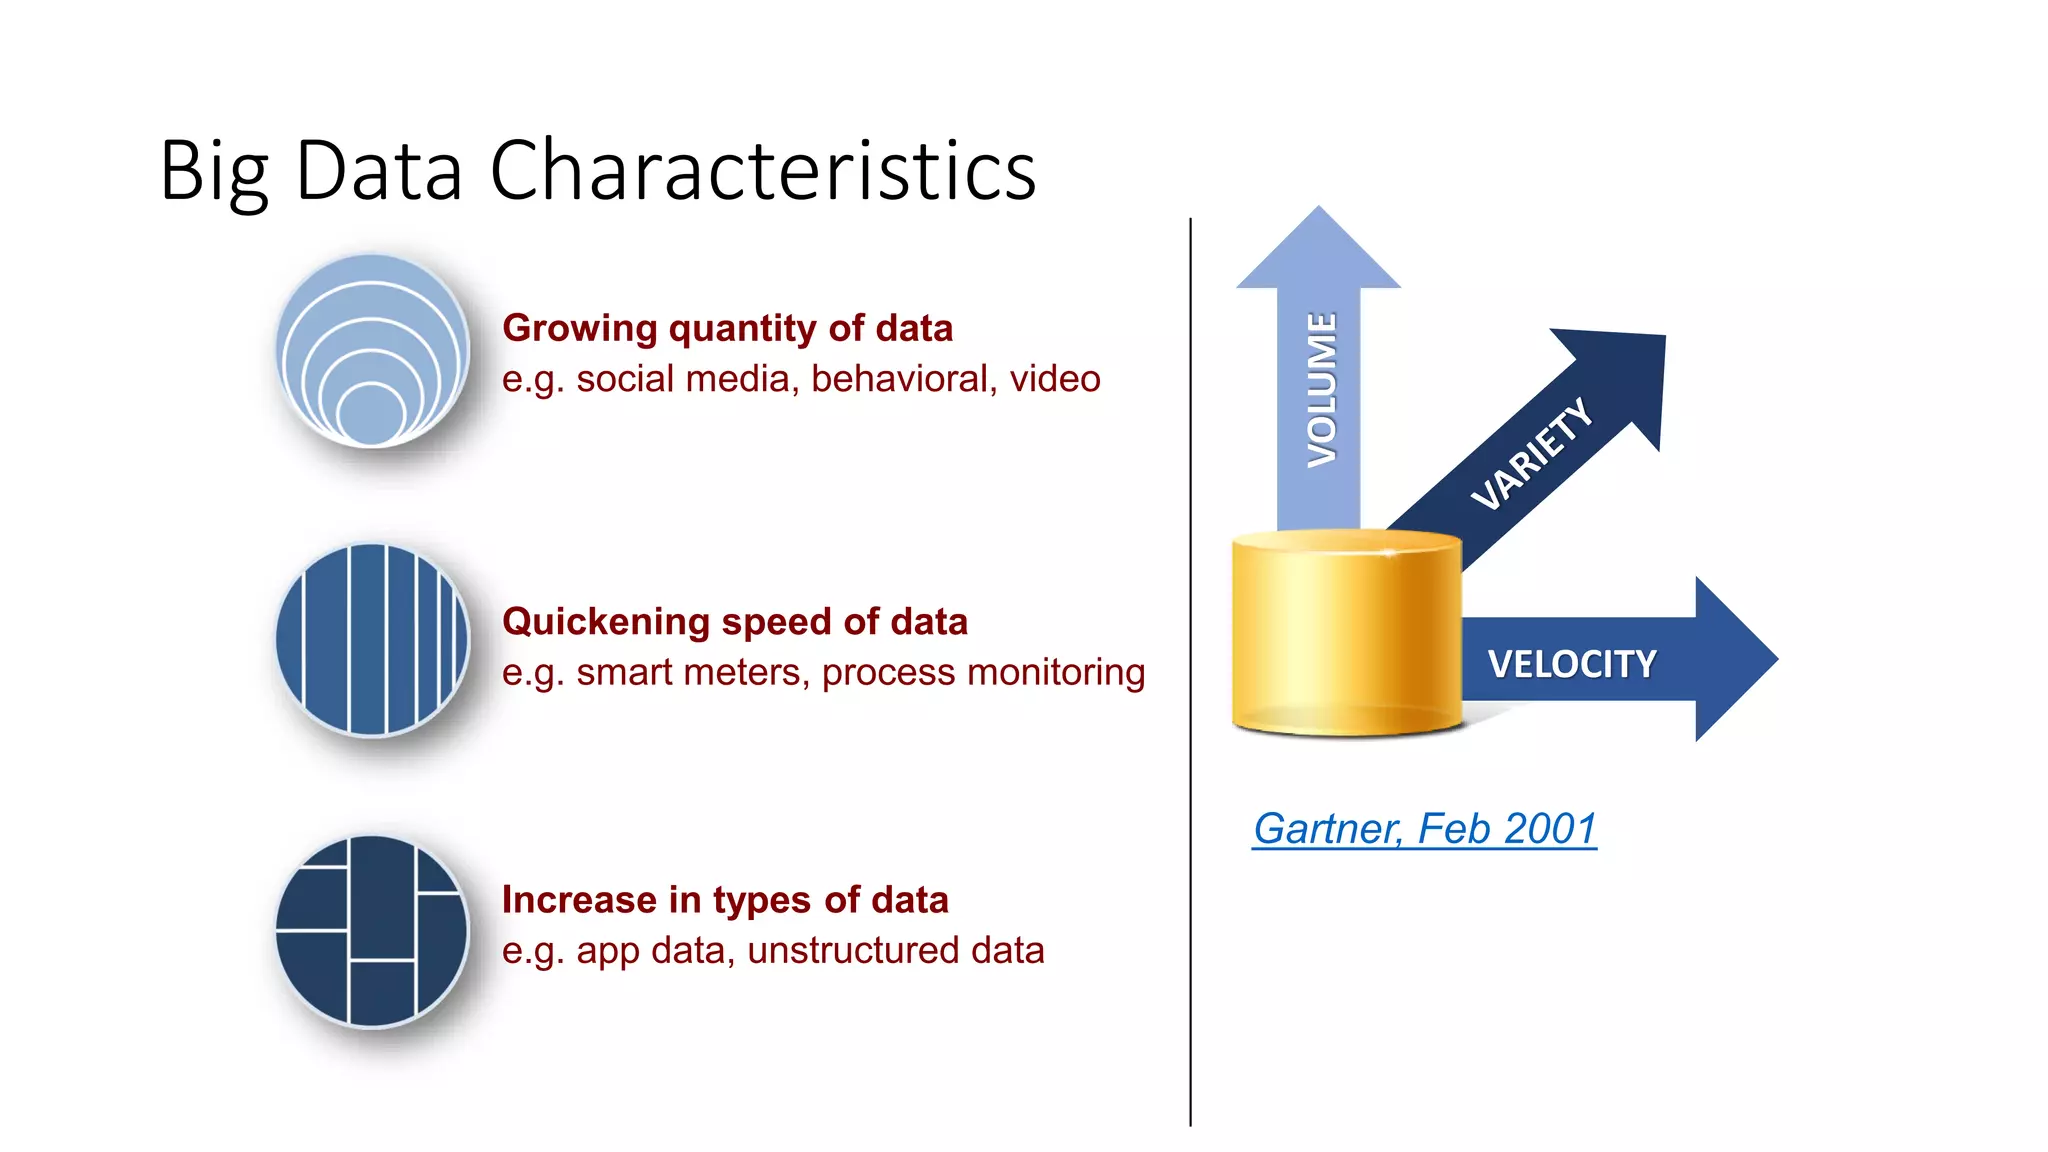
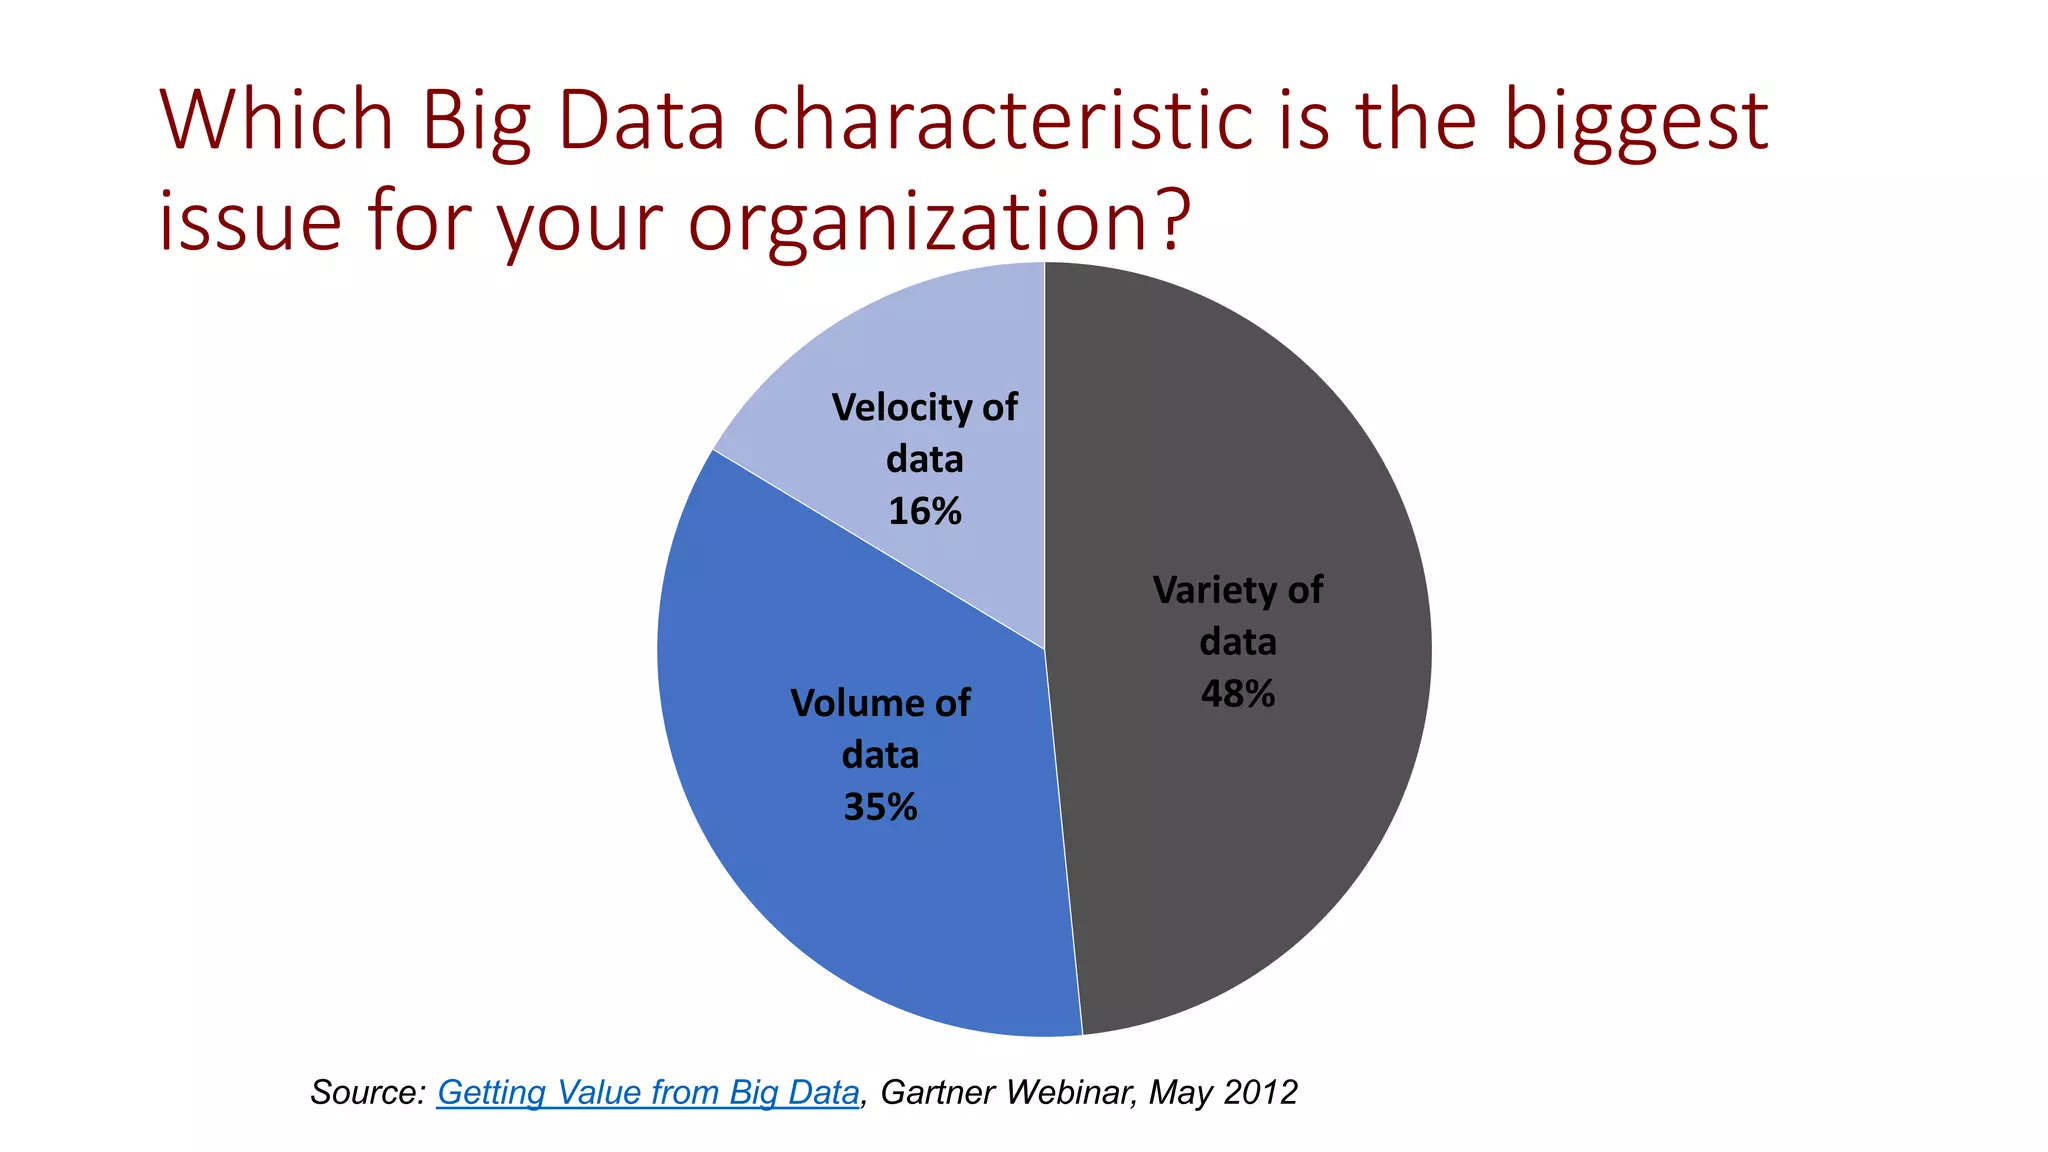
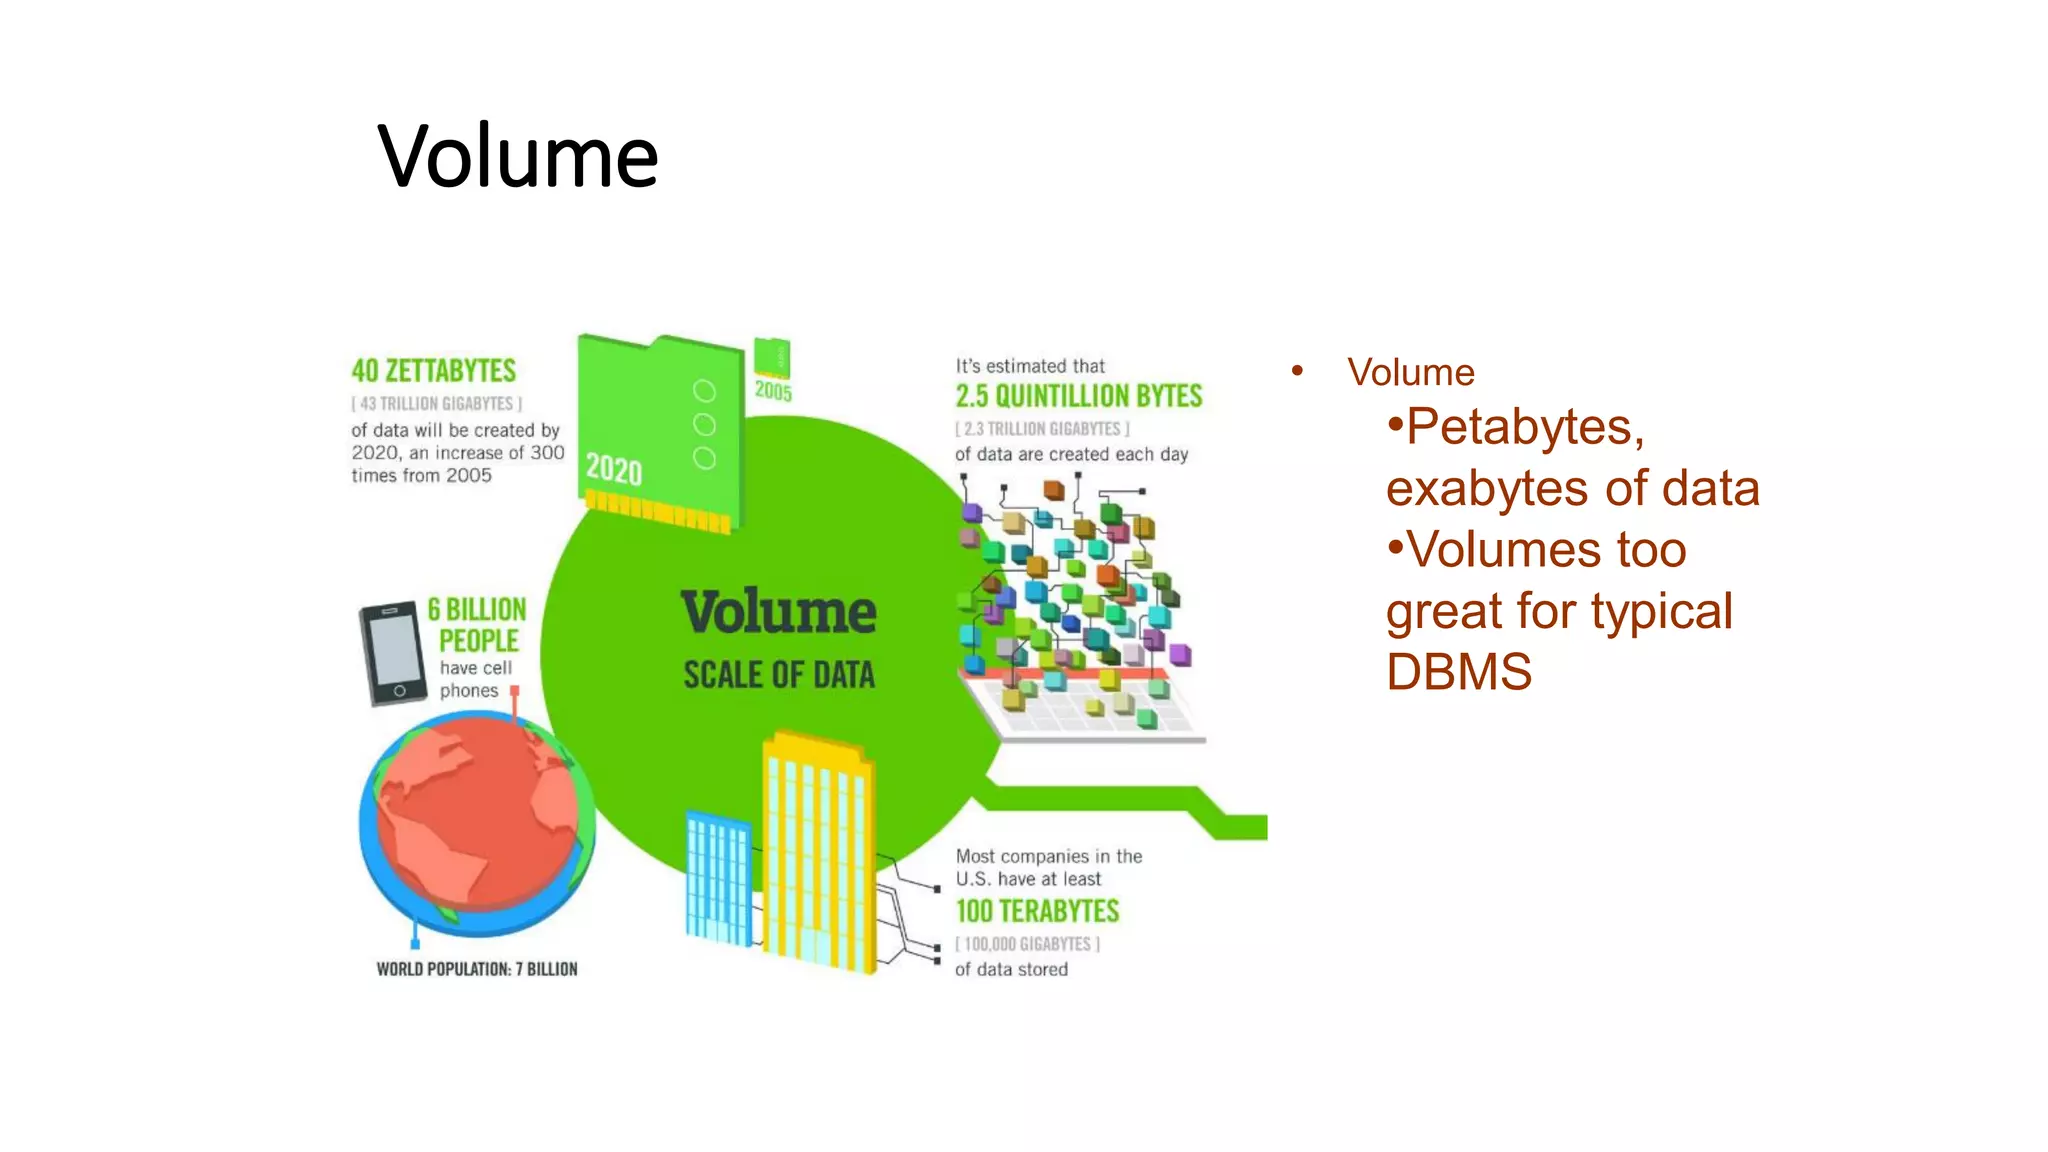
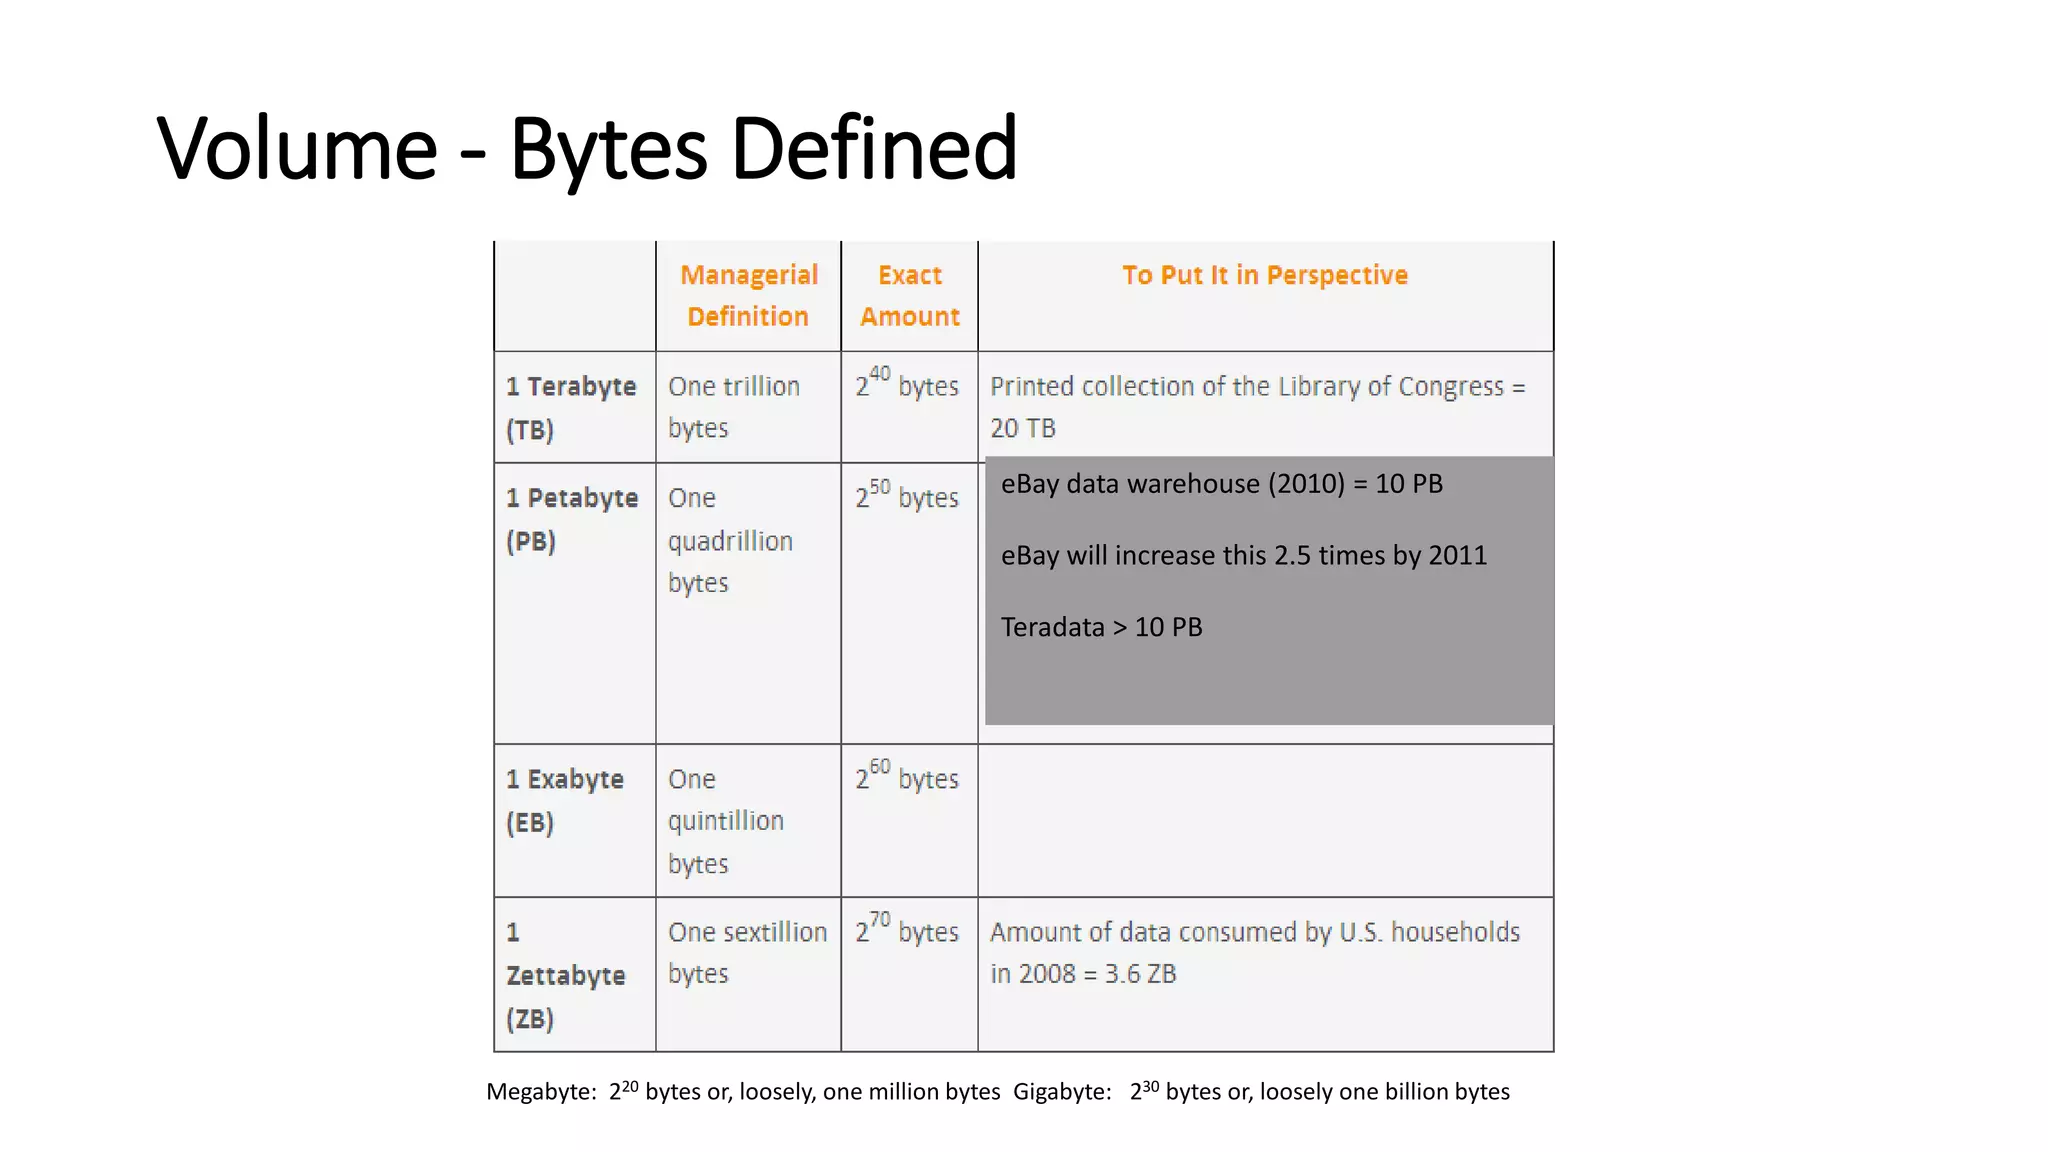
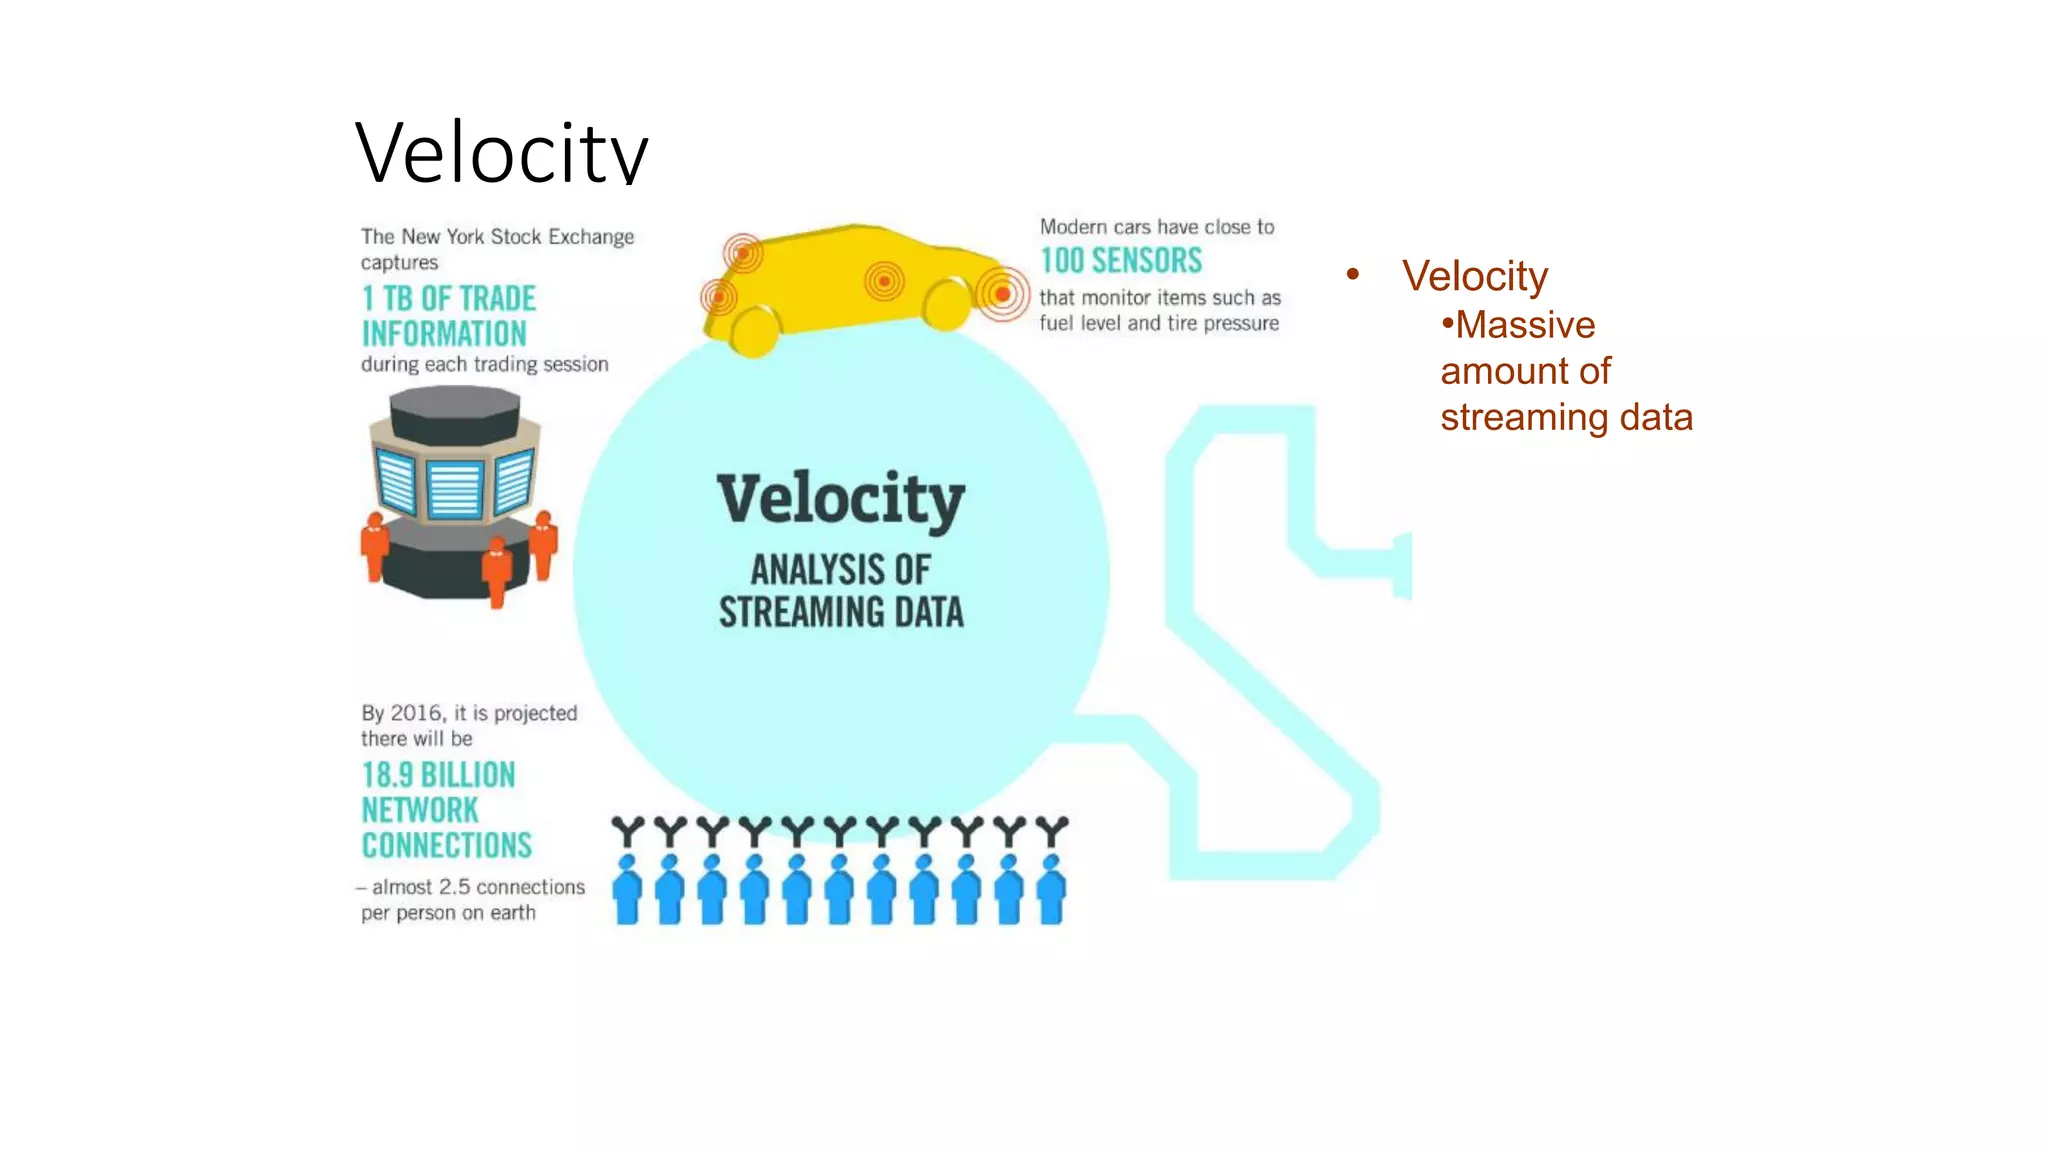
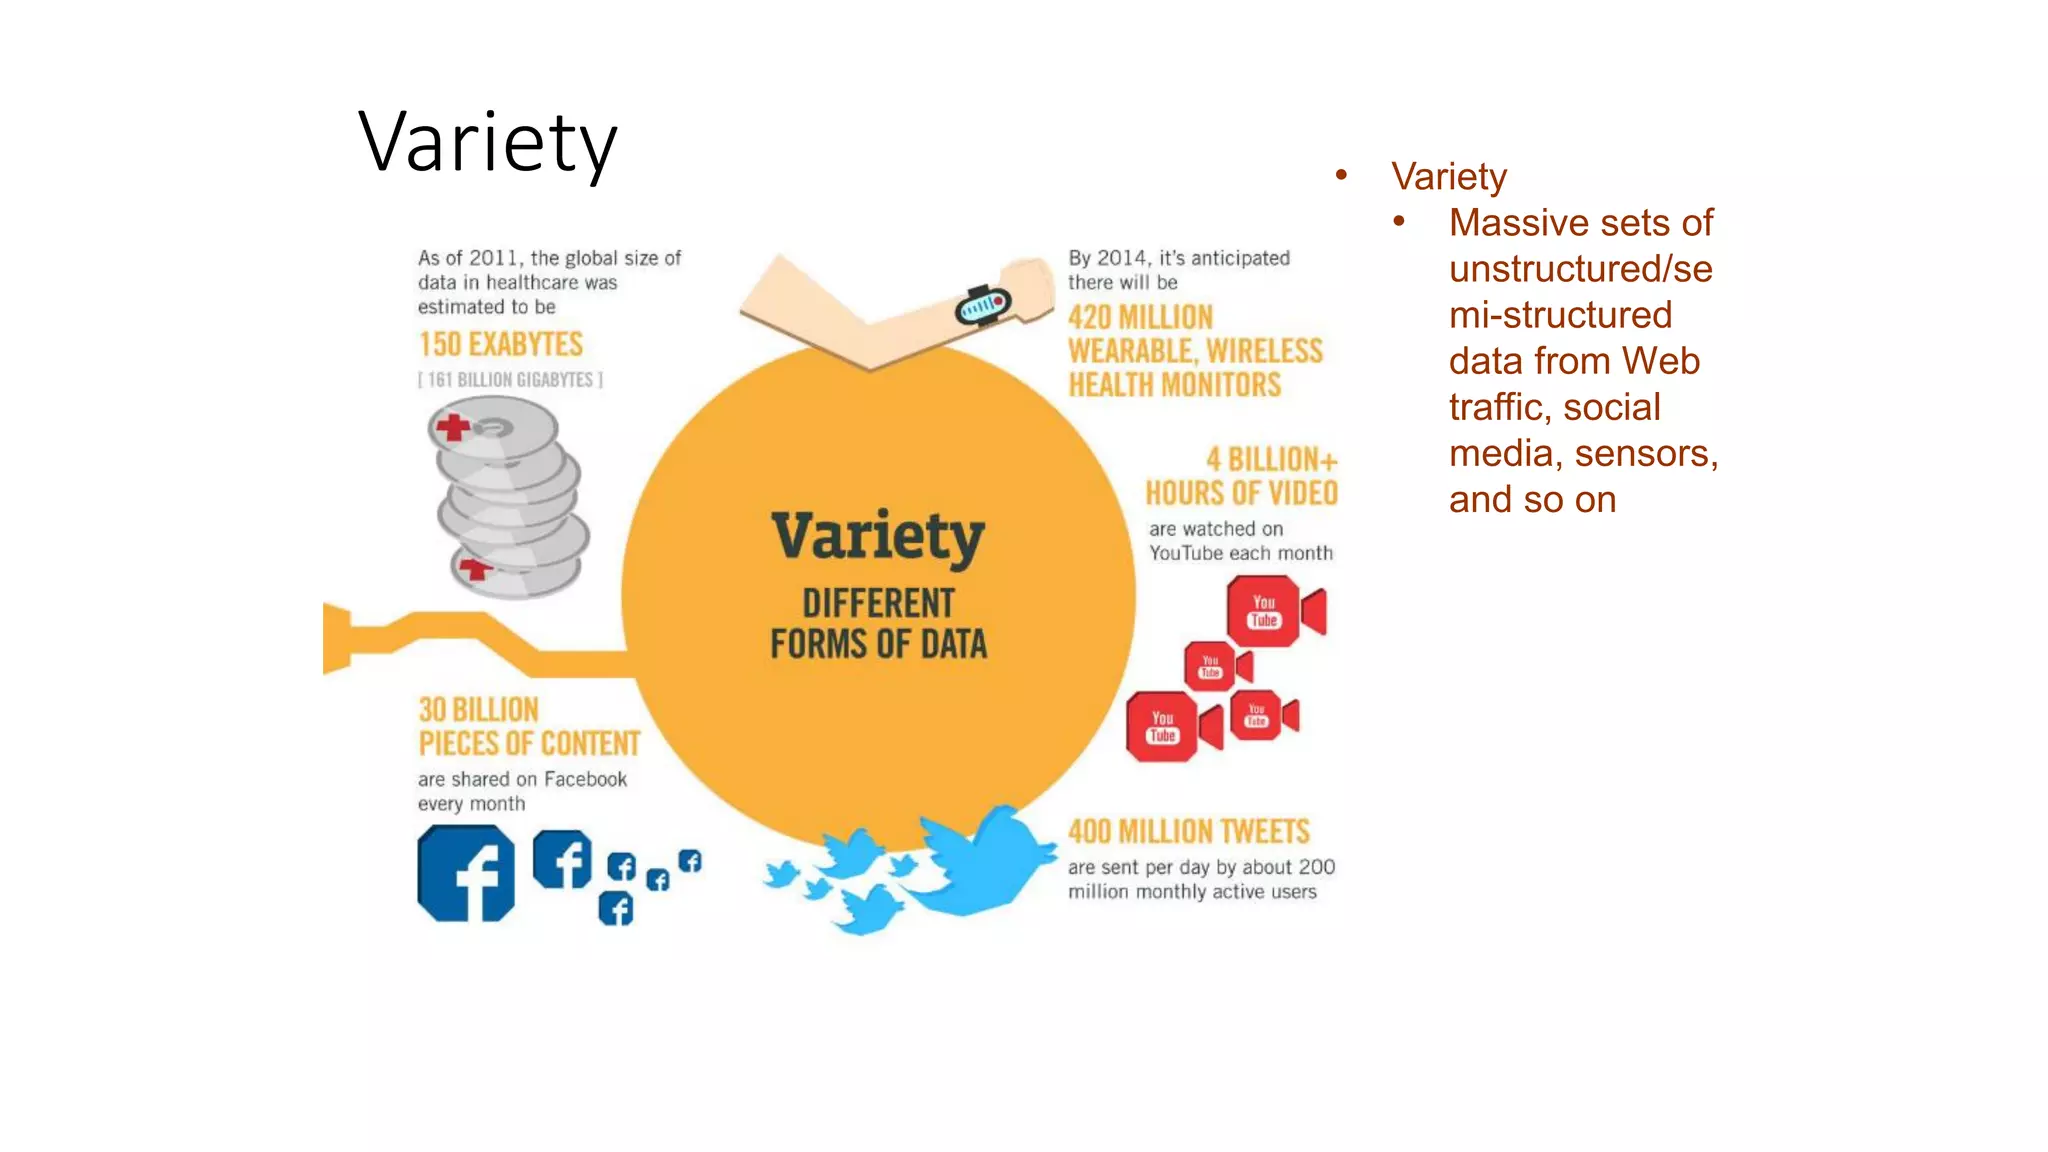
Describes characteristics of Big Data: Volume, Velocity, and Variety, with examples from organizations.
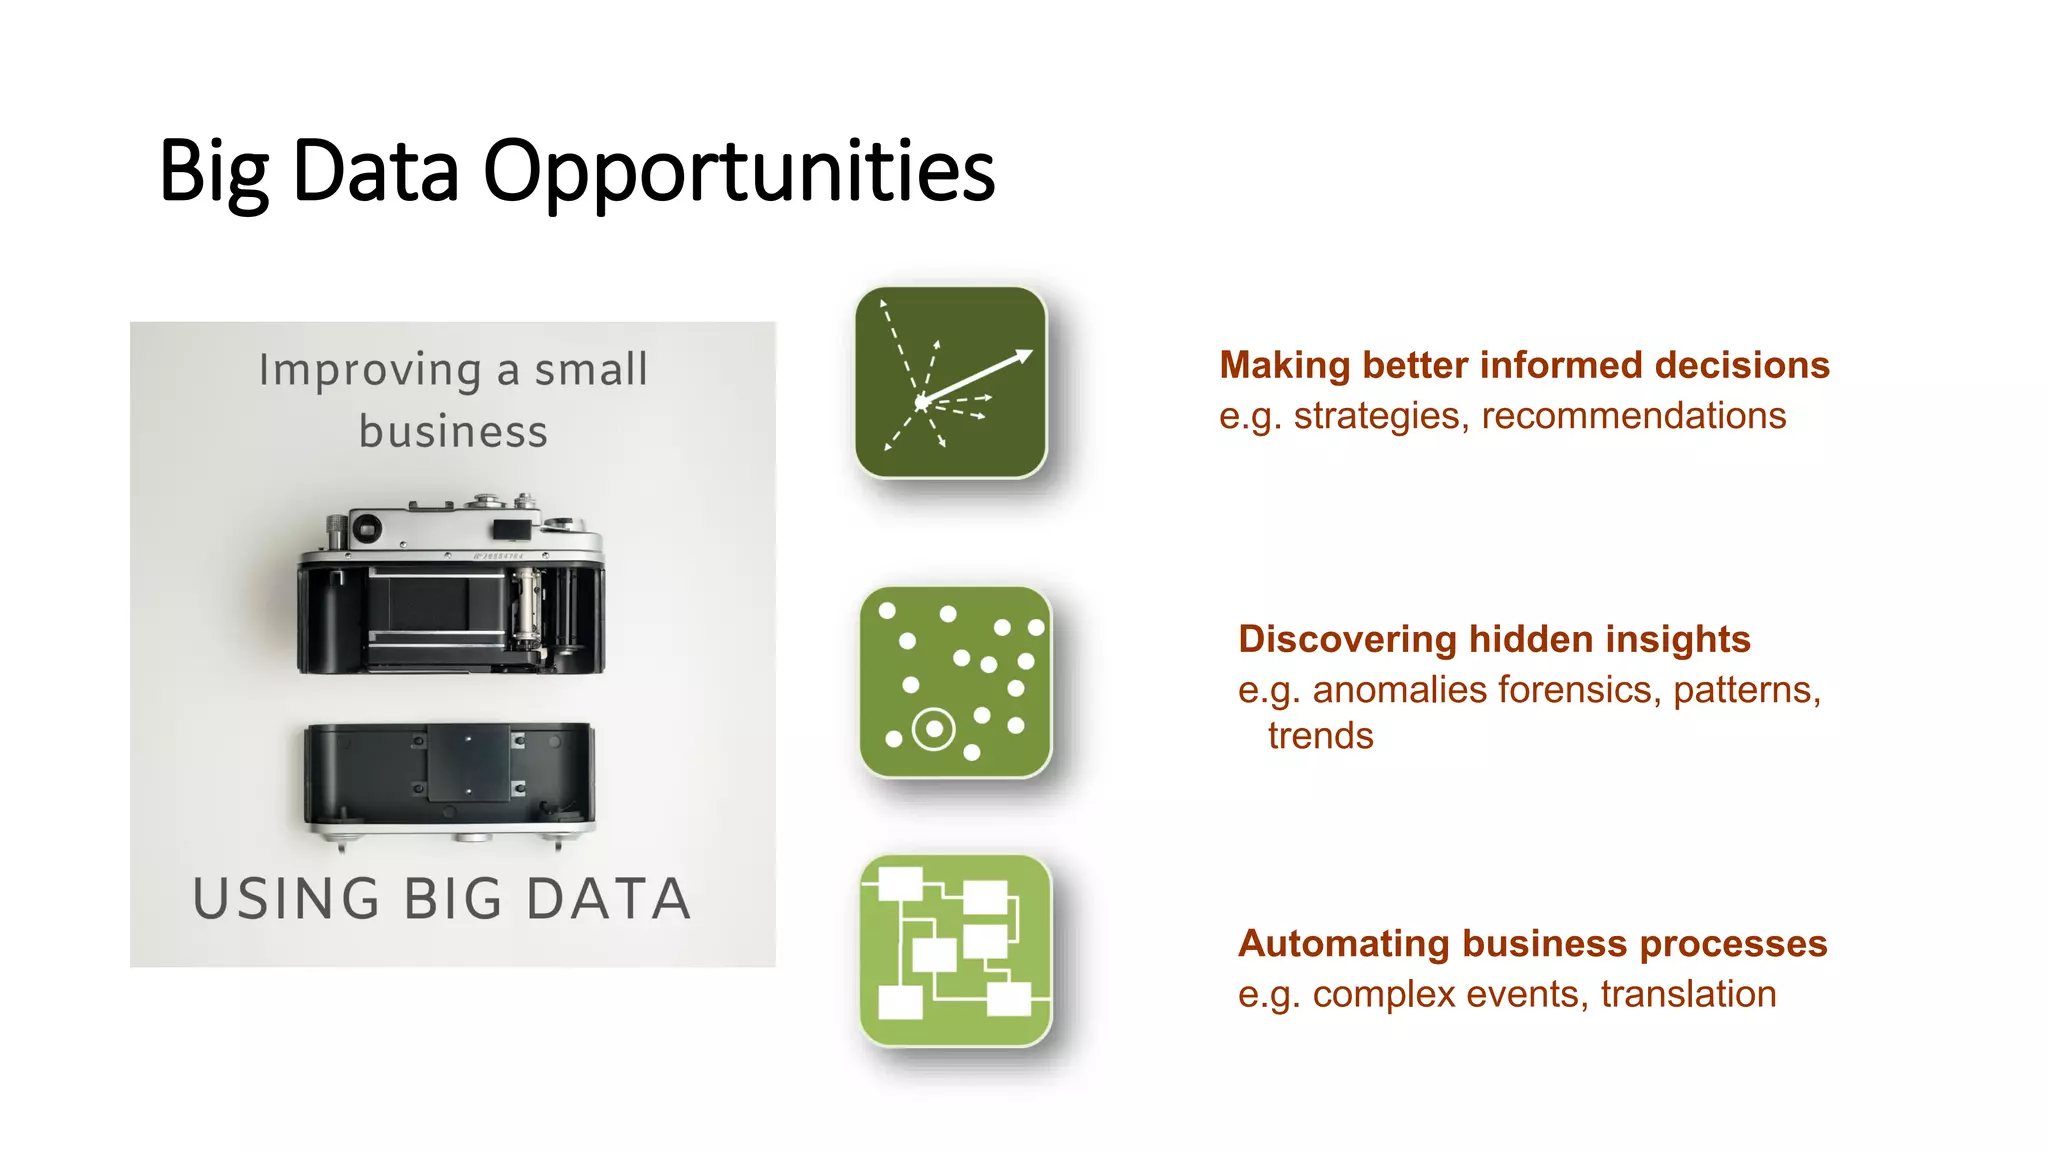
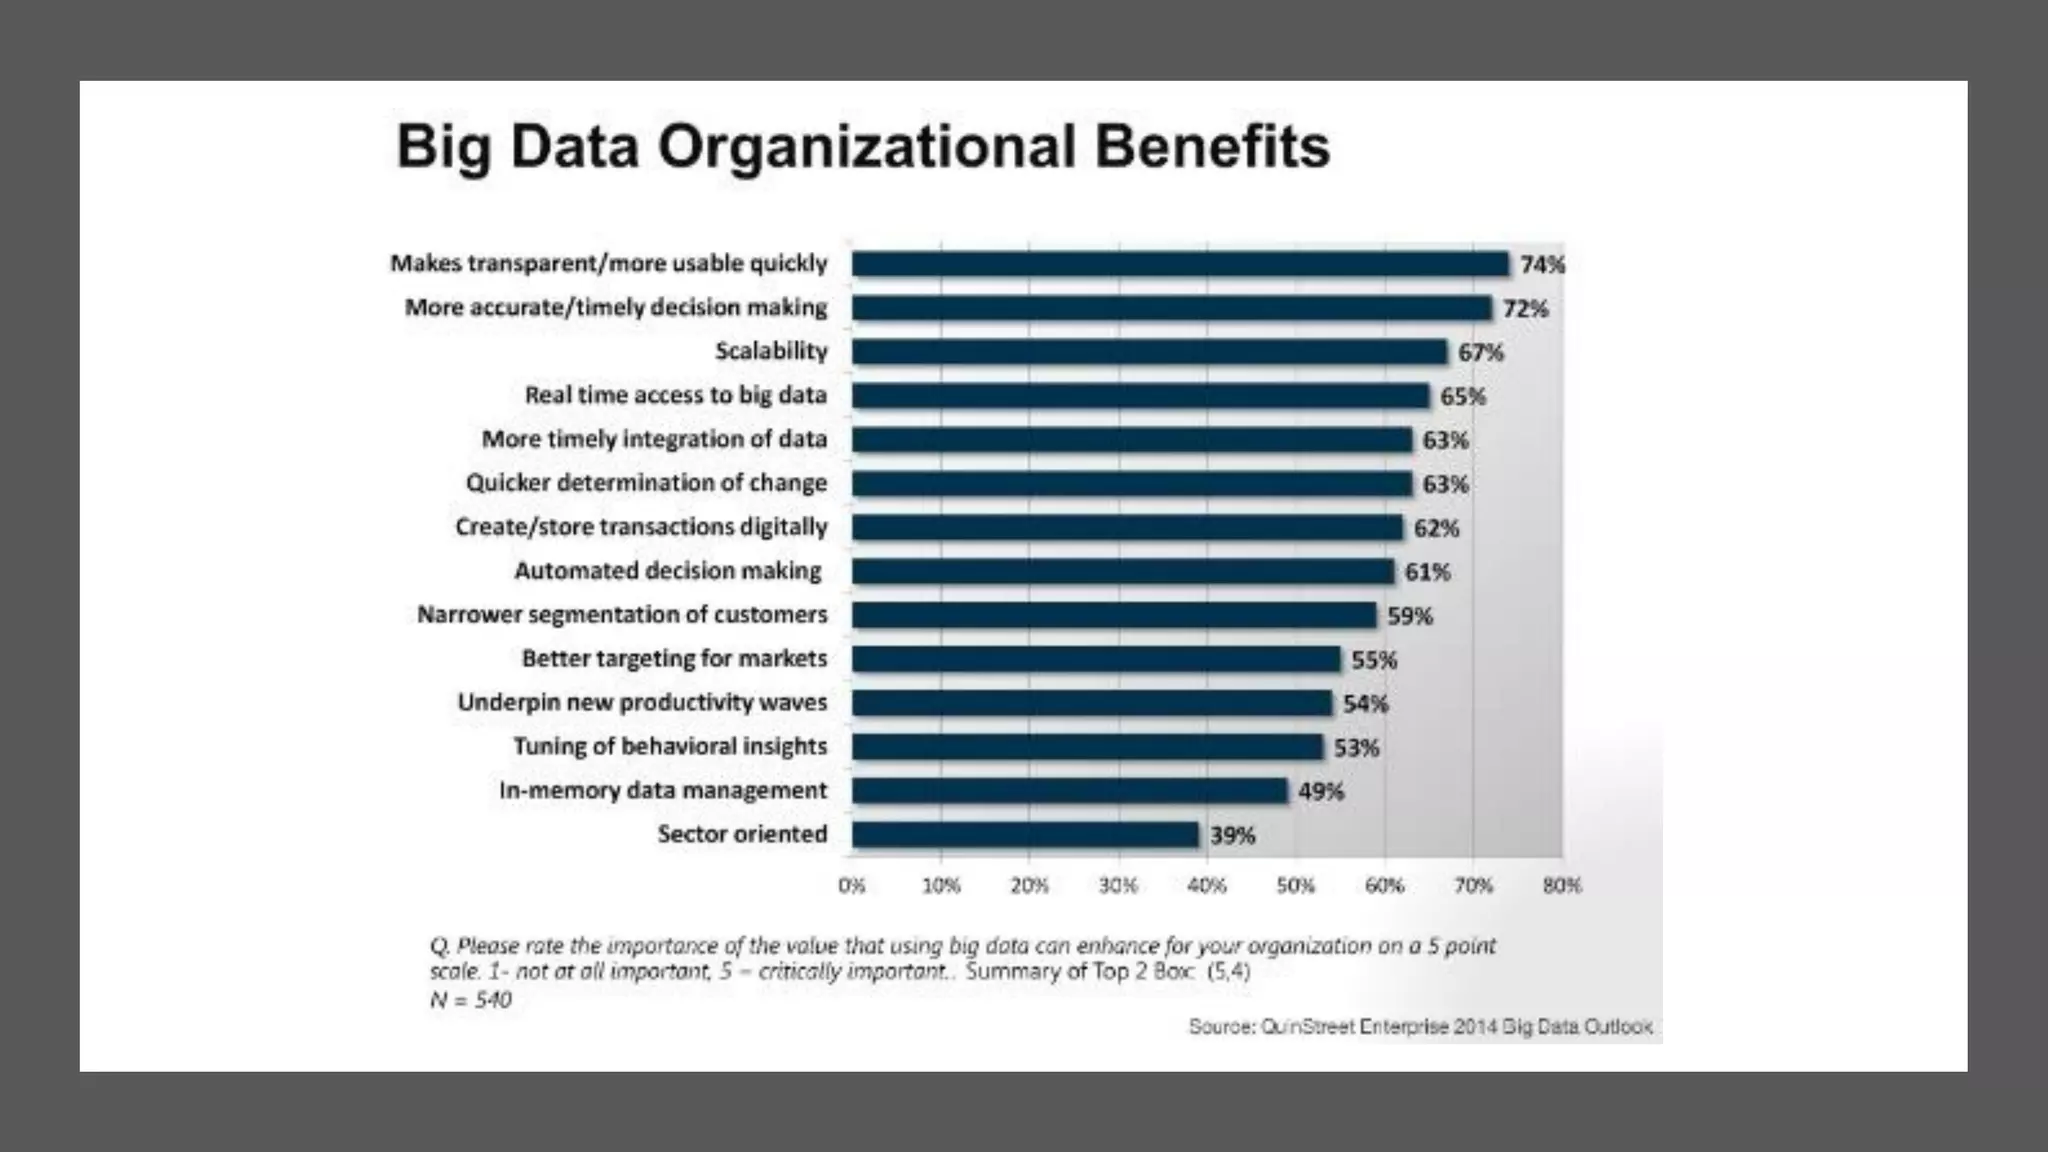
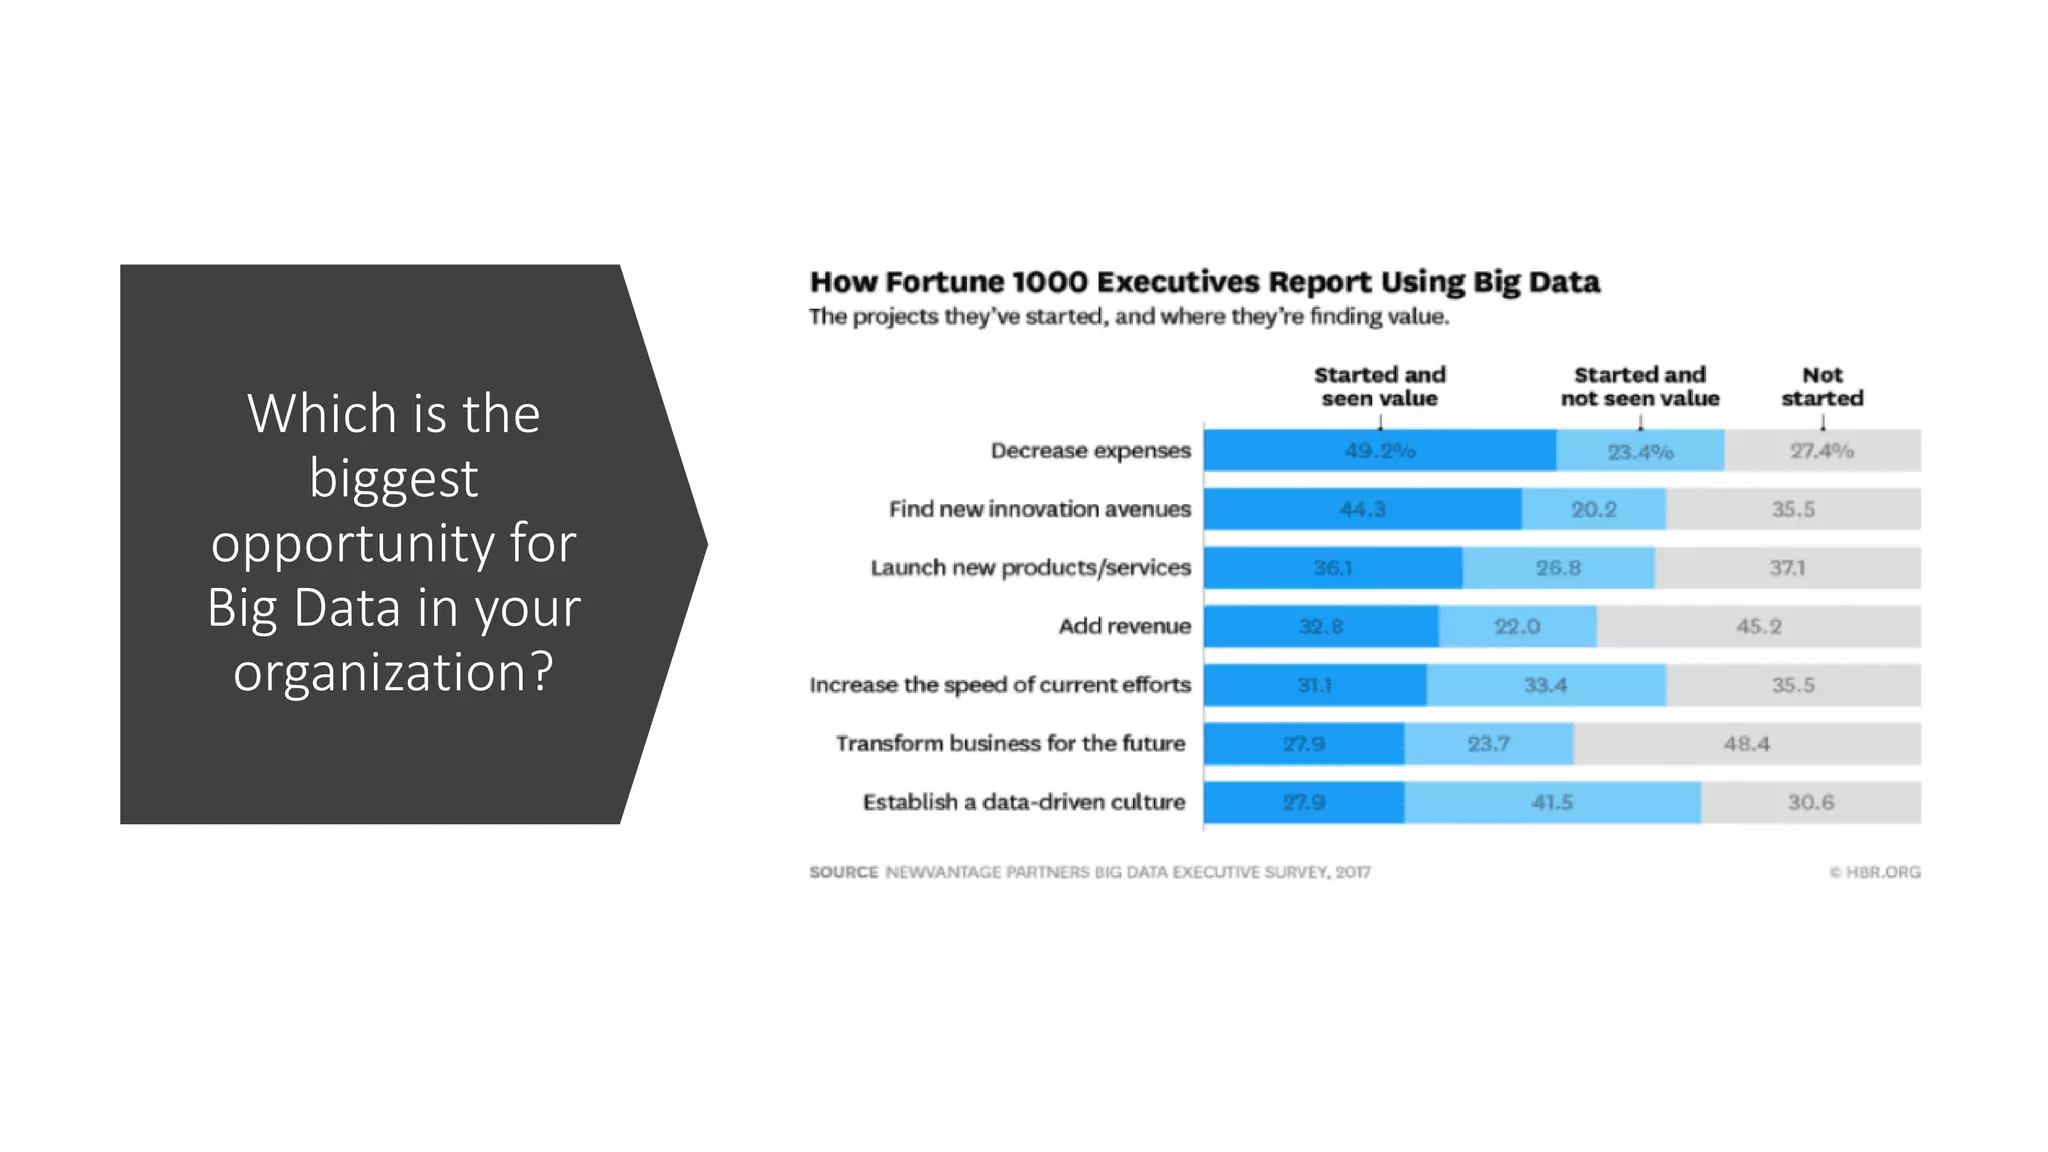
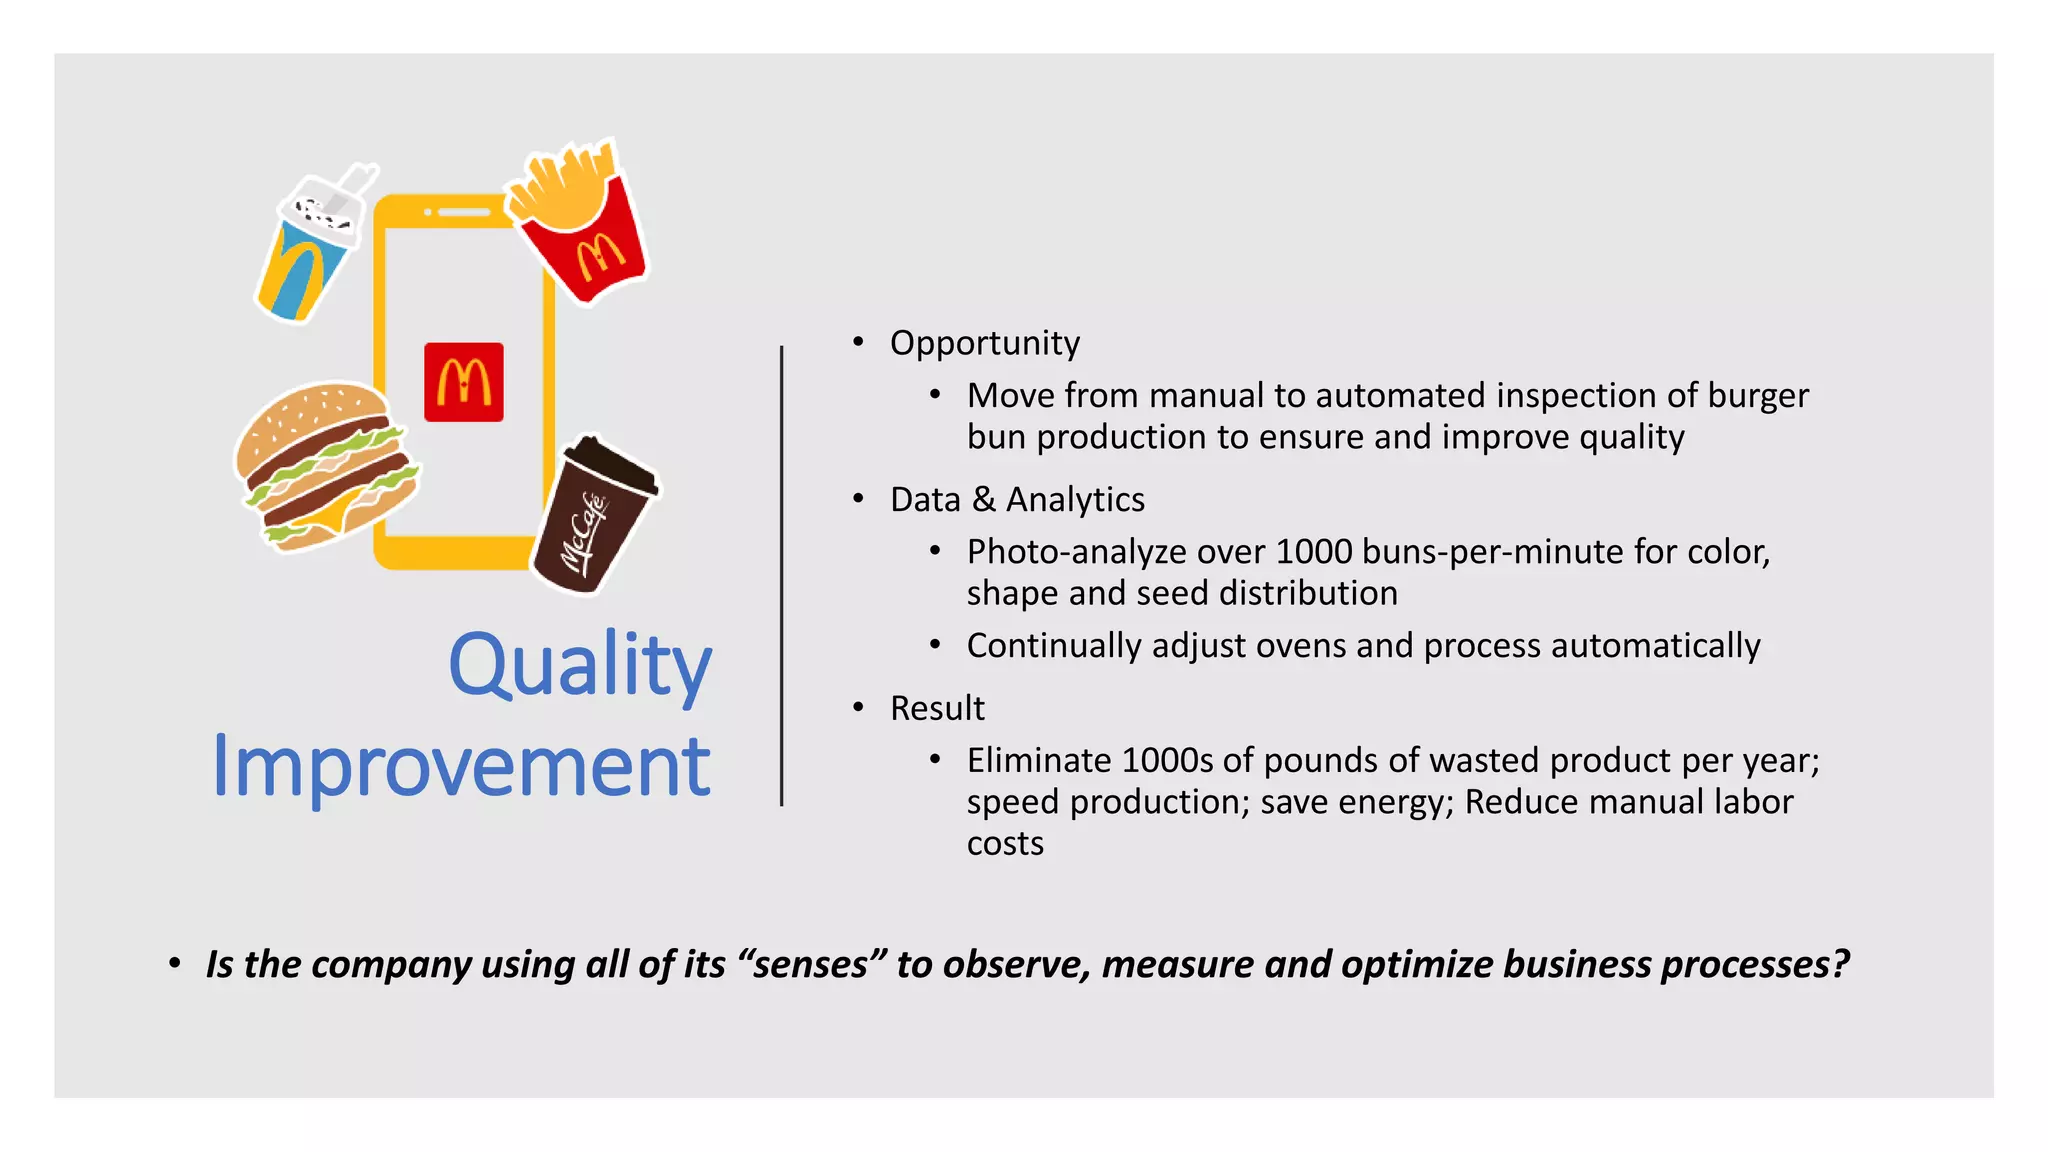
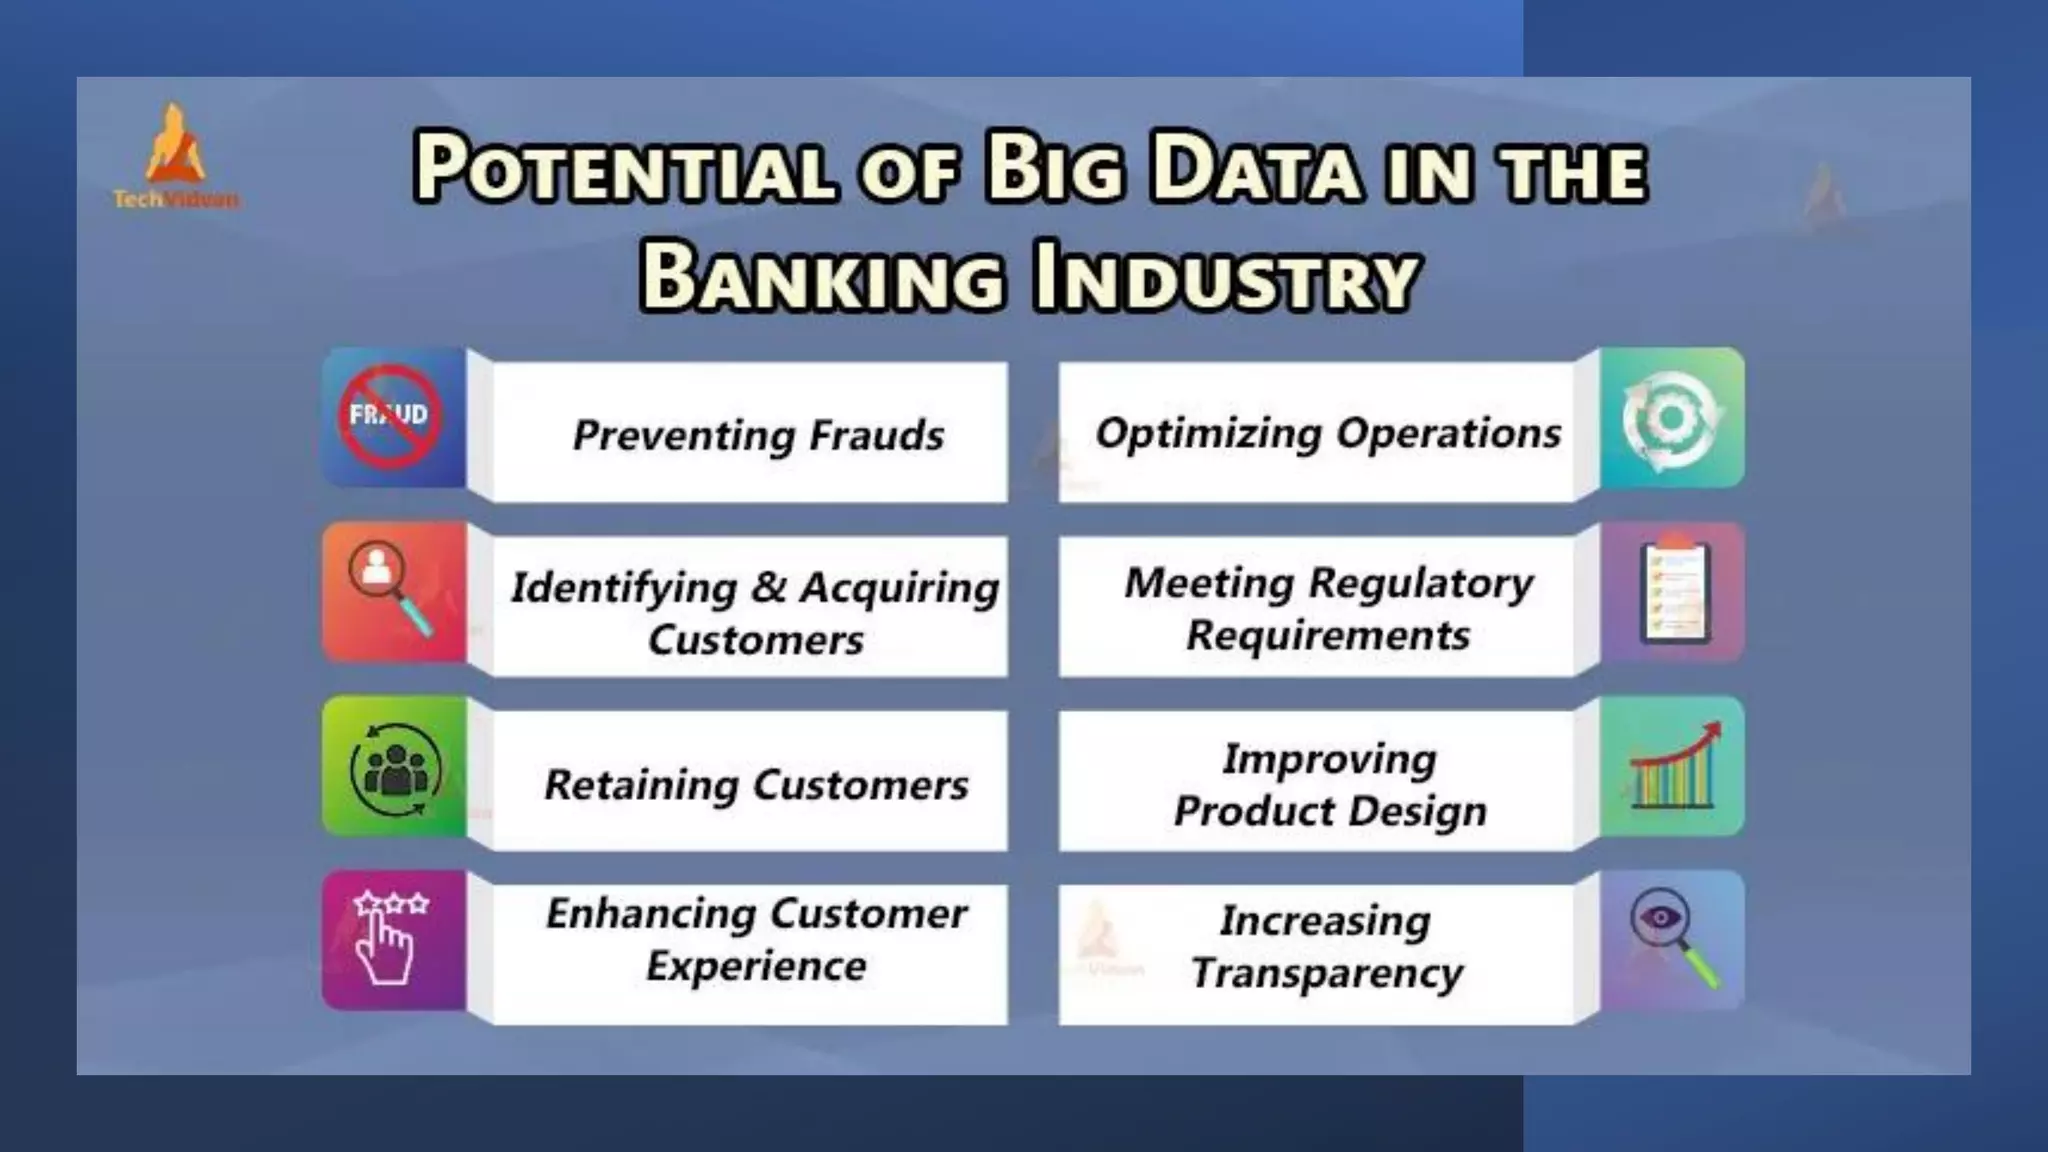
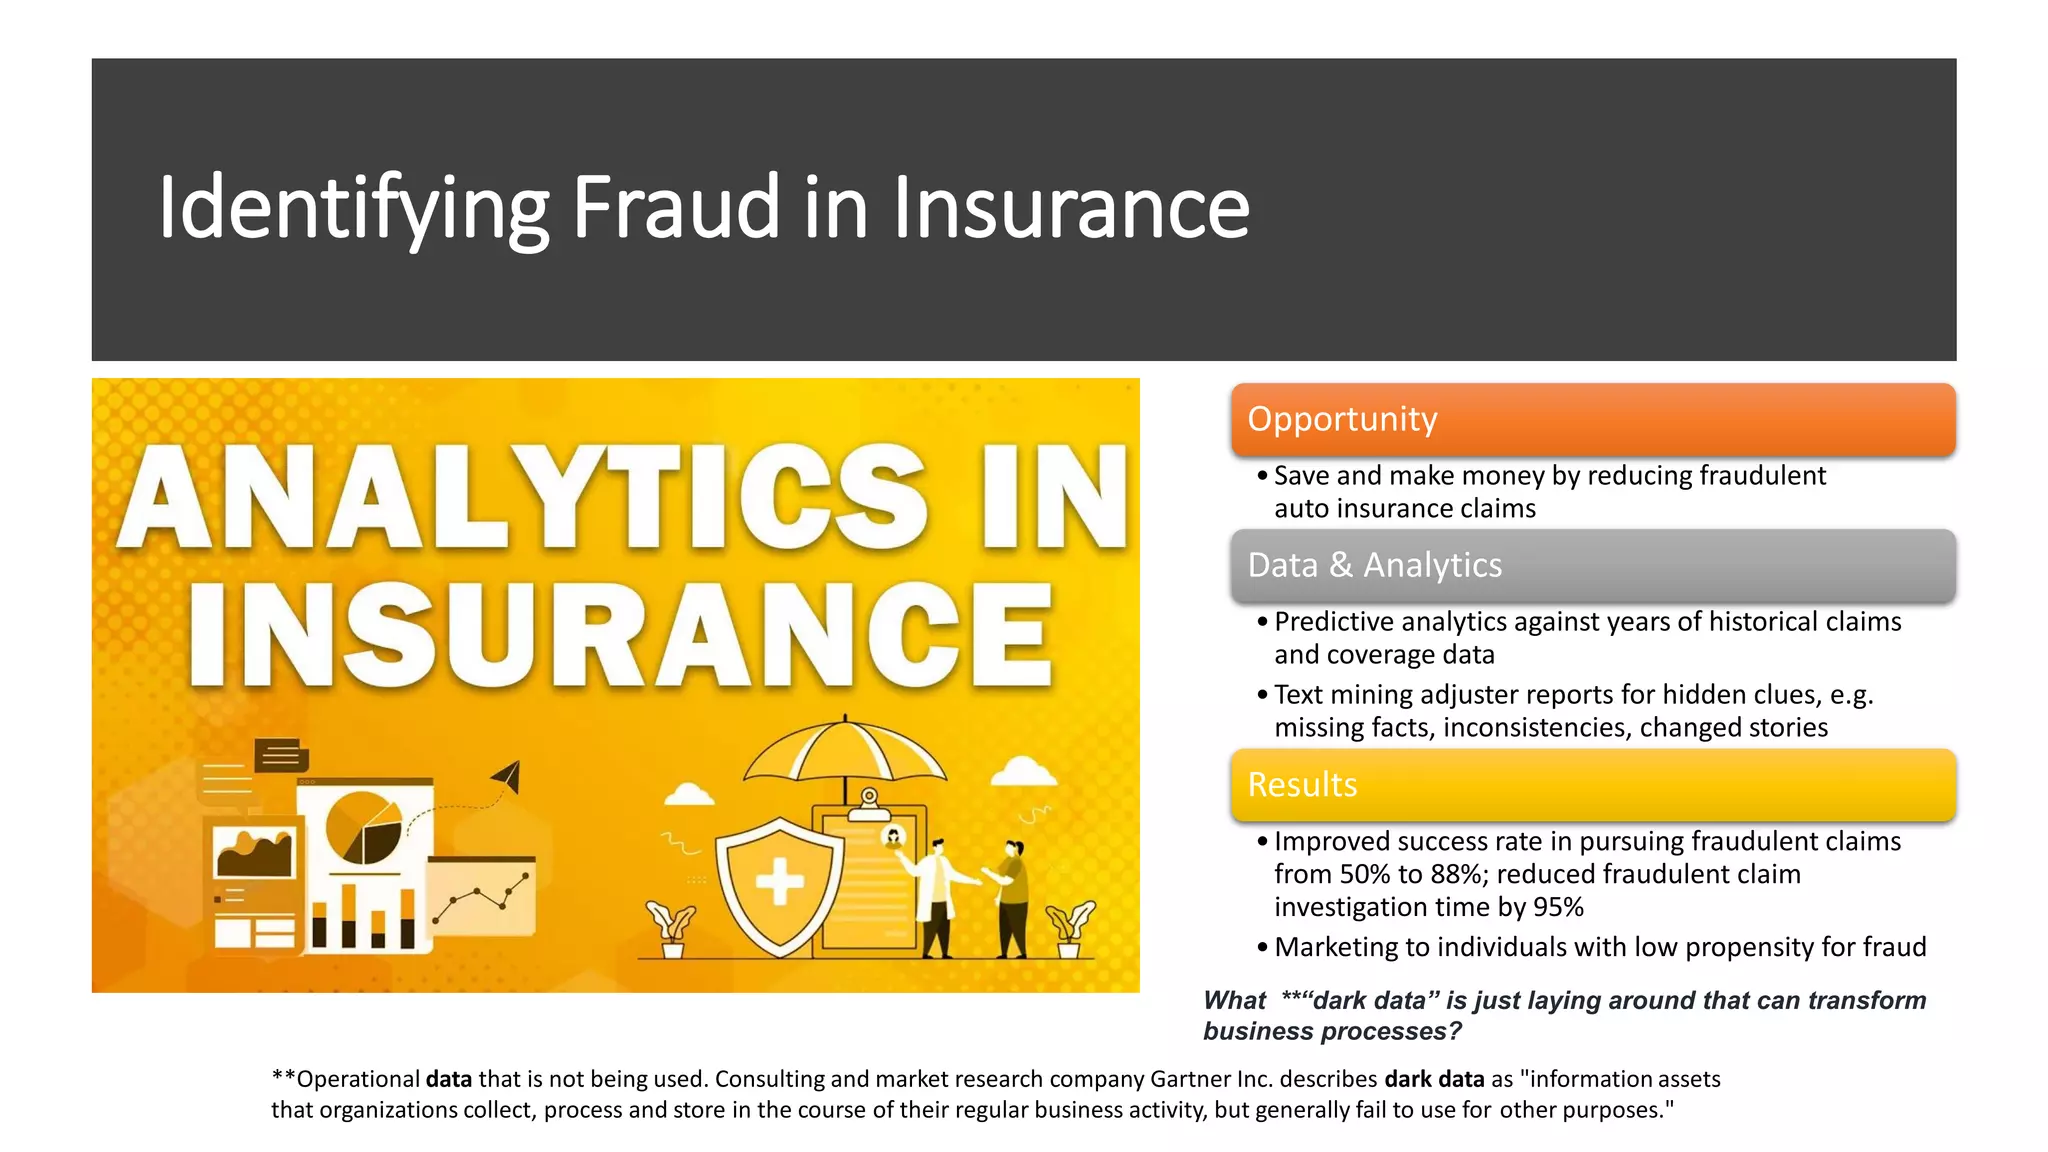
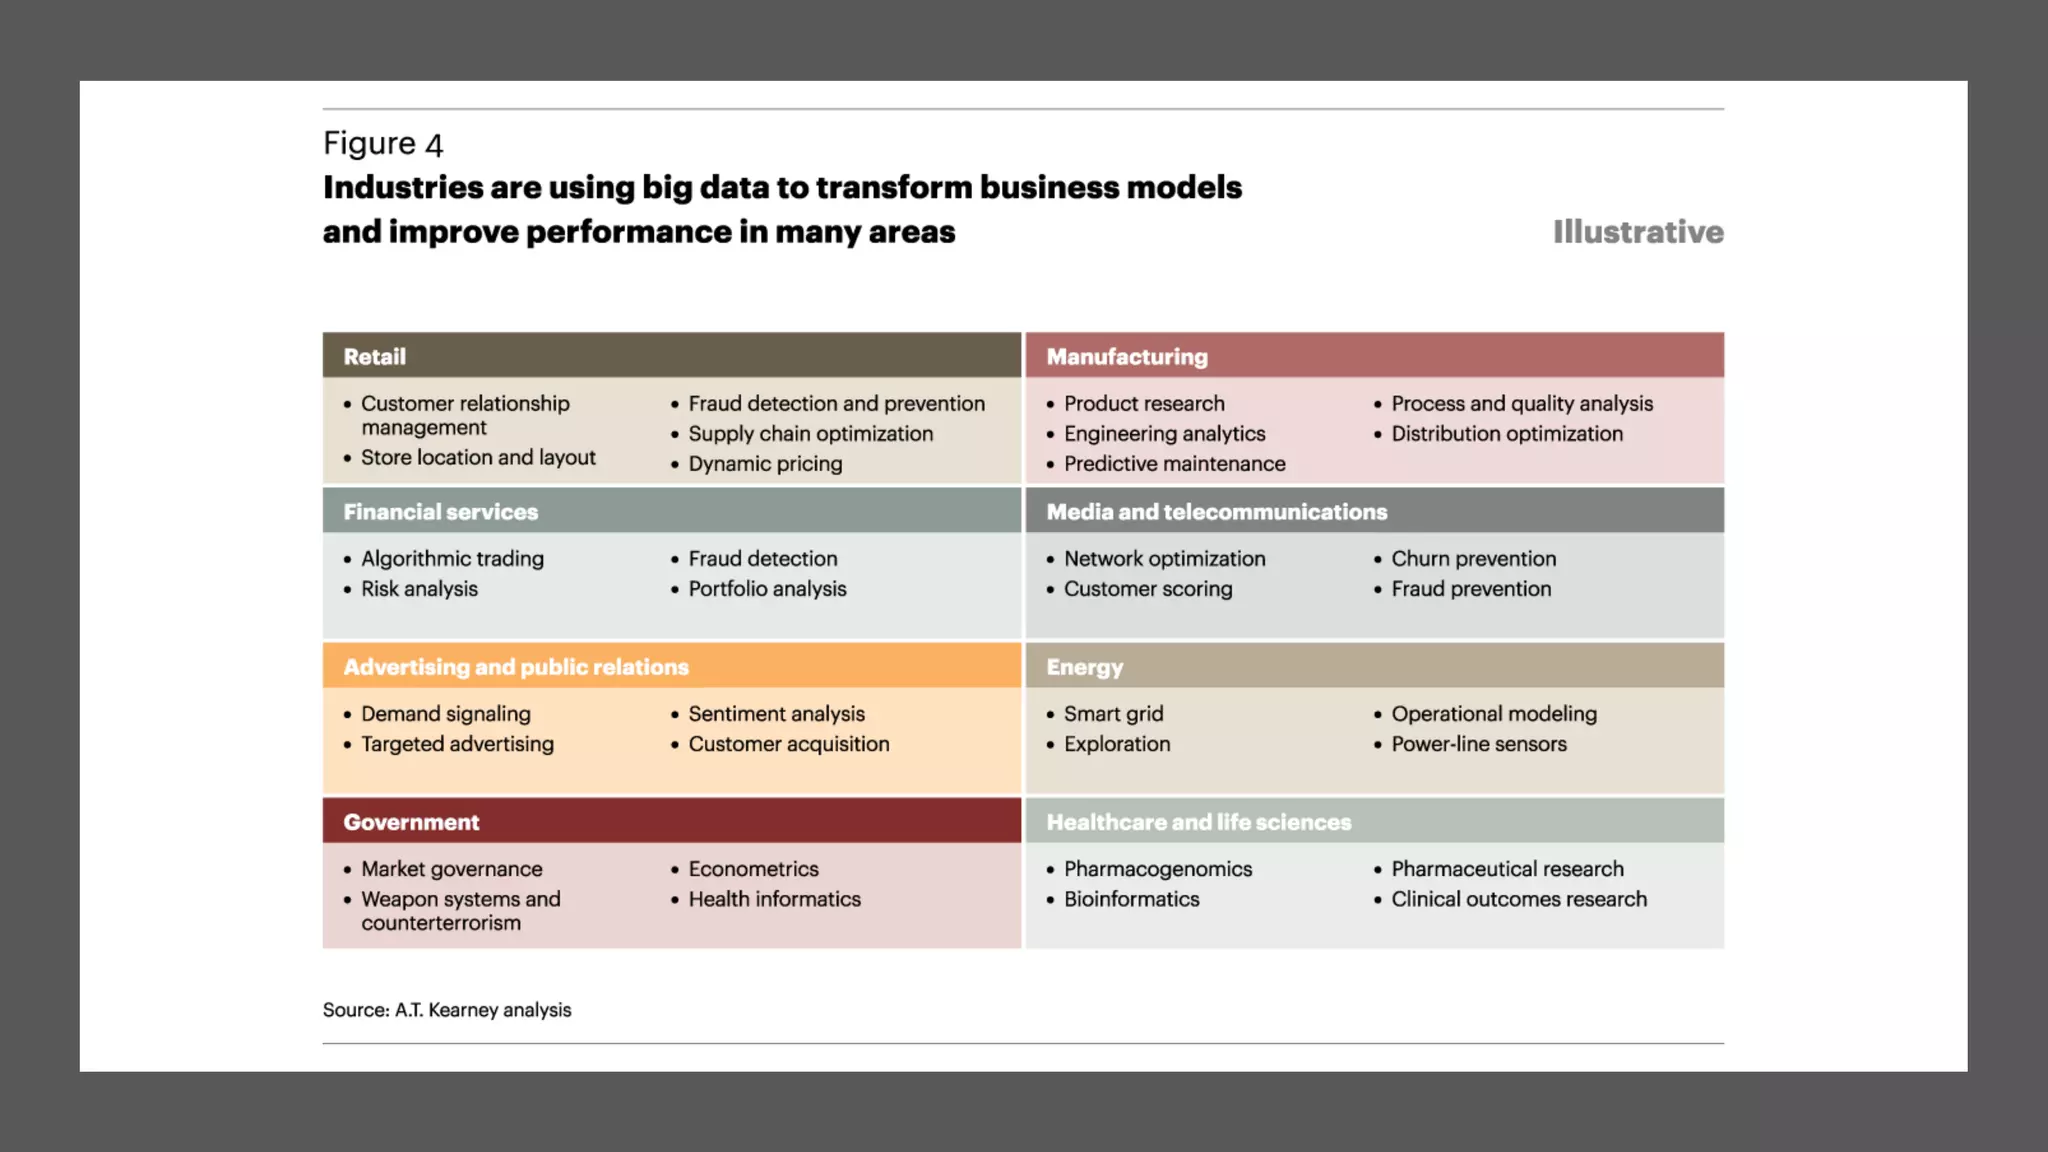
Benefits of Big Data: informed decision making, insights discovery, and case studies on quality improvement and fraud detection.
Benefits of Big Data: informed decision making, insights discovery, and case studies on quality improvement and fraud detection.
Benefits of Big Data: informed decision making, insights discovery, and case studies on quality improvement and fraud detection.
Benefits of Big Data: informed decision making, insights discovery, and case studies on quality improvement and fraud detection.
Wrap-up on how Humanika Consulting leverages data for business improvement in Indonesia.


![[DSC Europe 25] Andy Cotgreave - Nothing is new in analytics.pptx](https://cdn.slidesharecdn.com/ss_thumbnails/mba4vzcurvoh5lfrd5zw-6-251205194645-341bbbbe-thumbnail.jpg?width=640&height=640&fit=bounds)


![[DSC Europe 25] Dragana Ilic - AI for Big Data in Astronomy.pptx](https://cdn.slidesharecdn.com/ss_thumbnails/8palya86qaatvjhva1ms-2-dragana-ilic-ai-ilic-251208151906-652b819c-thumbnail.jpg?width=640&height=640&fit=bounds)


