Downloaded 13 times
![Introduction
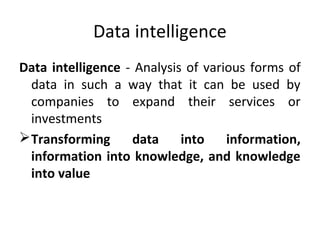
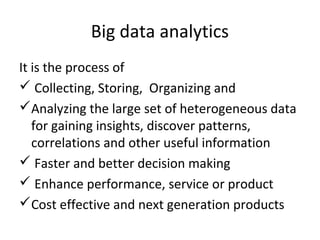
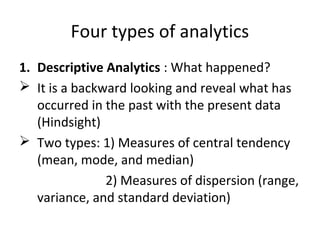
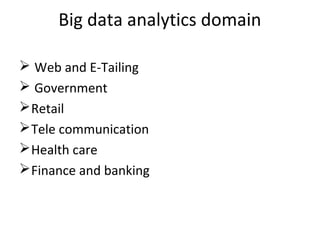
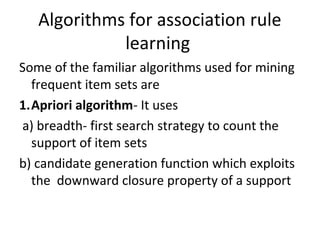
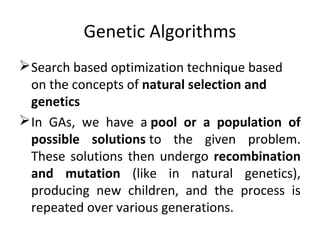
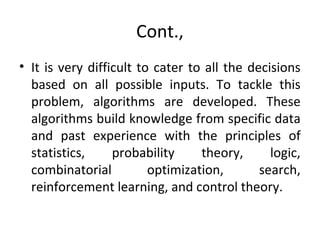
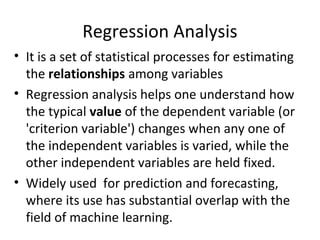
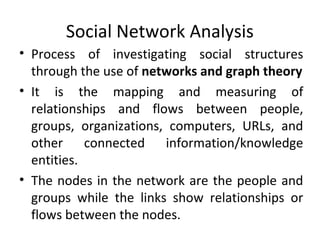
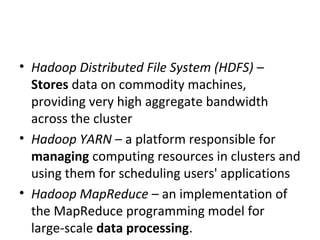
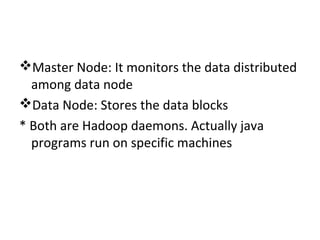
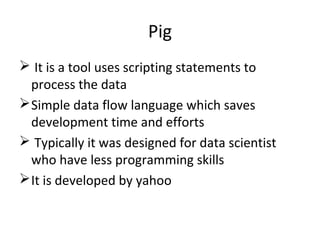
DEFINITION
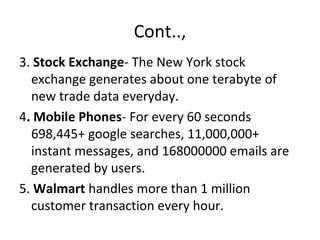
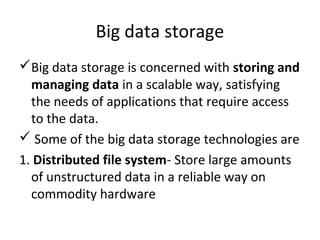
Big data is defined as the collection of large
and complex datasets that are difficult to
process using database system tools or
traditional data processing application
software.
Mainframe
(Kilobytes)
Client /Server
(Megabytes)
The Internet
(Gigabytes)
[Big data]
Mobile, Social
media…
(Zettabytes)](https://image.slidesharecdn.com/bigdata-171123180926/85/Big-data-2-320.jpg)
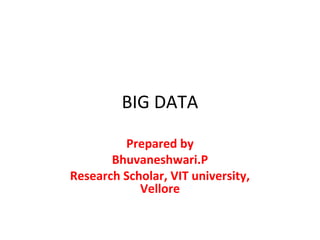
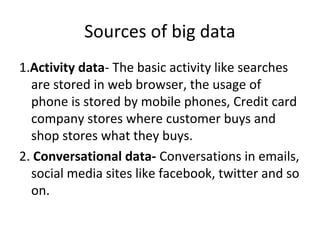
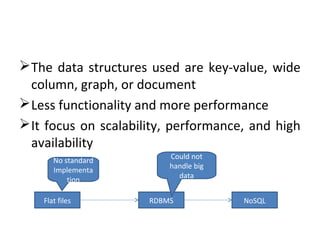
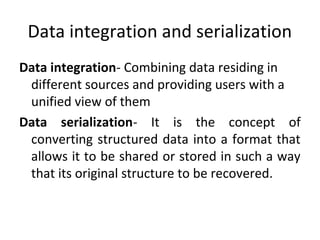
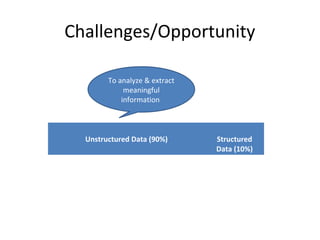
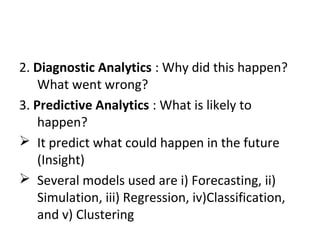
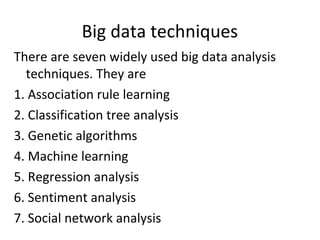
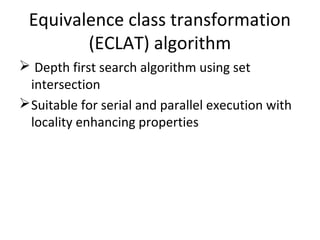
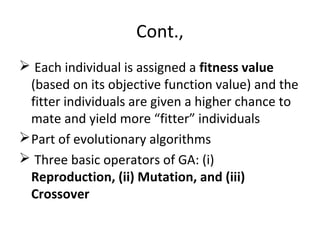
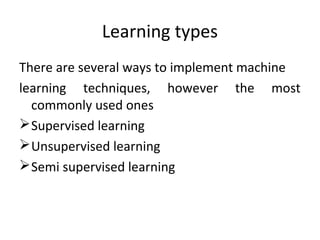
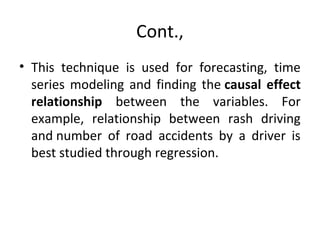
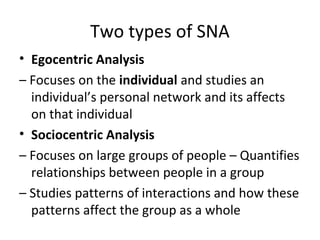
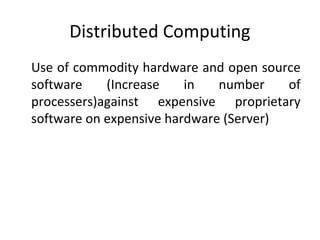
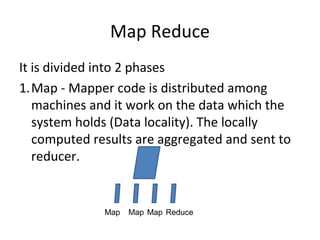
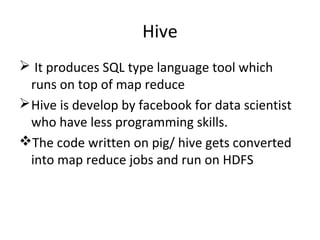
![Characteristics of Big data
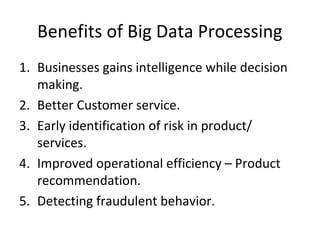
The characteristics of big data is specified with 5V’s:
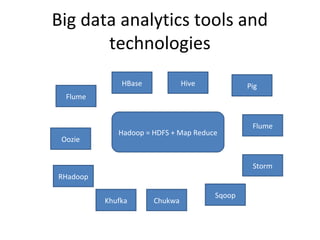
1. Volume – It refers to vast amount of data generated
every second. [Kilo bytes->Mega->Giga->Tera->Petta-
>Exa->Zetta->Yotta]
2. Variety – It refers to the different kinds of data
generated from different sources.
3. Velocity – It refers to the speed of data generation ,
process, and moves around.
4. Value – It refers to bring out the correct meaning out
of available data.
5. Veracity – It refers to the uncertainty and
inconsistencies in the data.](https://image.slidesharecdn.com/bigdata-171123180926/85/Big-data-3-320.jpg)
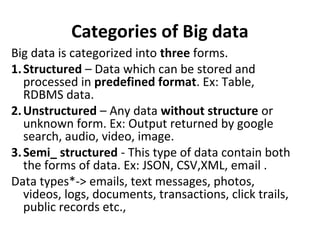
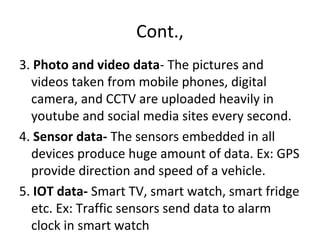

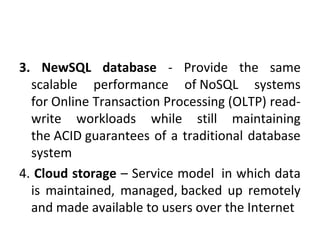
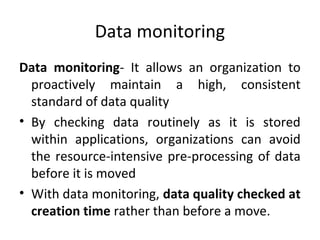
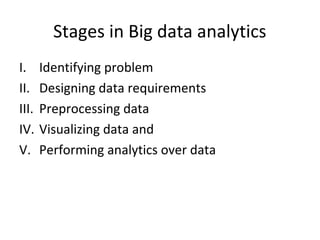
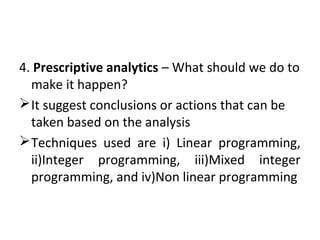
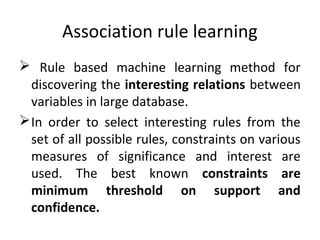
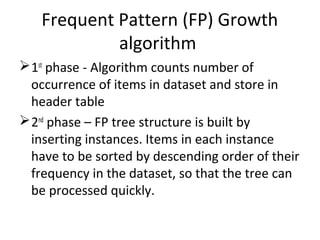
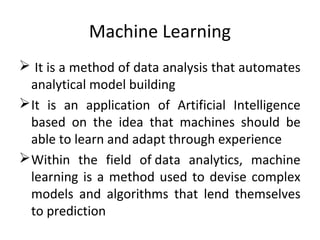
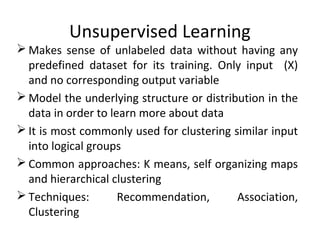
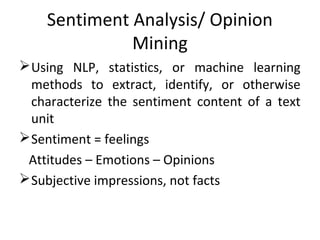
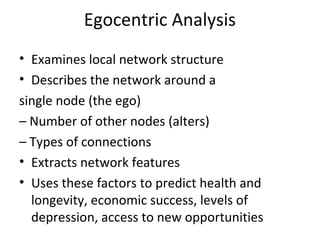
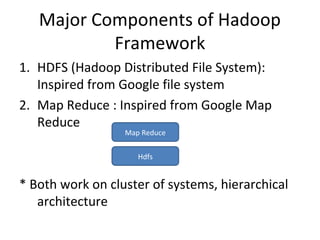
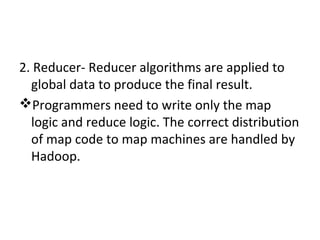
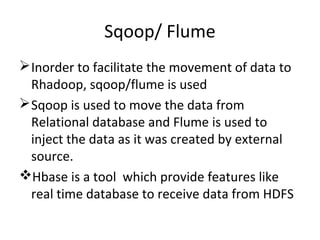
![Supervised learning
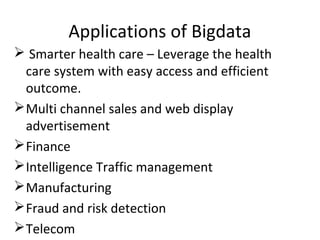
• Deals with learning a function from available training
data. Known input and output variable. Use an
algorithm to learn the mapping function from input
to output [Y=f(X)]
• Analyzes the training data and produces an inferred
function, which can be used for mapping new
examples
• Some supervised learning algorithms are neural
networks, Support Vector Machines (SVMs), and
Naive Bayes Classifiers, Random forest, Decision
Trees, Regression.
• Ex: classifying spam, voice recognization, regression](https://image.slidesharecdn.com/bigdata-171123180926/85/Big-data-45-320.jpg)

This document provides an overview of big data, including its definition, characteristics, categories, sources, storage, analytics, challenges and opportunities. Big data is large and complex datasets that are difficult to process using traditional database management tools. It is characterized by the 5 V's - volume, variety, velocity, value and veracity. Big data comes from both internal and external sources and can be structured, unstructured or semi-structured. It requires specialized storage technologies like Hadoop and NoSQL databases. Analytics on big data uses techniques like machine learning, regression analysis and social network analysis to gain insights. The growth of big data presents both challenges in processing diverse and voluminous data as well as opportunities to generate value.