Download as PDF, PPTX
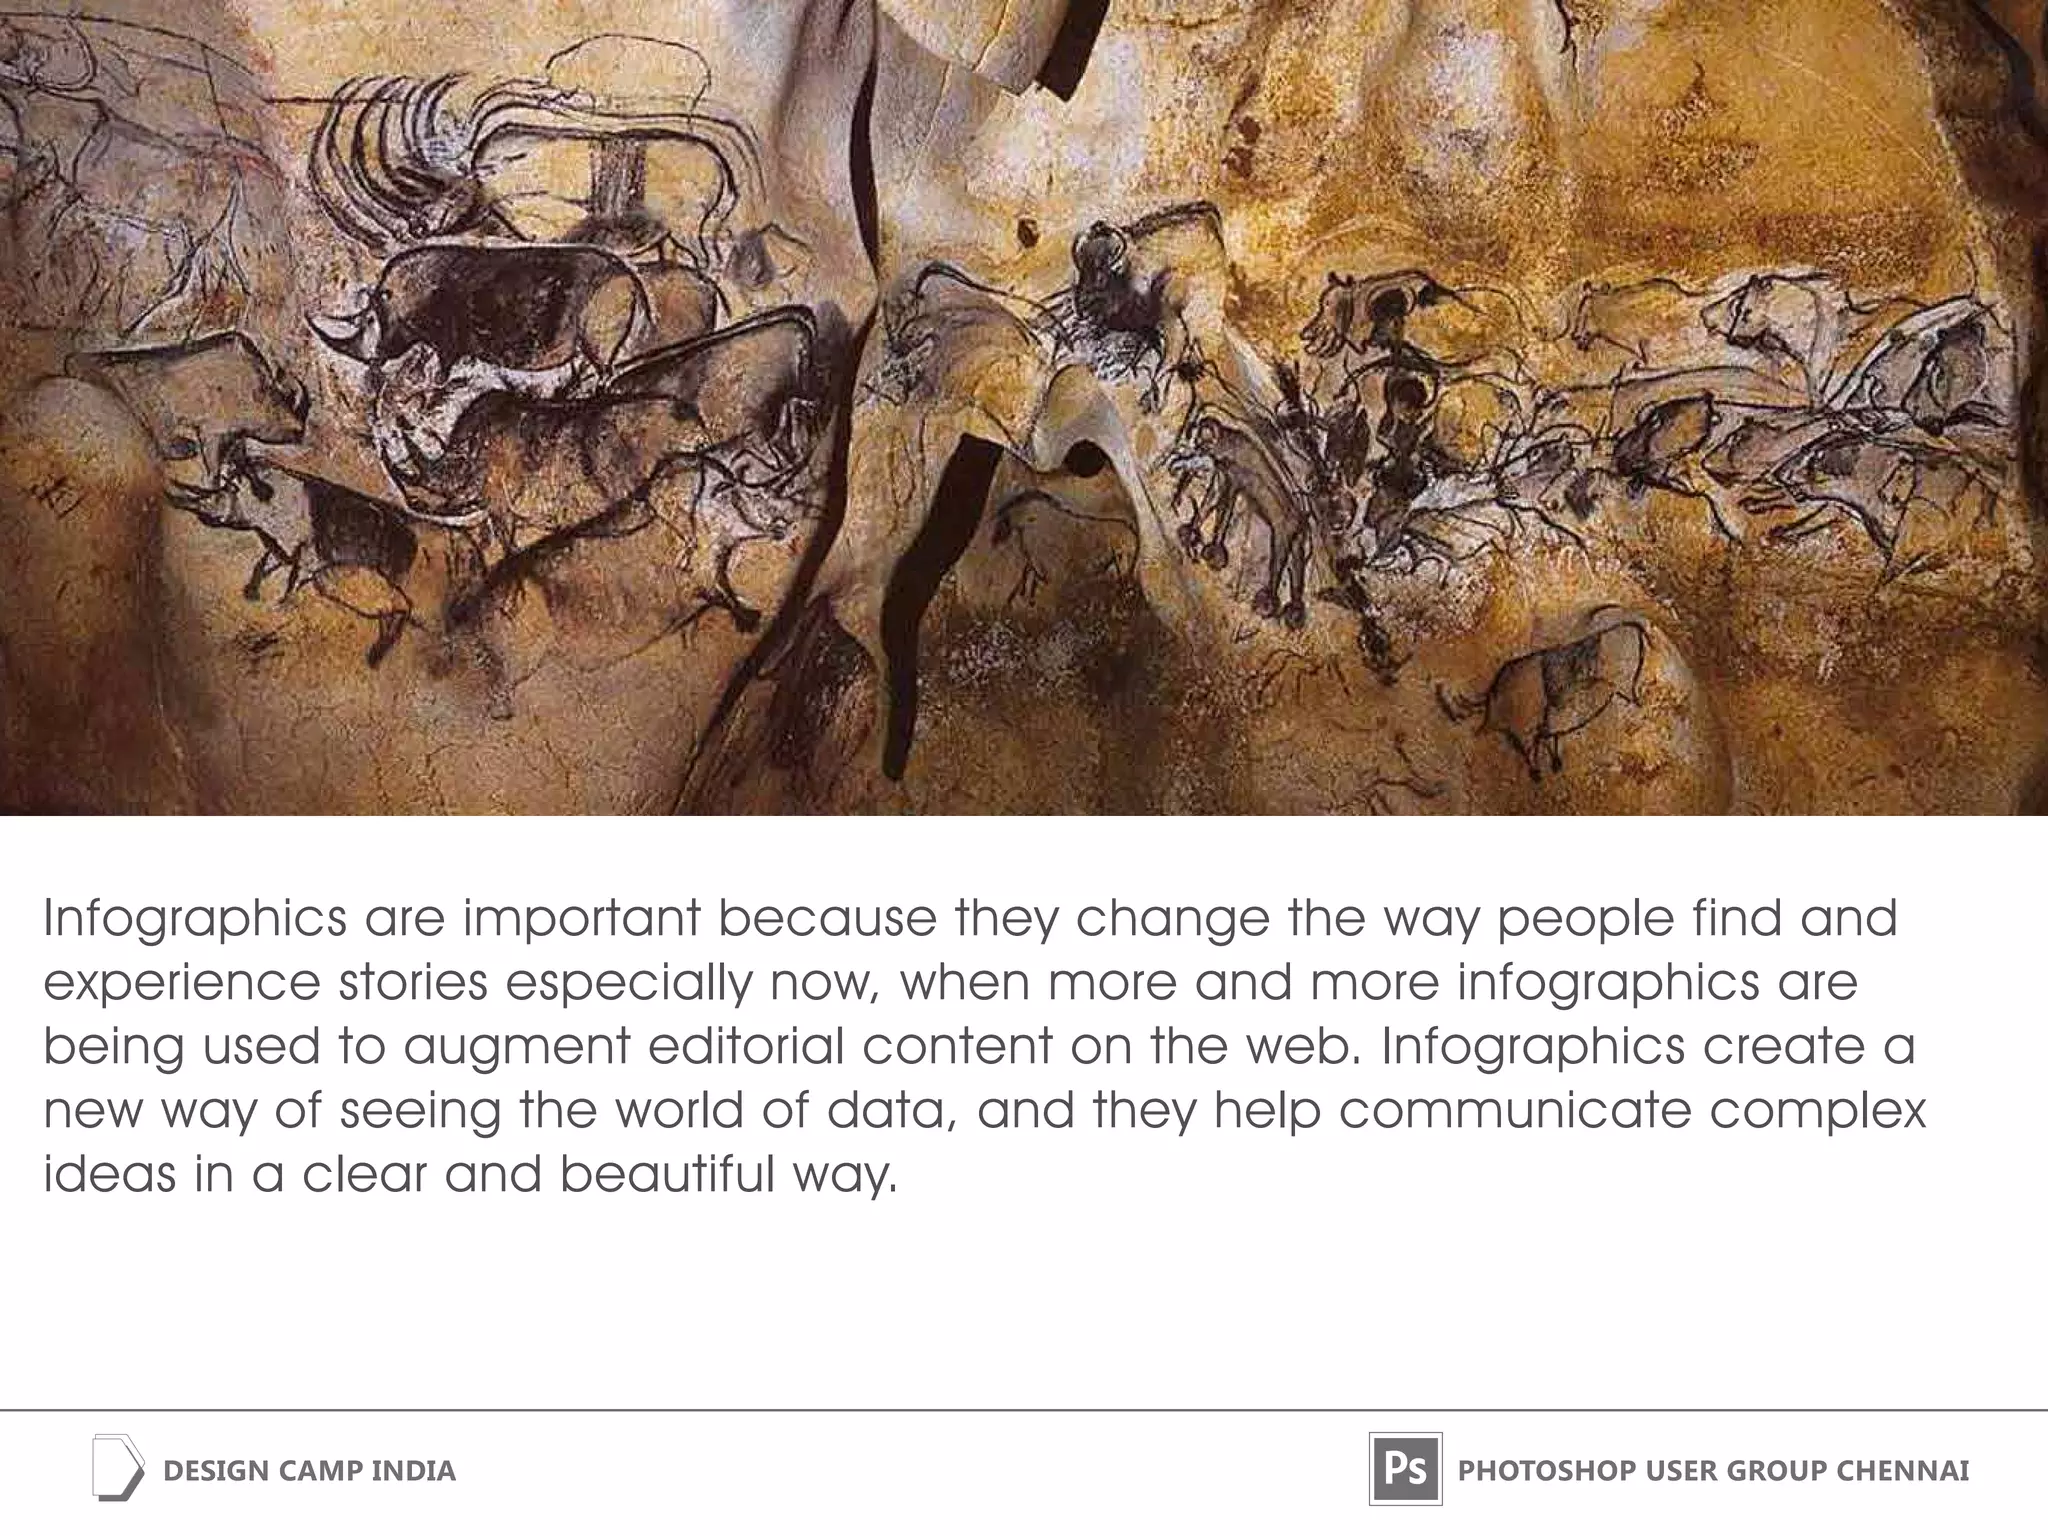
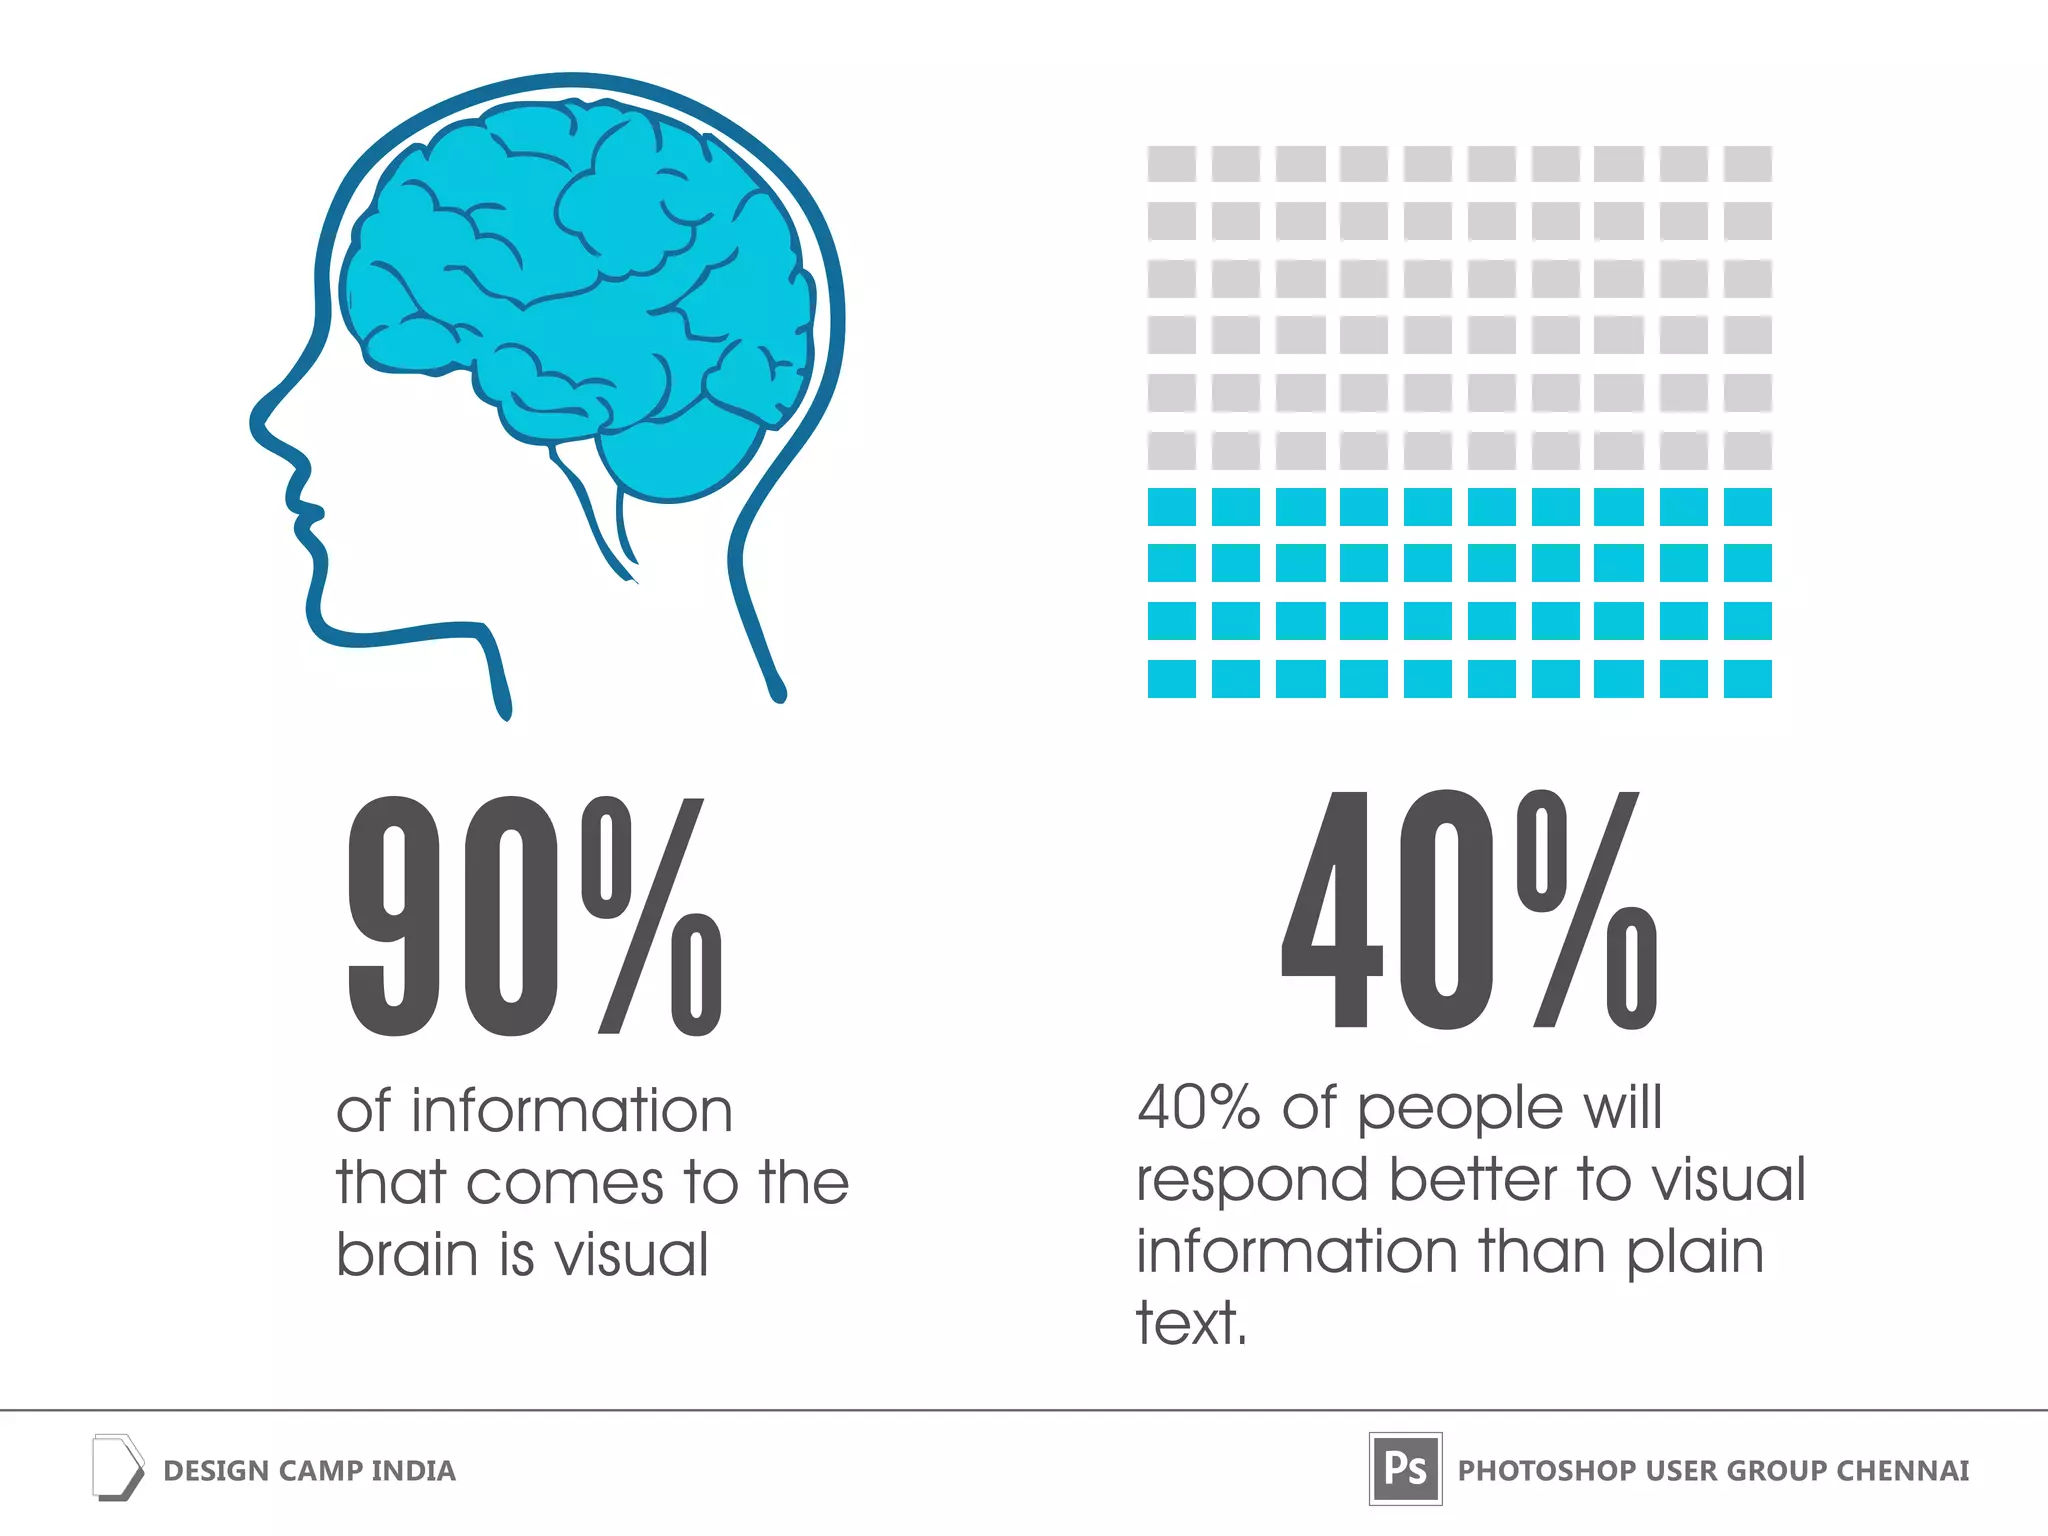


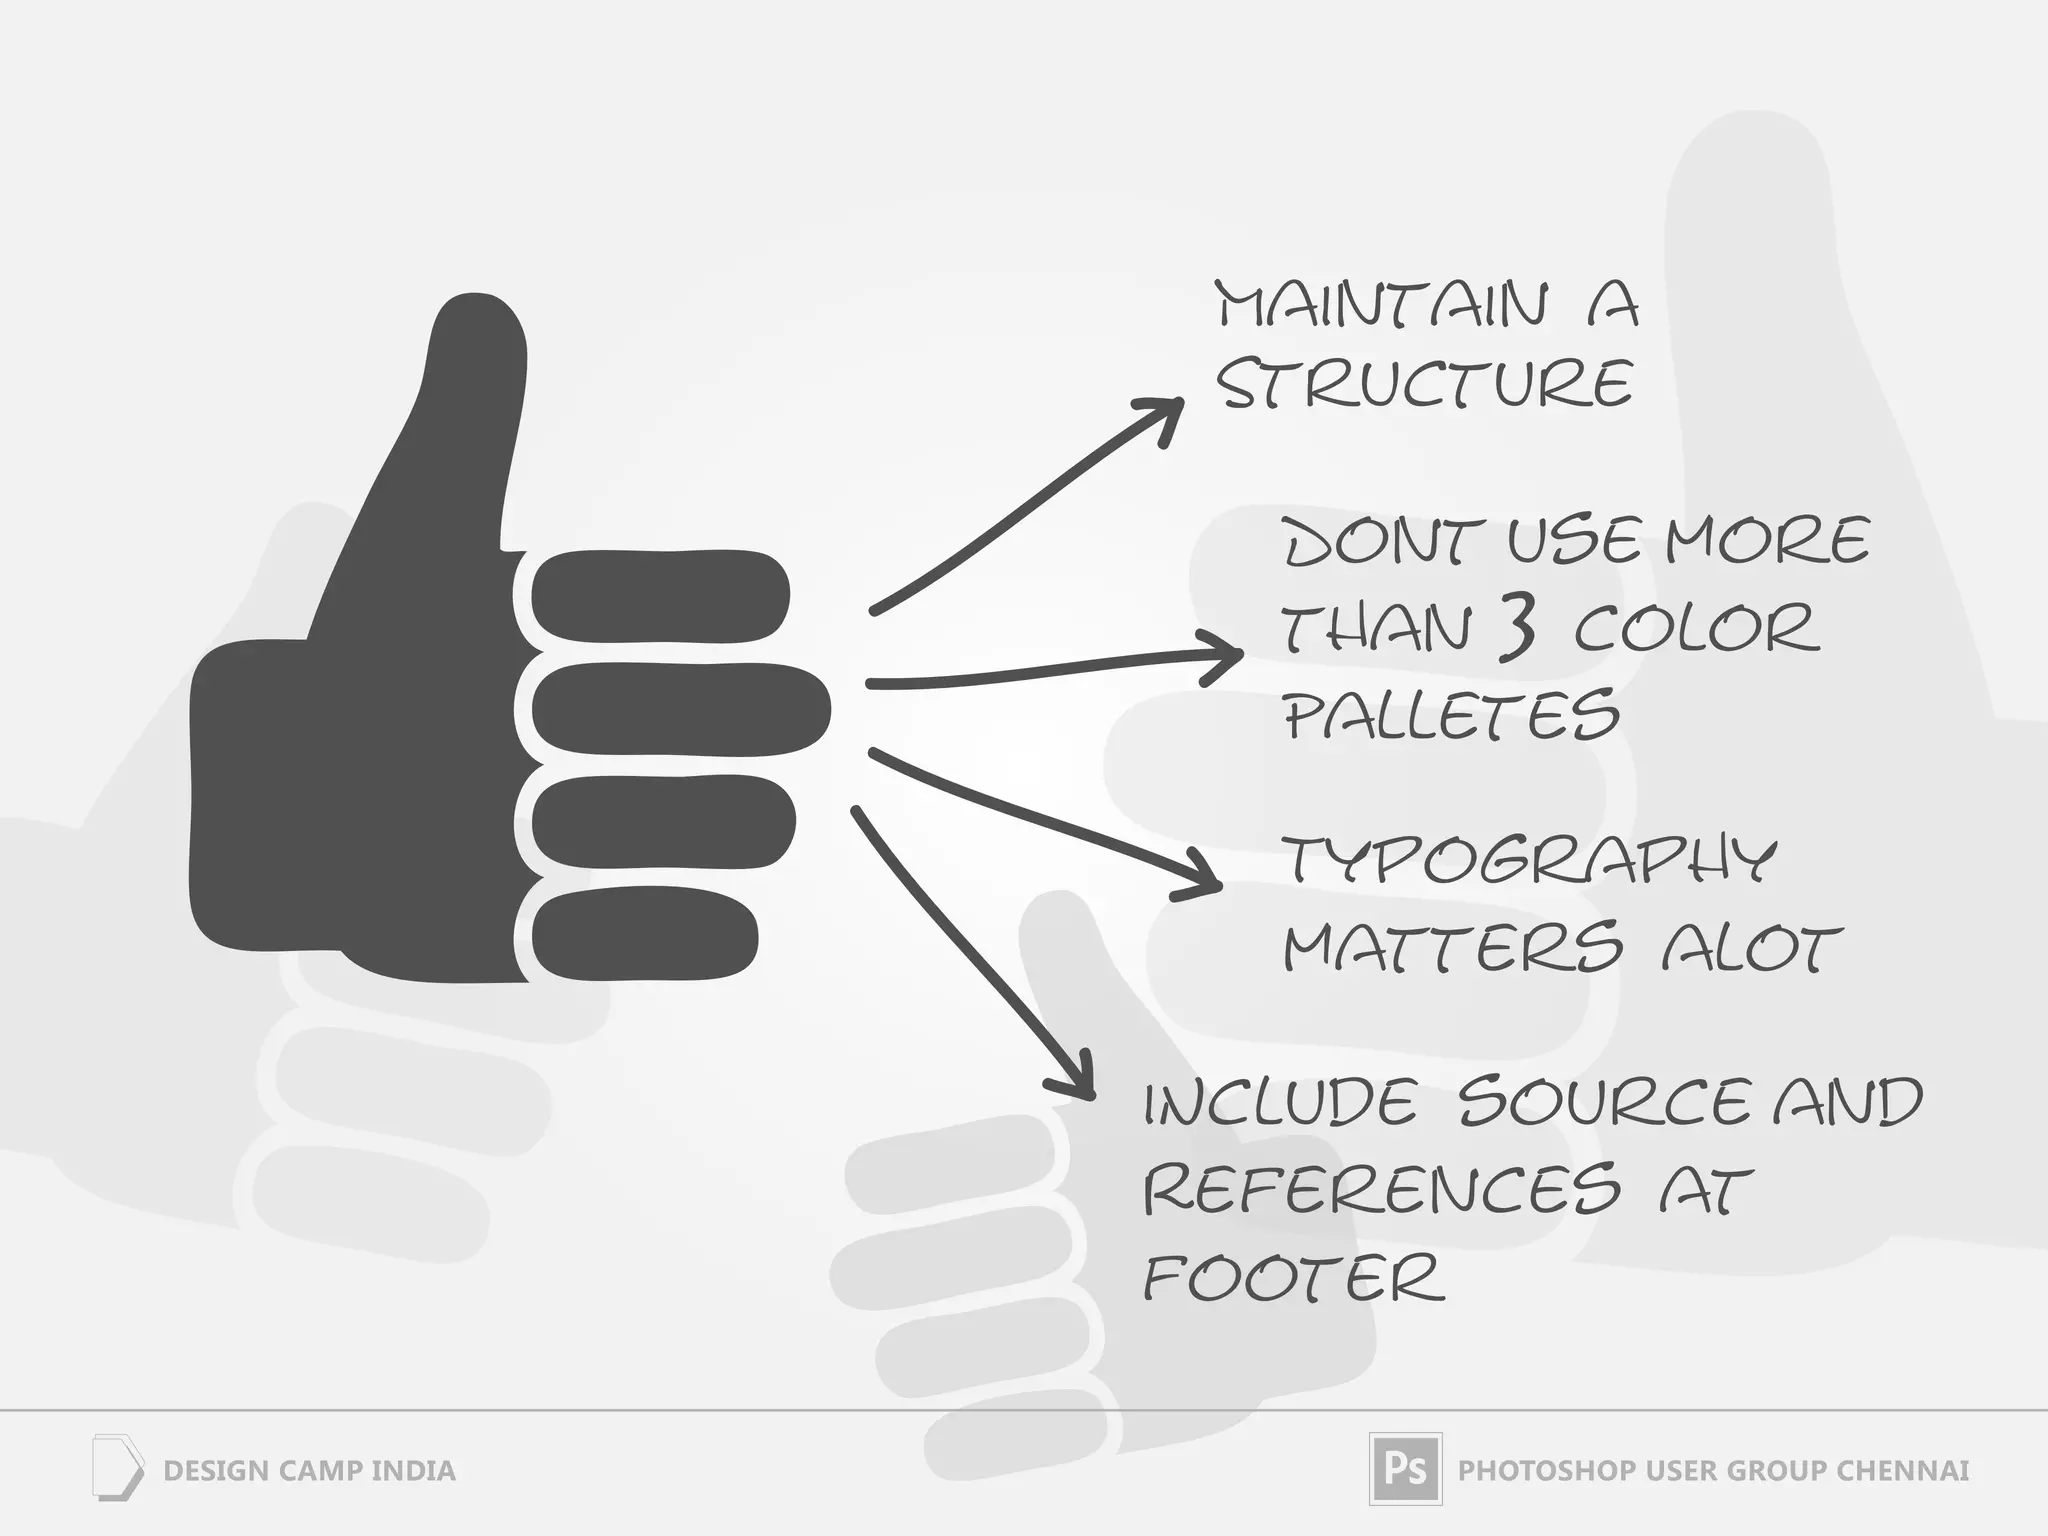


The document discusses infographics, which are visual representations of information that enhance understanding of complex ideas and data. Infographics are becoming increasingly important in digital content as they engage audiences more effectively than text alone. It provides best practices for creating infographics, including maintaining structure and sourcing information.


![[BROCHURE] Italy Tour Project | @SlideON](https://cdn.slidesharecdn.com/ss_thumbnails/brochure8-251215152319-2805af68-thumbnail.jpg?width=640&height=640&fit=bounds)


