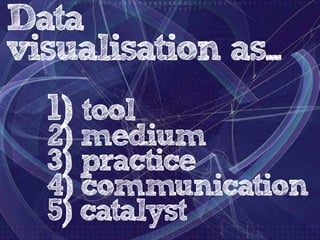
This document provides an overview of information visualization and data visualization. It discusses visualization as a tool, medium, practice, form of communication, and catalyst. It provides examples in each of these categories and discusses principles of good visualization design and the role of design in visualization. Key topics covered include visualization techniques, interactive visualization, public visualization projects, and evaluation studies on the impact of visualization.
Engines of Order. Social Media and the Rise of Algorithmic Knowing.Bernhard Rieder
Talk given at the Social Media and the Transformation of Public Space Conference on June 19 at the University of Amsterdam. References and comments are in the notes section.
Authors:
Tracey P. Lauriault, Programmable City Project, Maynooth University
Peter Mooney, Environmental Protection Agency Ireland and Department of Computer Science Maynooth University
Title:
Crowdsourcing: A Geographic Approach to Identifying Policy Opportunities and Challenges Toward Deeper Levels of Public Engagement
Presented:
The Internet, Policy and Politics Conference, Oxford Internet Institute, University of Oxford, September 25-26, 2014
See the abstract here:
http://ipp.oii.ox.ac.uk/2014/programme-2014/track-c-politics-of-engagement/community/tracey-p-lauriault-peter-mooney
In my day to day role I often need to create a graph, chart or table to simplify what can sometimes be a lot of data into a salient point or two. Here are 10 free data visualizations tools; some provide the metrics, whilst the others highlight relationships between the data, as well as displaying the information in a visual, understandable and digestible way. You may find them useful for that pitch, presentation or assignment.
Data Visualization Strategies & Open Source ToolsPhase2
Presentation for RefreshDC providing an overview of data visualization strategies and a variety of open source tools to accomplish your goals. The event was made possible by AARP and LivingSocial.
Smart Data for Behavioural Change: Towards Energy Efficient BuildingsAnna Fensel
“The Semantic Web is not a separate Web but an extension of the current one, in which information is given well-defined meaning, better enabling computers and people to work in cooperation.” - this statement of Tim Berners-Lee has gained even more relevance since the start of this century.
The humanity is rapidly developing and persistently experiencing local and global challenges, such as global warming/climate change, dis-balances in demand and supply, among many others. Mastering most (if not all) of them require a behavior change. Behavioral change is difficult to achieve per se, and it is important that technology – as a major enabler - has a positive rather than a negative impact here.
Further, the dramatic growth of data volumes (Big Data, Internet of Things) and the data’s increased power and impact and on the people's daily lives are calling for new types, practices and policies of behavior with data.
These factors made the role of semantic technology even more crucial: in terms of providing a well-defined meaning, and eventually delivering Smart Data for a functional and fair data value chain.
Addressing the behavioural change with Smart Data, I discuss potential ICT solutions investigating the domain of energy efficient buildings. Particularly, our completed OpenFridge experiment will be presented: design and development of the Internet of Things data system with semantic and data analytics enablers for building new services on a top of typical home appliance data — in particular, refrigerators. The system has been evaluated with real life end-user pilots.
In conclusions, I overview our related ongoing work, namely, in the areas of the impact of Big Data on society and related research roadmapping (linking to sociology), personalized energy efficiency data management services in buildings (linking to psychology), and semantic data licensing (linking to law).
SC6 Workshop 1: What can big data do for you? BigData_Europe
Presentation by Sören Auer, Fraunhofer IAIS, Coordinator of Big Data Europe, at the first workshop of Societal Challlenge 6 in the BigDataEurope project, taking place in Luxembourg on 18 November 2015.
http://www.big-data-europe.eu/social-sciences/
It my pleasure to be with you all today – thanks to my host for the opportunity to speak with you all today.
Host: Leonard Walletzky <qwalletz@fi.muni.cz> (https://www.linkedin.com/in/leonardwalletzky/) +420 549 49 7690
Google Scholar: https://scholar.google.com/citations?user=aUvbsmwAAAAJ&hl=cs
Katrina Motkova (https://www.linkedin.com/in/kateřina-moťková-mba-a964a3175/en/?originalSubdomain=cz)
Speaker: Jim Spohrer <spohrer@gmail.com> (https://www.linkedin.com/in/spohrer/) +1-408-829-3112
I am Jim Spohrer, a retired Apple and IBM Executive, and currently a UIDP Senior Fellow, on the Board of Directors of ISSIP and ServCollab.
I am retired, meaning my primary activities are family-oriented – families are the oldest and most important type of service systems
I volunteer to help non-profits, mentor students, professionals, and retiree (some in retirement communities where the average age is 85) on AI & service science
My hobbies are hiking, reading, programming, and building my AI digital twin and humanoid robots for maintaining farms and farming equipment.
My hobbies are also trying to understand as much as I can about the system called the universe and mult-verse, and robots to rapidly rebuild civilization including themselves from scratch.
2001 - Nonzero: The Logic of Human Desitiny (Wright) - https://en.wikipedia.org/wiki/Nonzero:_The_Logic_of_Human_Destiny
2015 - Geek Heresy: Rescuing Social Change from the Cult of Technology - https://www.amazon.com/Geek-Heresy-Rescuing-Social-Technology/dp/161039528X
2021 - Humankind: A Hopeful History (Bregman) - https://en.wikipedia.org/wiki/Humankind:_A_Hopeful_History
Humankind - https://www.amazon.com/Humankind-Hopeful-History-Rutger-Bregman/dp/0316418536
Humankind Book Review - https://service-science.info/archives/5654
2022 - Service in the AI Era: Science, Logic, and Architecture Perspectives (2022) by Spohrer, Maglio, Vargo, Warg - https://www.amazon.com/Service-AI-Era-Architecture-Perspectives/dp/1637423039
2023 - Design for a Better World: Meaningful, Sustainable, Humanity-Centered (2023) by Don Norman - https://www.amazon.com/Design-Better-World-Meaningful-Sustainable/dp/0262047950/
Emerging Dynamic TUW-ASE Summer 2015 - Distributed Systems and Challenges for...Hong-Linh Truong
This is a lecture from the advanced service engineering course from the Vienna University of Technology. See http://dsg.tuwien.ac.at/teaching/courses/ase/
Putting the L in front: from Open Data to Linked Open DataMartin Kaltenböck
Keynote presentation of Martin Kaltenböck (LOD2 project, Semantic Web Company) at the Government Linked Data Workshop in the course of the OGD Camp 2011 in Warsaw, Poland: Putting the L in front: from Open Data to Linked Open Data
Data visualization trends in Business Intelligence: Allison Sapka at Analytic...Fitzgerald Analytics, Inc.
Allison Sapka's presentation at the Analytics and Data in Financial Services Meetup in Dec 2012. Alison discusses trends in Data Visualization, including why visualization is so powerful when implemented well, and confusing or misleading when done badly
Data Science in 2016: Moving up by Paco Nathan at Big Data Spain 2015Big Data Spain
The term 'Data Science' was first described in scientific literature about 15 years ago. It started to become a major trend in industry about 7 years ago.
O'Reilly Media surveys the industry extensively each year. In addition we get a good birds-eye view of industry trends through our conference programs and publications, working closely with some of the best practitioners in Data Science.
By now, the field has evolved far beyond its origins eclipsing an earlier generation of Business Intelligence and Data Warehousing approaches. Data Science is moving up, into the business verticals and government spheres of influence where it has true global impact.
This talk considers Data Science trends from the past three years in particular. What is emerging? Which parts are evolving? Which seem cluttered and poised for consolidation or other change?
Session presented at Big Data Spain 2015 Conference
15th Oct 2015
Kinépolis Madrid
http://www.bigdataspain.org
Event promoted by: http://www.paradigmatecnologico.com
Abstract: http://www.bigdataspain.org/program/thu/slot-2.html
The presentation was given at the SOCM'16 workshop at the WWW16 conference. It corresponds to the research study titled "Observlets: Empowering Analytical Observations on Web Observatory".
7 Alternatives to Bullet Points in PowerPointAlvis Oh
So you tried all the ways to beautify your bullet points on your pitch deck but it just got way uglier. These points are supposed to be memorable and leave a lasting impression on your audience. With these tips, you'll no longer have to spend so much time thinking how you should present your pointers.
White wonder, Work developed by Eva TschoppMansi Shah
White Wonder by Eva Tschopp
A tale about our culture around the use of fertilizers and pesticides visiting small farms around Ahmedabad in Matar and Shilaj.
Book Formatting: Quality Control Checks for DesignersConfidence Ago
This presentation was made to help designers who work in publishing houses or format books for printing ensure quality.
Quality control is vital to every industry. This is why every department in a company need create a method they use in ensuring quality. This, perhaps, will not only improve the quality of products and bring errors to the barest minimum, but take it to a near perfect finish.
It is beyond a moot point that a good book will somewhat be judged by its cover, but the content of the book remains king. No matter how beautiful the cover, if the quality of writing or presentation is off, that will be a reason for readers not to come back to the book or recommend it.
So, this presentation points designers to some important things that may be missed by an editor that they could eventually discover and call the attention of the editor.
You could be a professional graphic designer and still make mistakes. There is always the possibility of human error. On the other hand if you’re not a designer, the chances of making some common graphic design mistakes are even higher. Because you don’t know what you don’t know. That’s where this blog comes in. To make your job easier and help you create better designs, we have put together a list of common graphic design mistakes that you need to avoid.
Transforming Brand Perception and Boosting Profitabilityaaryangarg12
In today's digital era, the dynamics of brand perception, consumer behavior, and profitability have been profoundly reshaped by the synergy of branding, social media, and website design. This research paper investigates the transformative power of these elements in influencing how individuals perceive brands and products and how this transformation can be harnessed to drive sales and profitability for businesses.
Through an exploration of brand psychology and consumer behavior, this study sheds light on the intricate ways in which effective branding strategies, strategic social media engagement, and user-centric website design contribute to altering consumers' perceptions. We delve into the principles that underlie successful brand transformations, examining how visual identity, messaging, and storytelling can captivate and resonate with target audiences.
Methodologically, this research employs a comprehensive approach, combining qualitative and quantitative analyses. Real-world case studies illustrate the impact of branding, social media campaigns, and website redesigns on consumer perception, sales figures, and profitability. We assess the various metrics, including brand awareness, customer engagement, conversion rates, and revenue growth, to measure the effectiveness of these strategies.
The results underscore the pivotal role of cohesive branding, social media influence, and website usability in shaping positive brand perceptions, influencing consumer decisions, and ultimately bolstering sales and profitability. This paper provides actionable insights and strategic recommendations for businesses seeking to leverage branding, social media, and website design as potent tools to enhance their market position and financial success.
Between Filth and Fortune- Urban Cattle Foraging Realities by Devi S Nair, An...Mansi Shah
This study examines cattle rearing in urban and rural settings, focusing on milk production and consumption. By exploring a case in Ahmedabad, it highlights the challenges and processes in dairy farming across different environments, emphasising the need for sustainable practices and the essential role of milk in daily consumption.
Information Visualization: Analyzing and Presenting Data
1. Information
Visualization:
Analyzing and
Presenting
Data.
a/prof. Andrew Vande Moere
Research[x]Design (RxD)
Department of Architecture - KU Leuven
http://rxd.asro.kuleuven.be
Data visualisation lab leuven
http://datavislab.org
Information Aesthetics
http://infosthetics.com - @infosthetics
12. Ability to collect data is increasing faster than our ability to analyze it
http://www.popsci.com/technology/article/2011-05/every-six-hours-nsa-gathers-much-data-stored-entire-library-congress
13. open data
“VLAAMSE OVERHEID KIEST VOOR OPEN DATA” - 2012 - http://www.bestuurszaken.be/vlaamse-overheid-kiest-voor-open-data
33. 1. Show comparisons, contrasts, differences
2. Show causality, mechanism, explanation, systematic
structure
3. Show multivariate data, i.e. more than 1 or 2 variables
4. Completely integrate words, numbers, images,
diagrams
5. Thoroughly describe the evidence: title, authors and
sponsors, data sources, add measurement scales,
highlight relevant issues
6. Analytical presentations ultimately stand or fall
depending on the quality, relevance and integrity of
their content
DATA VisualisatiON good practice guidelines
Principles for the Analysis and Presentation of Data - edward Tufte
60. 2. interaction: fluid selection
Baby Name Wizard - http://www.babynamewizard.com/voyager
61. 2. interaction: animation
the jobless rate for people like you - nytimes - http://www.nytimes.com/interactive/2009/11/06/business/economy/unemployme
62. 3. Interactie: sharing responsibility
Budget Puzzle: You Fix the Budget - NYTimes - http://www.nytimes.com/interactive/2010/11/13/weekinreview/deficits-graphic.html
63. 3. communication of meaning
UK Casualties in Afghanistan and Iraq - BBC News - 2009 - http://www.bbc.co.uk/news/uk-10634102
64. 3. communication of meaning
faces of the death - nytimes - http://www.nytimes.com/interactive/us/faces-of-the-dead.html
89. Average change
Public & Private Display - 2.5%
Private Display Only
- 1%
- 0.5%
No Display
neighborhood scoreboards
“Comparative Feedback in the Street: Exposing Residential Energy Consumption on House Façades”, 2011.
101. Design guidelines
“Design Study Methodology: Reflections from the Trenches and the Stacks”
Michael Sedlmair, Miriah Meyer, Tamara Munzner, IEEE Infovis 2012
102. . maak verschil tussen exploratie en communicatie
. betracht sociale relevantie van data
. verken praktijk, onderzoek en kunsten
. ken cognitieve en good-practice guidelines
. integreer schoonheid, interactie en betekenis
conclusion
Symbiosis of design and visualization