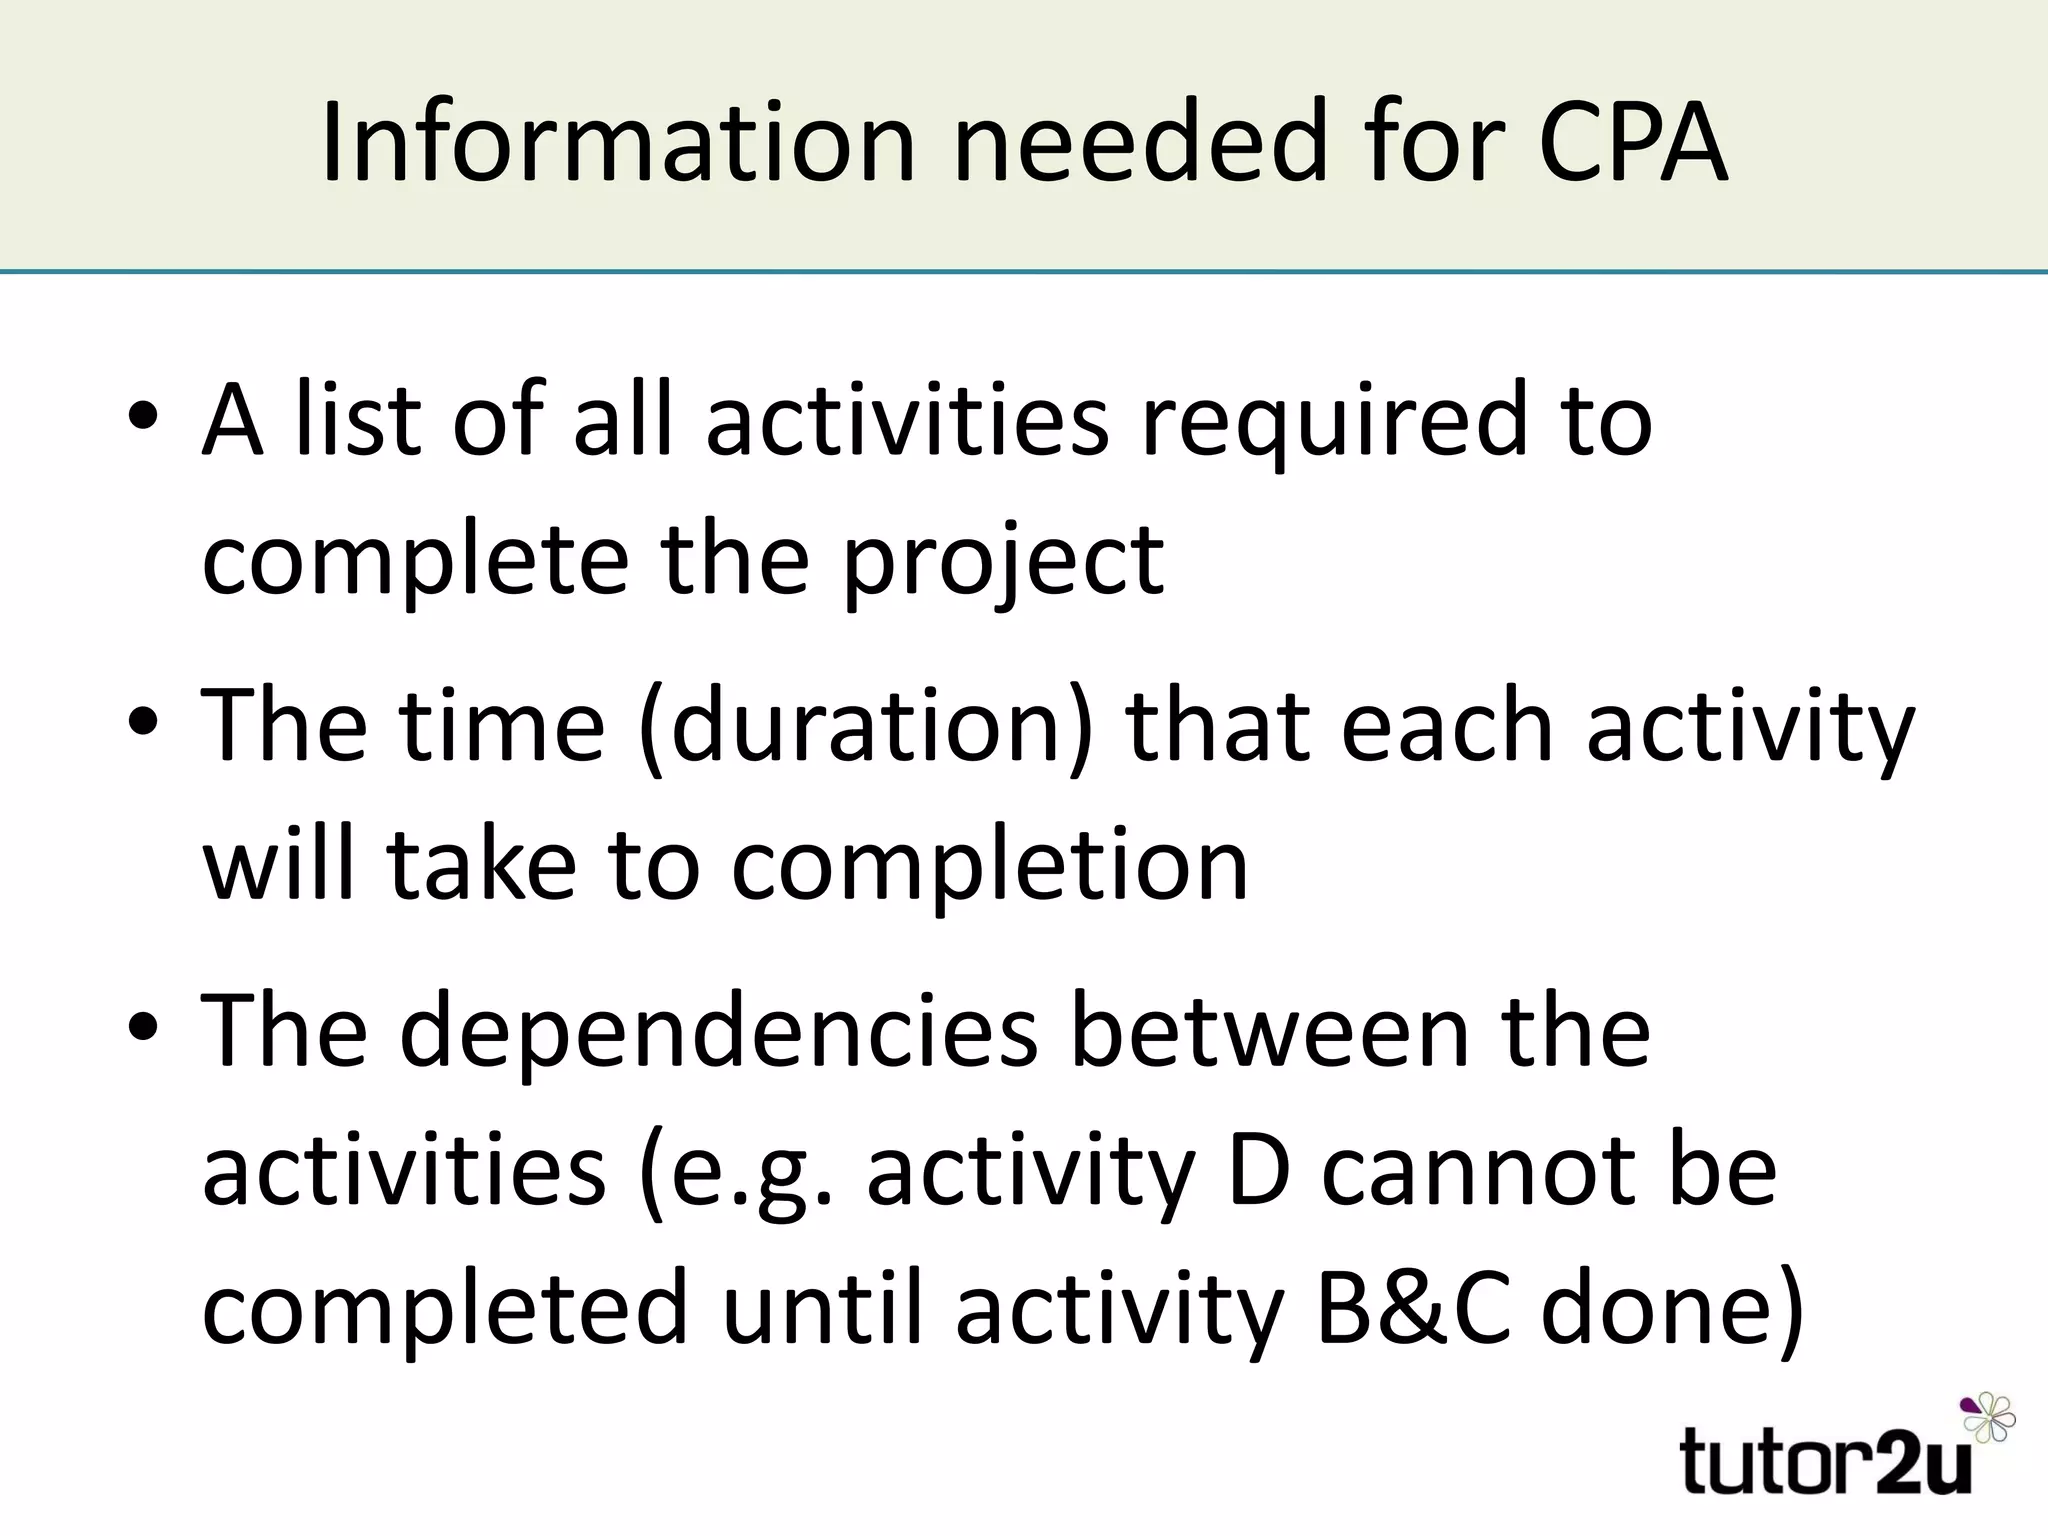
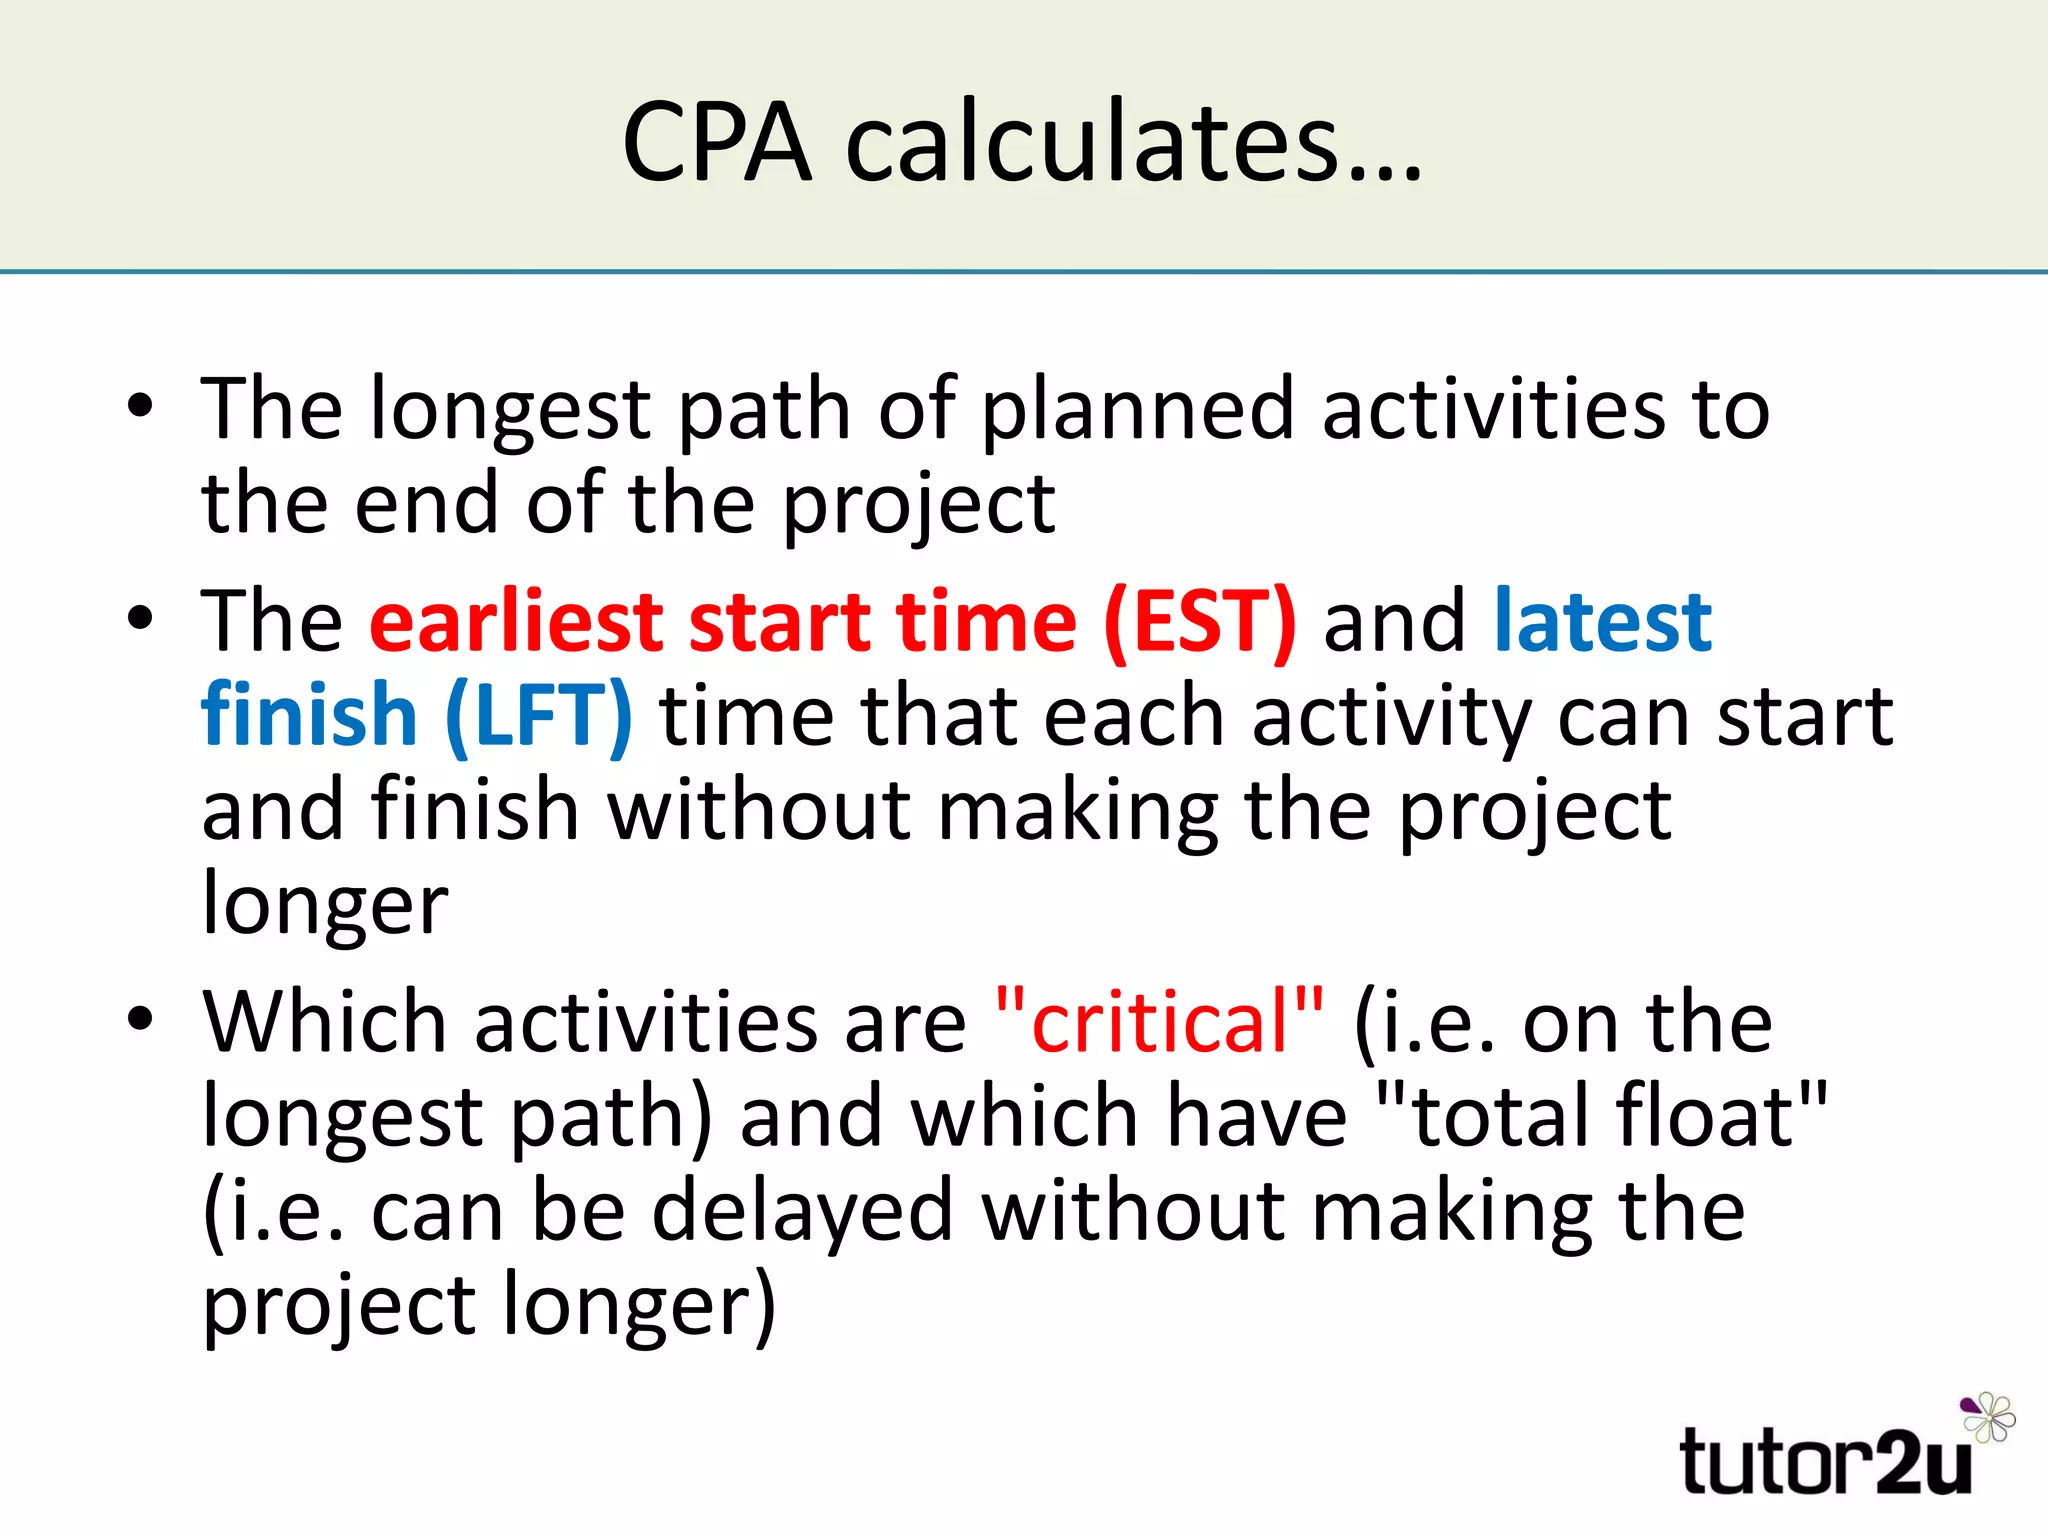
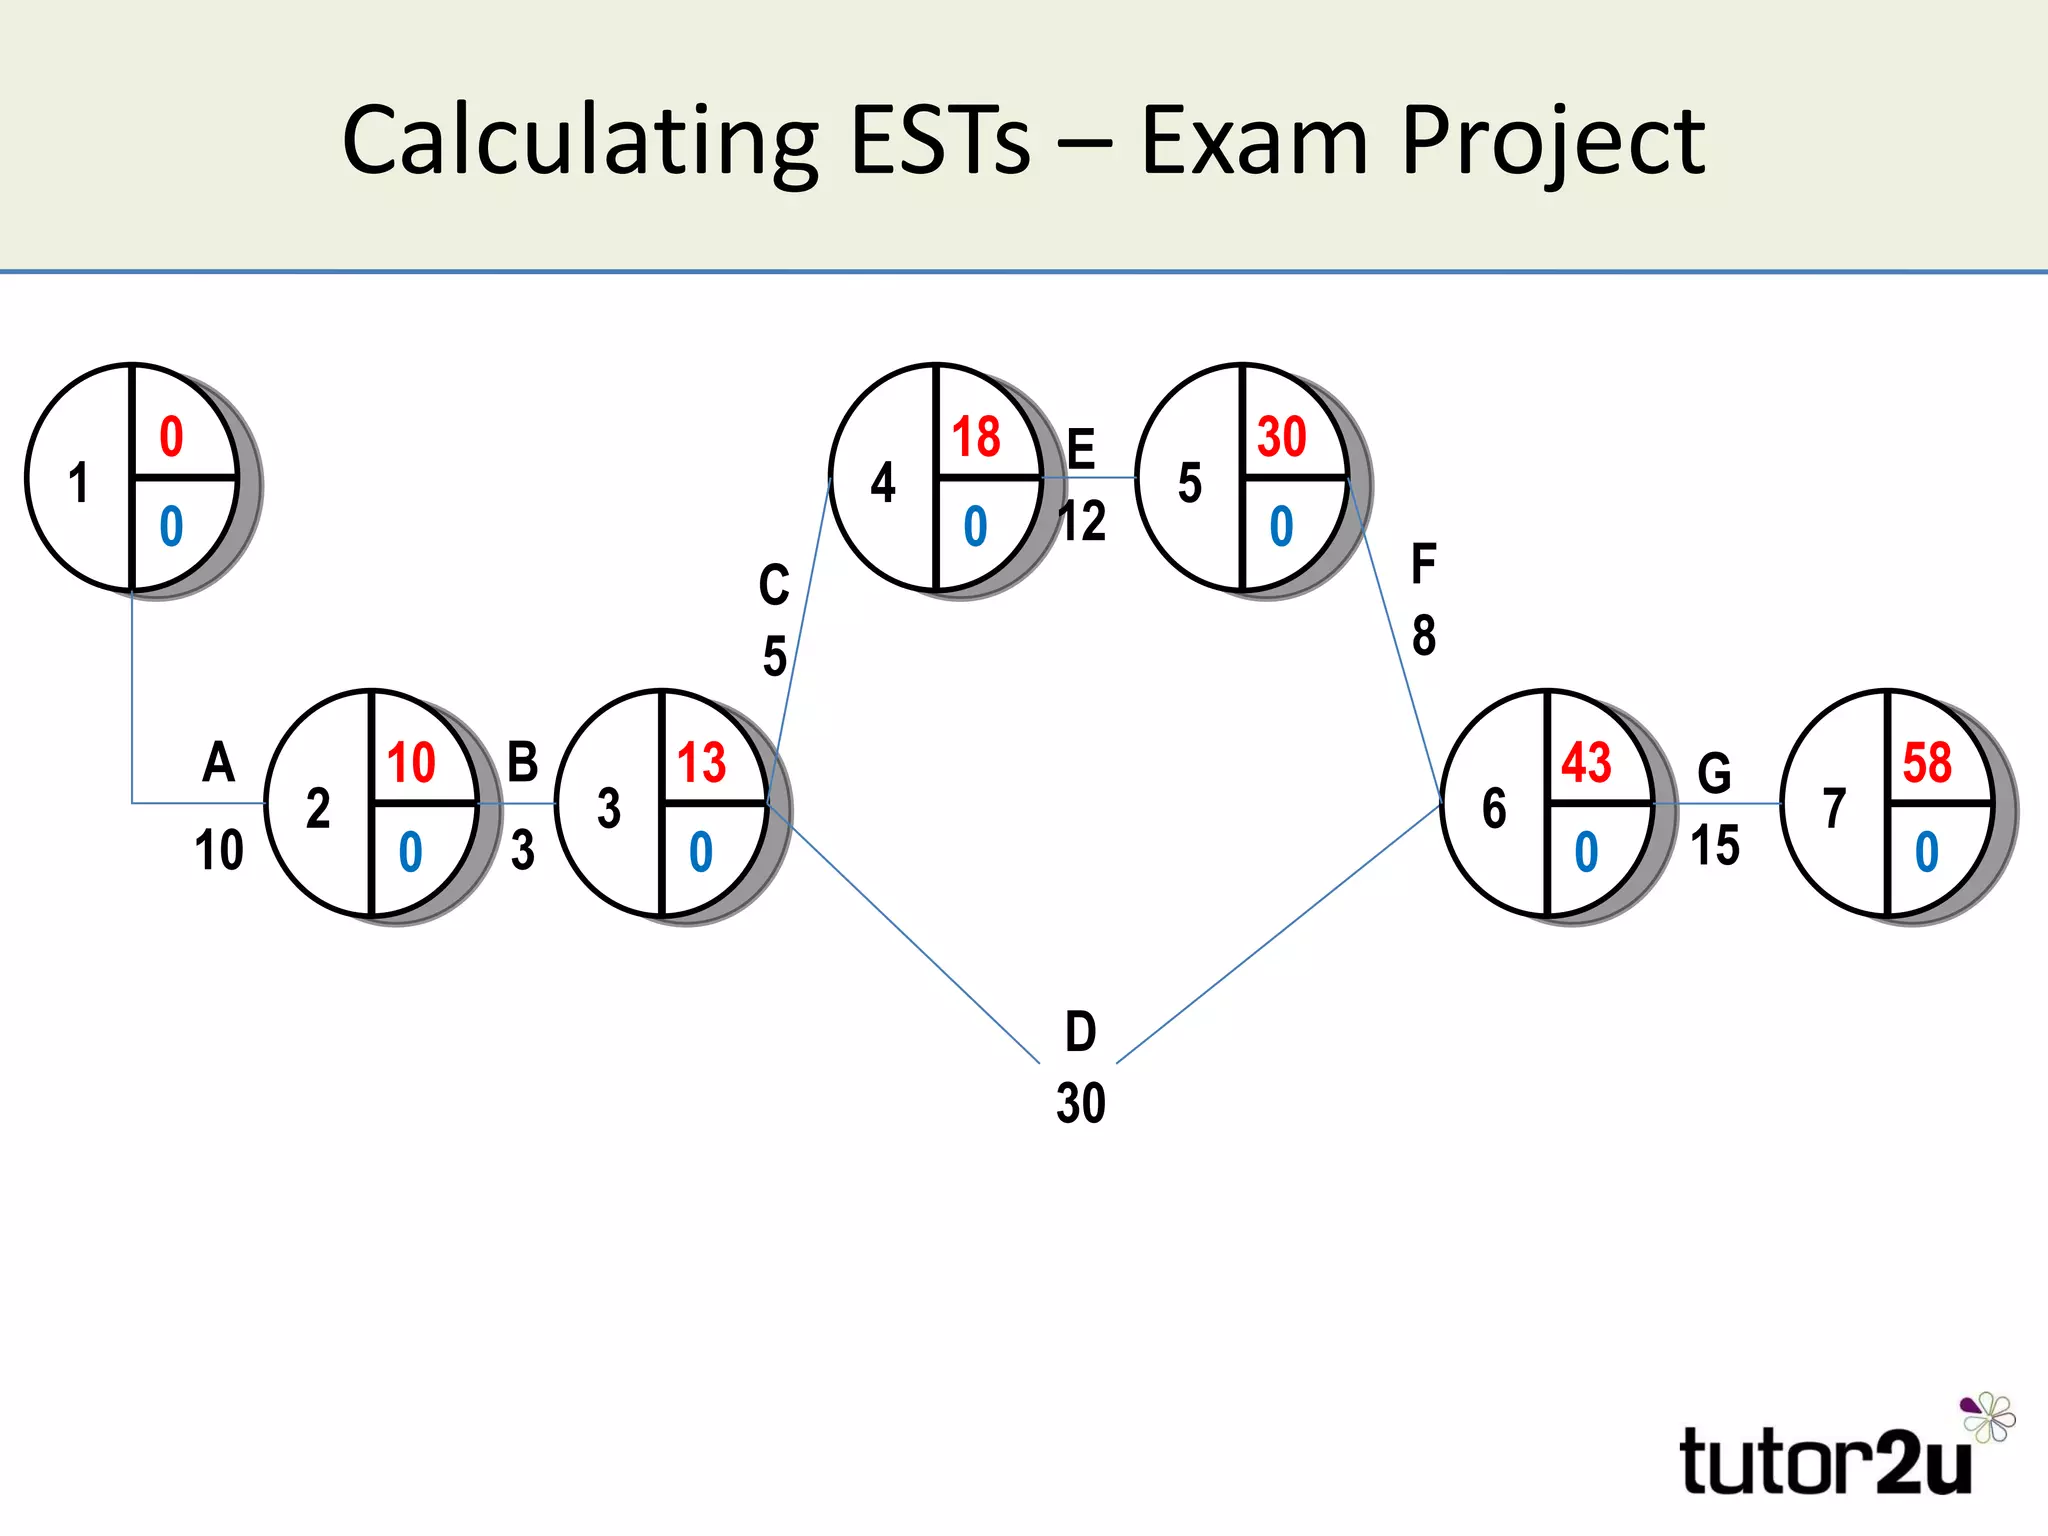
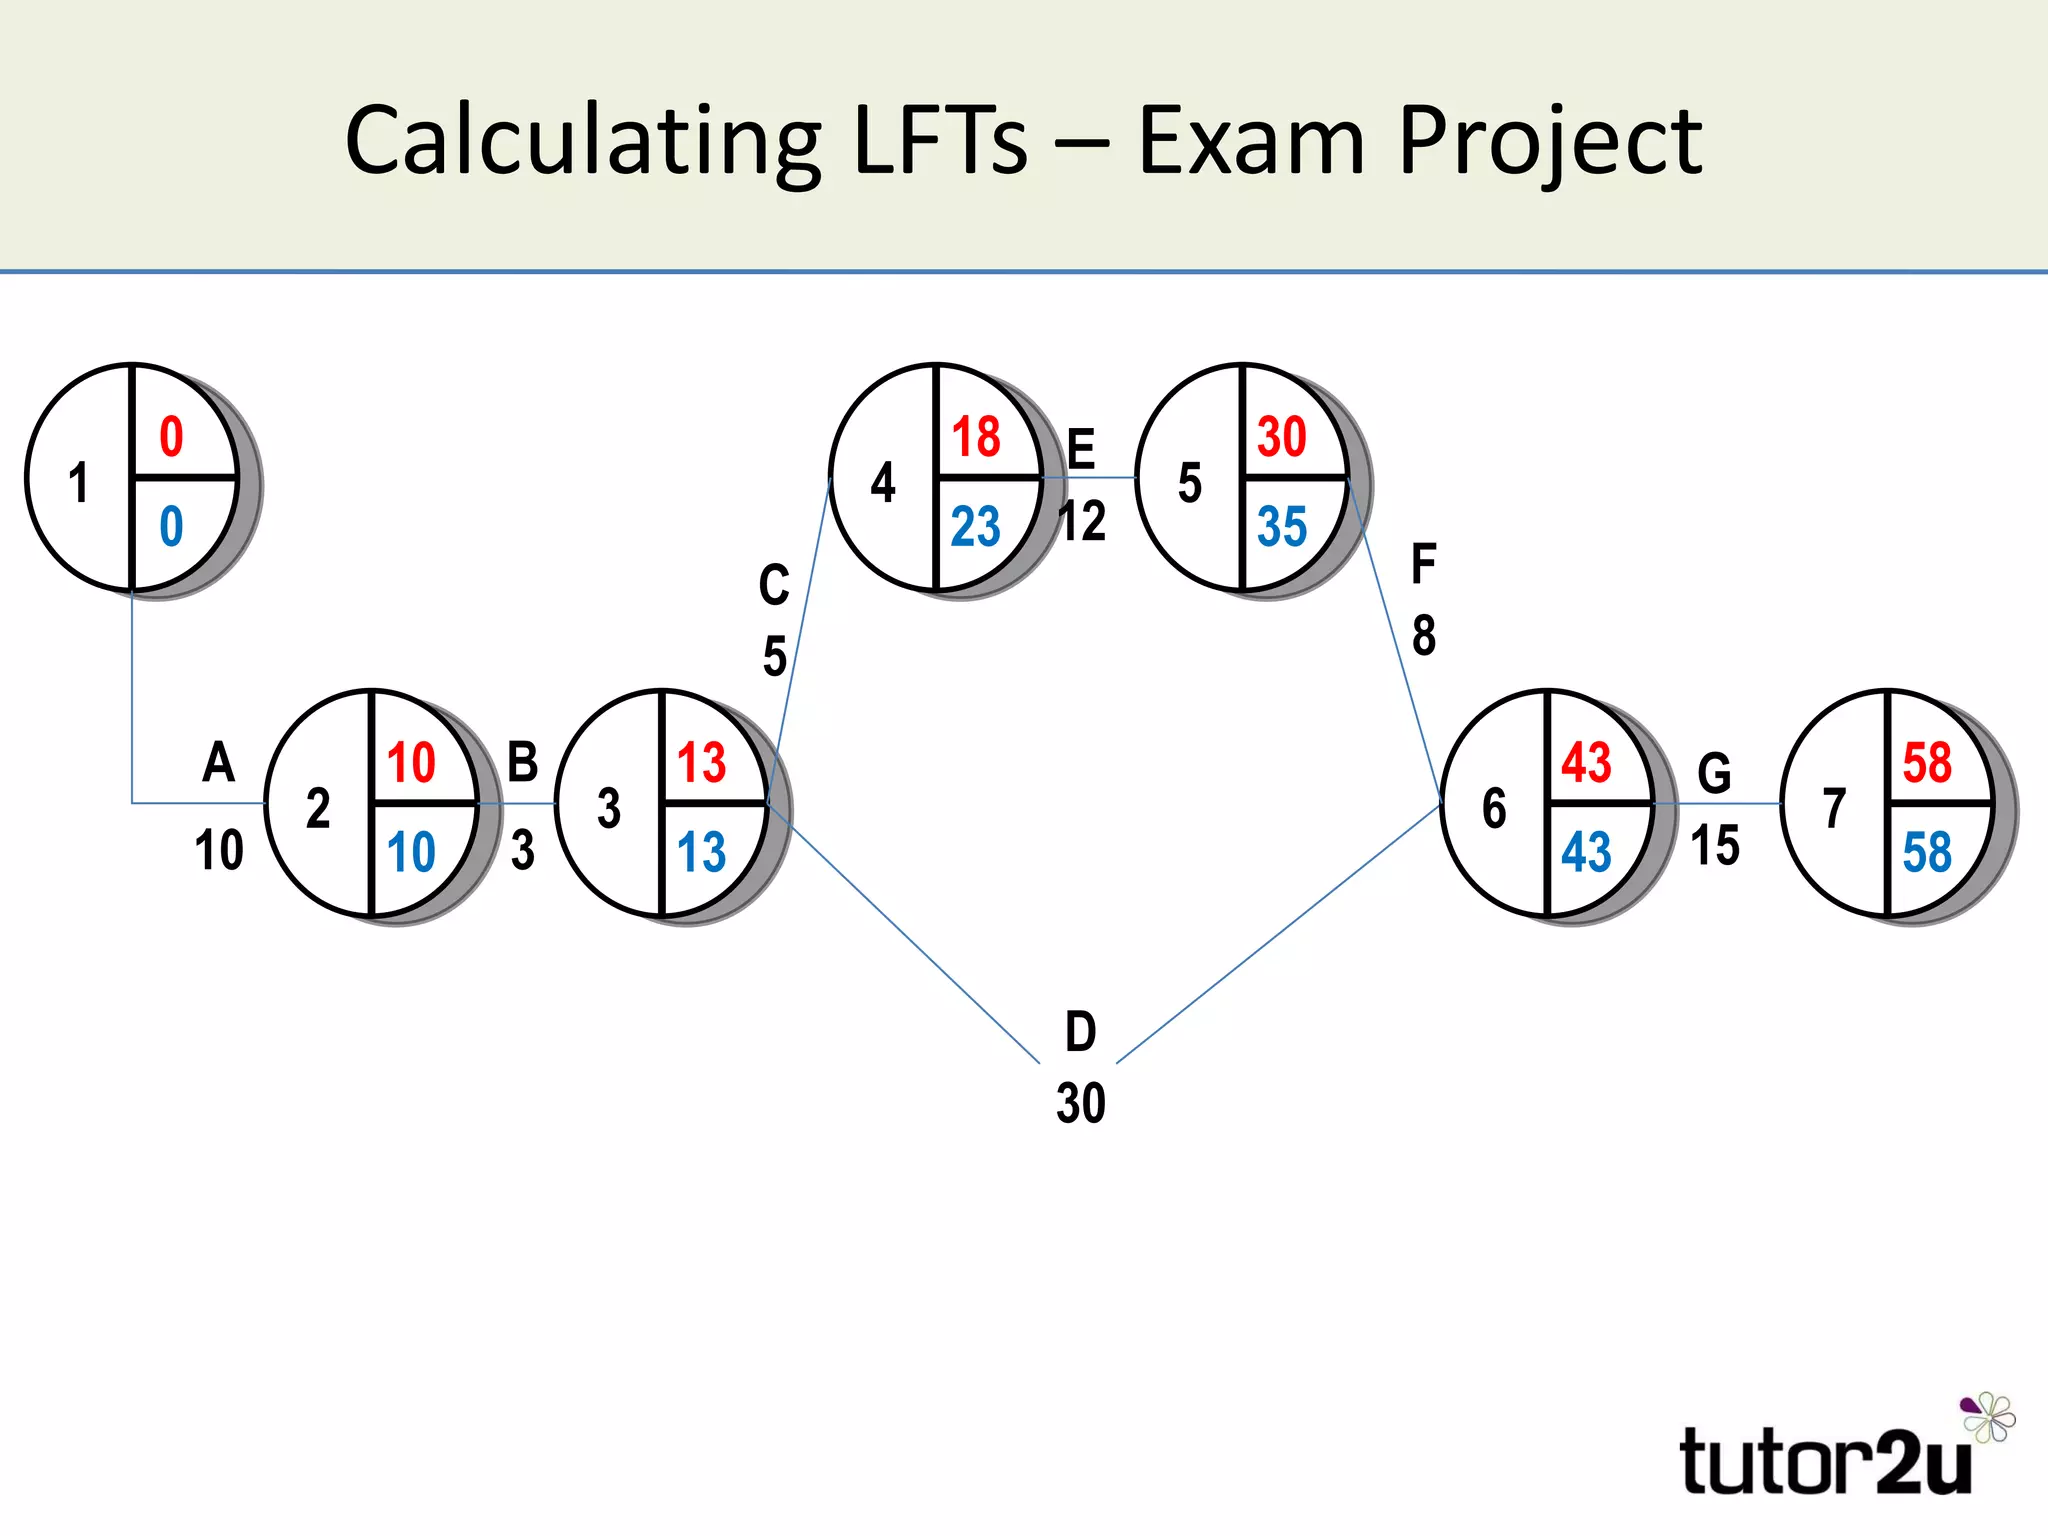
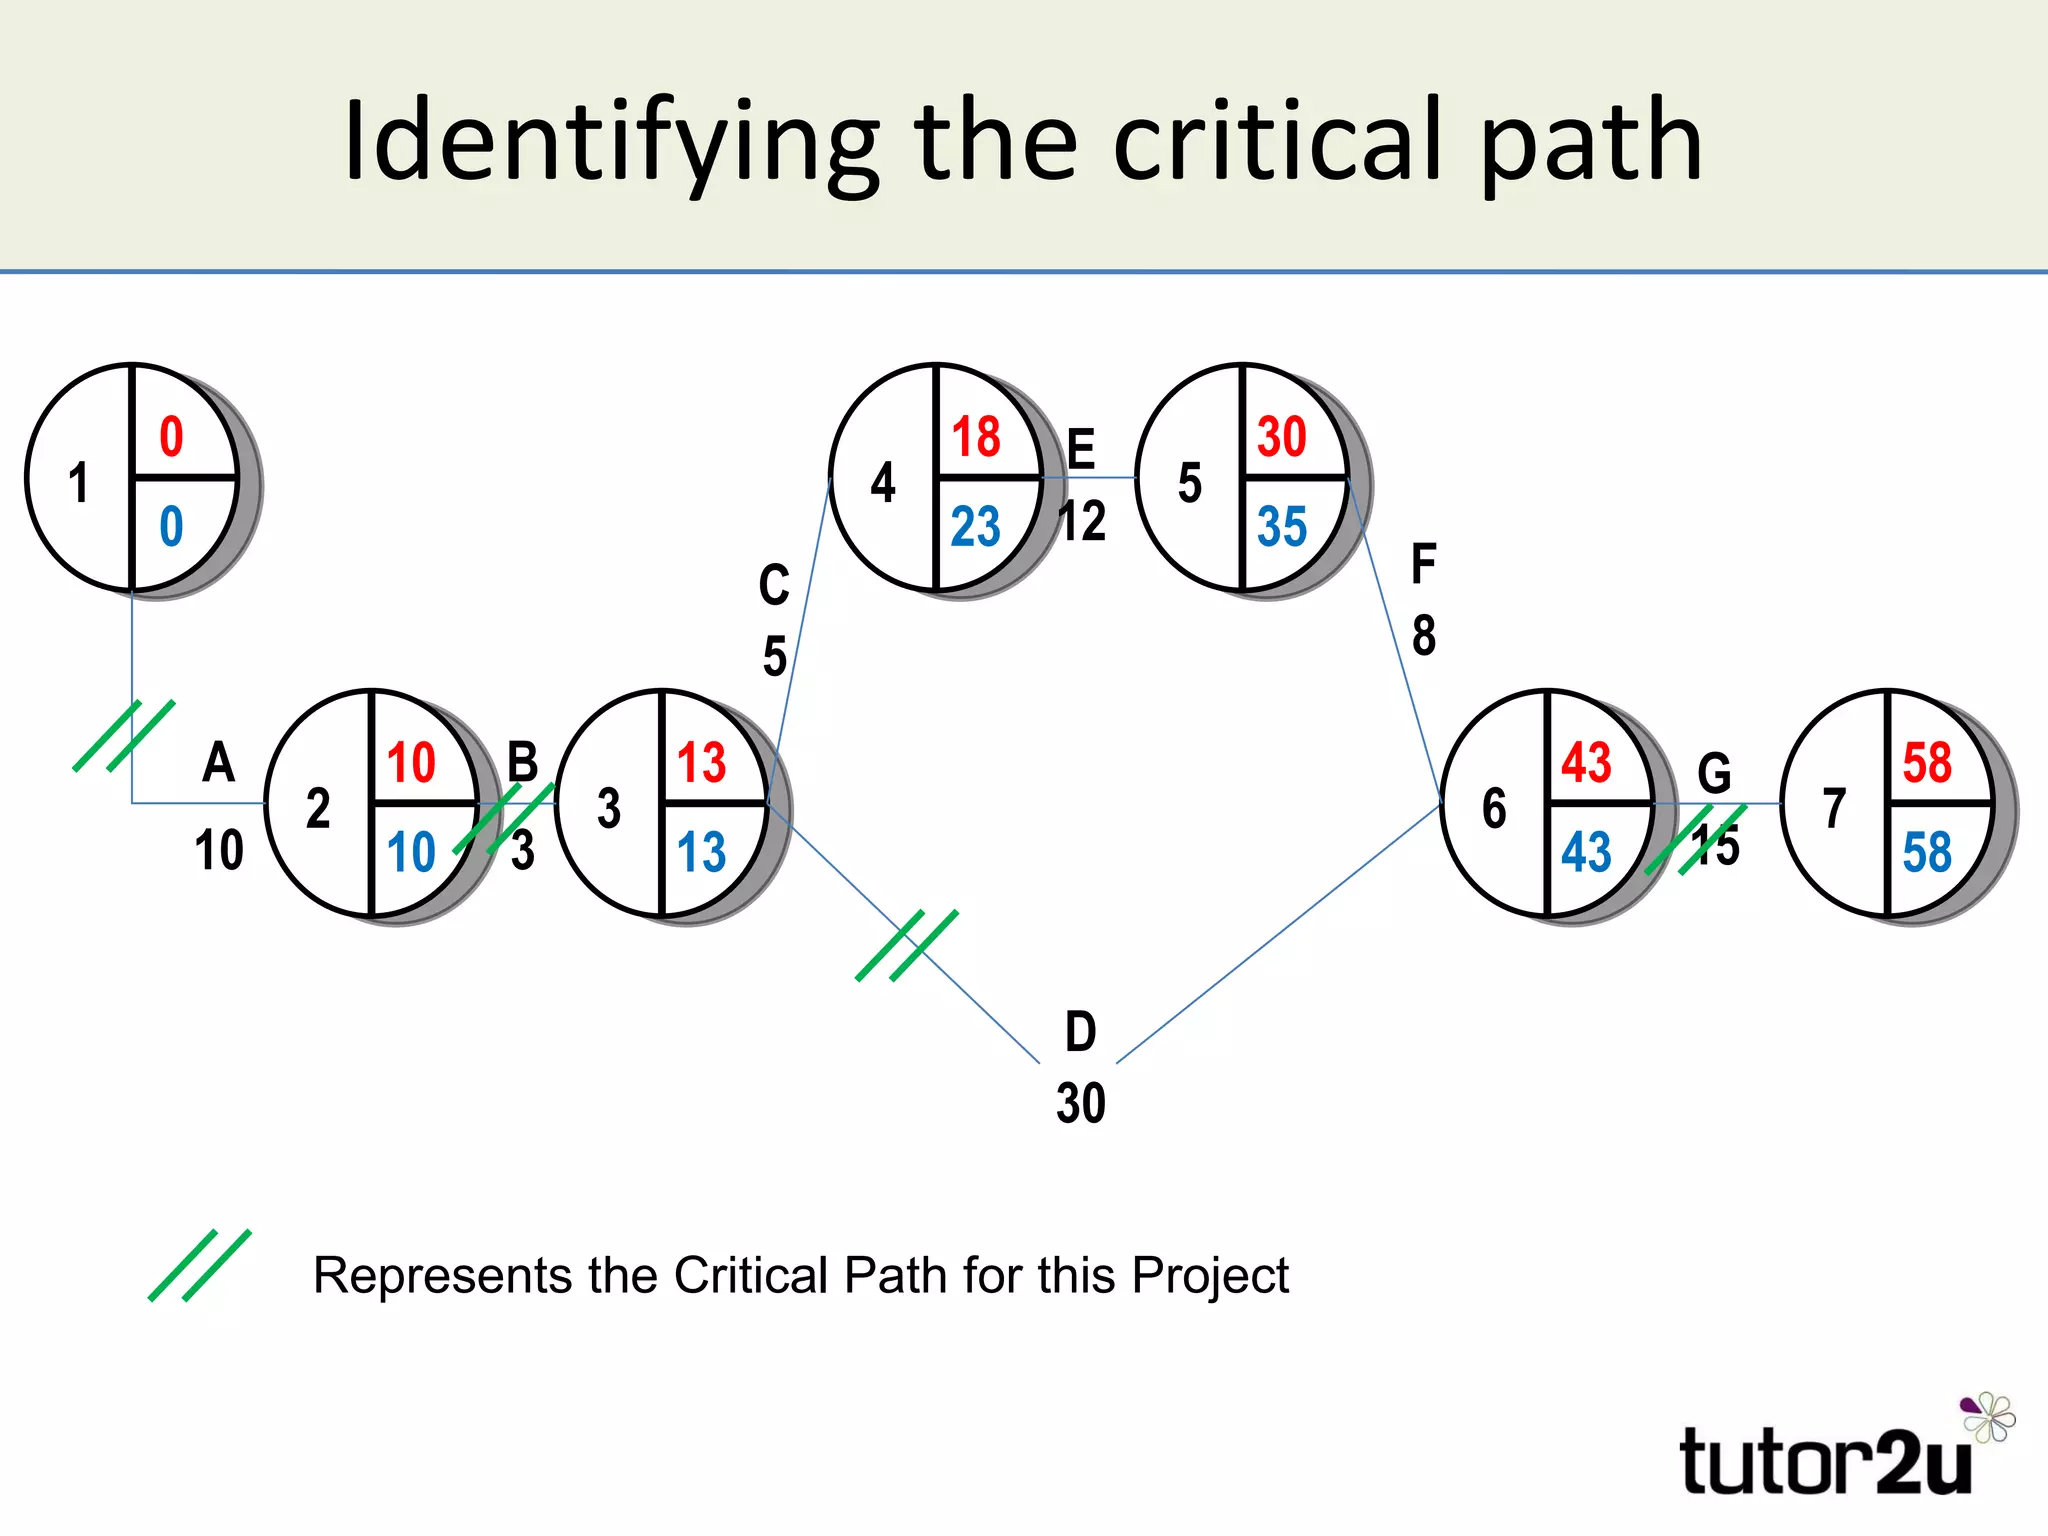
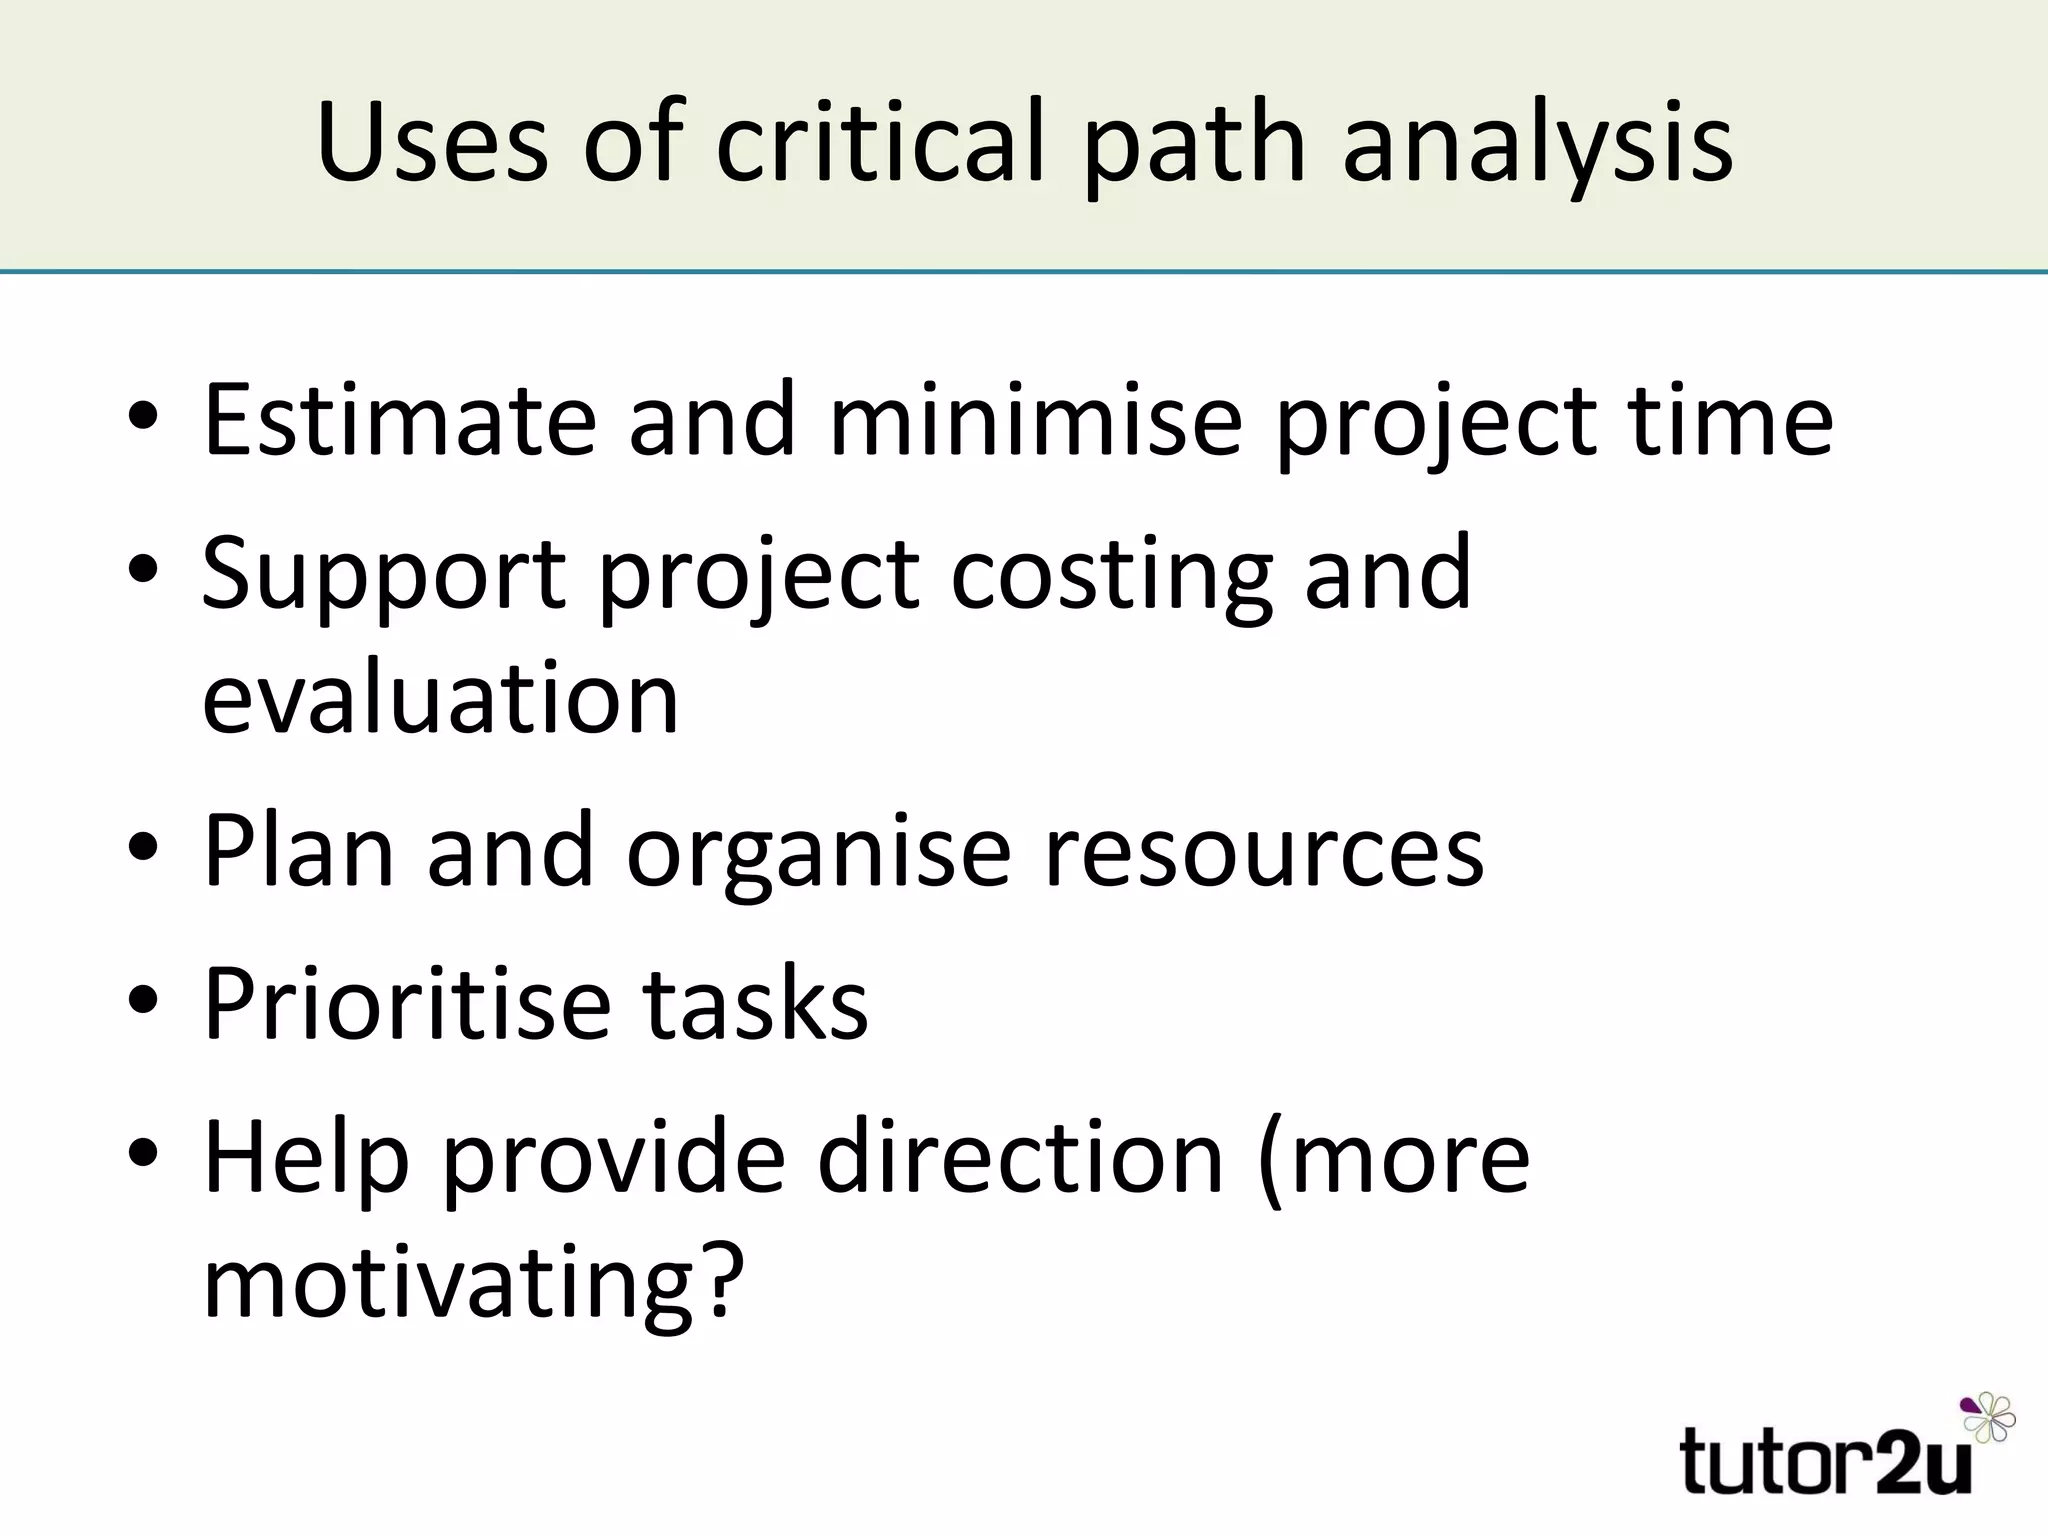
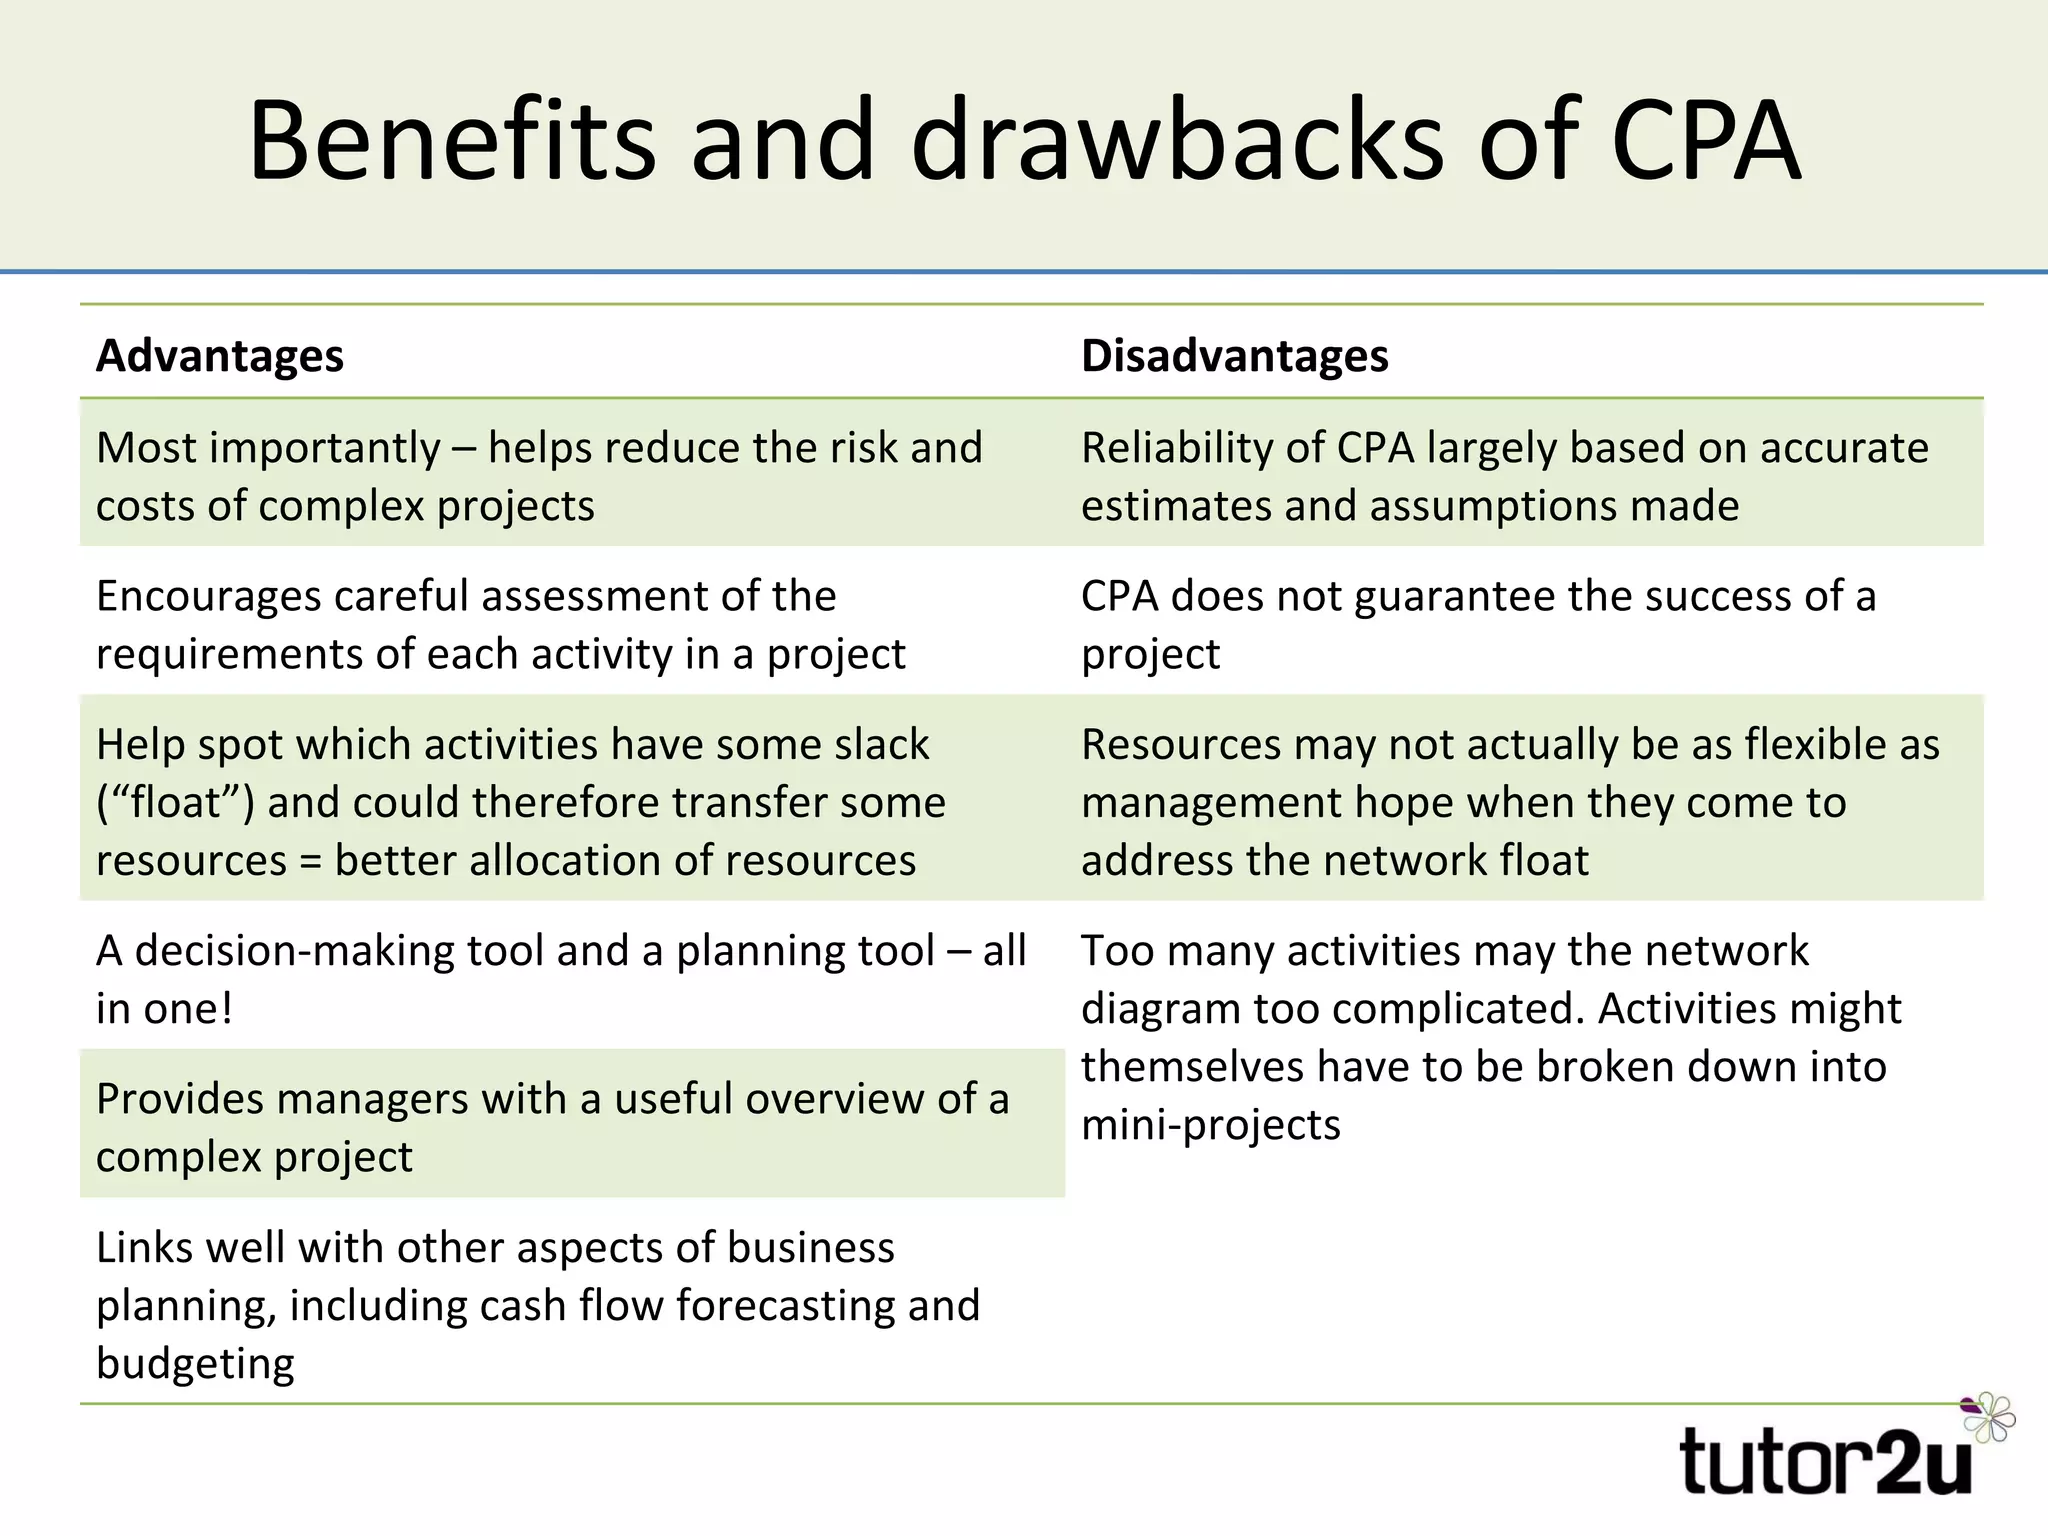
Critical Path Analysis
Critical path analysis (“CPA”) CPA is a  project analysis  and  planning  method that allows a project to completed in the shortest possible time
The need to plan complex projects Many larger businesses get involved in projects that are complex and involve significant  investment  and  risk As the complexity and risk increases it becomes even more necessary to identify the  relationships between the activities  involved and to work out the most efficient way of completing the project
Information needed for CPA A list of all activities required to complete the project The time (duration) that each activity will take to completion The dependencies between the activities (e.g. activity D cannot be completed until activity B&C done)
CPA calculates… The longest path of planned activities to the end of the project The  earliest start time (EST)  and   latest finish (LFT)  time that each activity can start and finish without making the project longer Which activities are  "critical"  (i.e. on the longest path) and which have "total float" (i.e. can be delayed without making the project longer)
What is the critical path? The sequence of project activities which add up to the  longest overall duration The critical path determines the shortest time possible to complete the project
Why is the critical path so important? Any delay of an activity on the critical path directly impacts the planned project completion date (i.e. there is no float on the critical path)
Drawing the network Component Description Node A  circle  that represents a point in time where an activity is started or finished.  The node (circle) is split into three sections: The left half of the circle is the  unique node (activity) number  – the network diagram draws these in order The top right section shows the  earliest start time (EST)  that an activity can commence based on the completion of the previous activity The bottom right section shows the  latest finish time (LFT)  by which the previous activity must be completed Activities An activity is something that takes time.  An activity is shown on the network as a  line , linking the nodes (circles).  A description of the activity, or a letter representing the activity, is usually shown above the relevant line  Duration The length of time it takes to complete an activity – shown as a number of the relevant units (e.g. hours, days)  under the activity line
The network diagram - layout 4 7 10 EST LFT Activity H 8 Activity Duration
Simple project example – revising for exams Task Activity Dependent on Duration (hours) A Gather lesson notes and read through Starting activity 10 B Identify gaps in knowledge Completion of task A 3 C Research online sources Completion of task B 5 D Procrastinate and browse Facebook Completion of task B 30 E Write revision plan & revision notes Completion of task B & C 12 F Practice past exam papers Begin when E complete 8 G Complete last minute cramming 15
Calculating ESTs The first node will always have an EST of zero! ESTs are calculated from left to right Add the  duration  of an activity to the EST of a previous node If more than one activity leads to a node, the highest figure becomes the new EST
Calculating ESTs – Exam Project 3 13 0 1 0 0 A 10 2 10 0 B 3 C 5 D 30 4 18 0 E 12 5 30 0 F 8 6 43 0 G 15 7 58 0
Calculating LFTs Give the last node of the project an LFT = to the EST Work backwards from right to left Subtract the duration of the activity from the LFT
Calculating LFTs – Exam Project 3 13 13 1 0 0 A 10 2 10 10 B 3 C 5 D 30 4 18 23 E 12 5 30 35 F 8 6 43 43 G 15 7 58 58
Calculating the float The  float  is the duration an activity can be extended or postponed so that the project still finishes within the minimum time Calculated as: LFT  less Activity Duration less  EST
Calculated float – Exam Project Activity LFT Duration EST Total Float A 10 10 0 0 B 13 3 10 0 C 23 5 13 5 D 43 30 13 0 E 35 12 18 5 F 43 8 30 5 G 58 15 43 0
Identifying the critical path Activities with a float of 0 (zero) cannot be delayed without delaying the entire project Such activities represent the “critical path” On the critical path, activities have an  equal   EST  and  LFT
Identifying the critical path Represents the Critical Path for this Project 3 13 13 1 0 0 A 10 2 10 10 B 3 C 5 D 30 4 18 23 E 12 5 30 35 F 8 6 43 43 G 15 7 58 58
Uses of critical path analysis Estimate and minimise project time Support project costing and evaluation Plan and organise resources Prioritise tasks Help provide direction (more motivating?
Benefits and drawbacks of CPA Advantages Disadvantages Most importantly – helps reduce the risk and costs of complex projects Reliability of CPA largely based on accurate estimates and assumptions made Encourages careful assessment of the requirements of each activity in a project CPA does not guarantee the success of a project Help spot which activities have some slack (“float”) and could therefore transfer some resources = better allocation of resources Resources may not actually be as flexible as management hope when they come to address the network float A decision-making tool and a planning tool – all in one! Too many activities may the network diagram too complicated. Activities might themselves have to be broken down into mini-projects Provides managers with a useful overview of a complex project Links well with other aspects of business planning, including cash flow forecasting and budgeting
Keep up-to-date with business stories, resources, quizzes and worksheets for your business course.  Click the logo!
Follow tutor2u on Twitter tutor2u tutor2u_econ
Become a fan of tutor2u on Facebook! tutor2u on Facebook

Critical Path Analysis

  • 1.
  • 2.
    Critical path analysis(“CPA”) CPA is a project analysis and planning method that allows a project to completed in the shortest possible time
  • 3.
    The need toplan complex projects Many larger businesses get involved in projects that are complex and involve significant investment and risk As the complexity and risk increases it becomes even more necessary to identify the relationships between the activities involved and to work out the most efficient way of completing the project
  • 4.
    Information needed forCPA A list of all activities required to complete the project The time (duration) that each activity will take to completion The dependencies between the activities (e.g. activity D cannot be completed until activity B&C done)
  • 5.
    CPA calculates… Thelongest path of planned activities to the end of the project The earliest start time (EST) and latest finish (LFT) time that each activity can start and finish without making the project longer Which activities are "critical" (i.e. on the longest path) and which have "total float" (i.e. can be delayed without making the project longer)
  • 6.
    What is thecritical path? The sequence of project activities which add up to the longest overall duration The critical path determines the shortest time possible to complete the project
  • 7.
    Why is thecritical path so important? Any delay of an activity on the critical path directly impacts the planned project completion date (i.e. there is no float on the critical path)
  • 8.
    Drawing the networkComponent Description Node A circle that represents a point in time where an activity is started or finished. The node (circle) is split into three sections: The left half of the circle is the unique node (activity) number – the network diagram draws these in order The top right section shows the earliest start time (EST) that an activity can commence based on the completion of the previous activity The bottom right section shows the latest finish time (LFT) by which the previous activity must be completed Activities An activity is something that takes time. An activity is shown on the network as a line , linking the nodes (circles). A description of the activity, or a letter representing the activity, is usually shown above the relevant line Duration The length of time it takes to complete an activity – shown as a number of the relevant units (e.g. hours, days) under the activity line
  • 9.
    The network diagram- layout 4 7 10 EST LFT Activity H 8 Activity Duration
  • 10.
    Simple project example– revising for exams Task Activity Dependent on Duration (hours) A Gather lesson notes and read through Starting activity 10 B Identify gaps in knowledge Completion of task A 3 C Research online sources Completion of task B 5 D Procrastinate and browse Facebook Completion of task B 30 E Write revision plan & revision notes Completion of task B & C 12 F Practice past exam papers Begin when E complete 8 G Complete last minute cramming 15
  • 11.
    Calculating ESTs Thefirst node will always have an EST of zero! ESTs are calculated from left to right Add the duration of an activity to the EST of a previous node If more than one activity leads to a node, the highest figure becomes the new EST
  • 12.
    Calculating ESTs –Exam Project 3 13 0 1 0 0 A 10 2 10 0 B 3 C 5 D 30 4 18 0 E 12 5 30 0 F 8 6 43 0 G 15 7 58 0
  • 13.
    Calculating LFTs Givethe last node of the project an LFT = to the EST Work backwards from right to left Subtract the duration of the activity from the LFT
  • 14.
    Calculating LFTs –Exam Project 3 13 13 1 0 0 A 10 2 10 10 B 3 C 5 D 30 4 18 23 E 12 5 30 35 F 8 6 43 43 G 15 7 58 58
  • 15.
    Calculating the floatThe float is the duration an activity can be extended or postponed so that the project still finishes within the minimum time Calculated as: LFT less Activity Duration less EST
  • 16.
    Calculated float –Exam Project Activity LFT Duration EST Total Float A 10 10 0 0 B 13 3 10 0 C 23 5 13 5 D 43 30 13 0 E 35 12 18 5 F 43 8 30 5 G 58 15 43 0
  • 17.
    Identifying the criticalpath Activities with a float of 0 (zero) cannot be delayed without delaying the entire project Such activities represent the “critical path” On the critical path, activities have an equal EST and LFT
  • 18.
    Identifying the criticalpath Represents the Critical Path for this Project 3 13 13 1 0 0 A 10 2 10 10 B 3 C 5 D 30 4 18 23 E 12 5 30 35 F 8 6 43 43 G 15 7 58 58
  • 19.
    Uses of criticalpath analysis Estimate and minimise project time Support project costing and evaluation Plan and organise resources Prioritise tasks Help provide direction (more motivating?
  • 20.
    Benefits and drawbacksof CPA Advantages Disadvantages Most importantly – helps reduce the risk and costs of complex projects Reliability of CPA largely based on accurate estimates and assumptions made Encourages careful assessment of the requirements of each activity in a project CPA does not guarantee the success of a project Help spot which activities have some slack (“float”) and could therefore transfer some resources = better allocation of resources Resources may not actually be as flexible as management hope when they come to address the network float A decision-making tool and a planning tool – all in one! Too many activities may the network diagram too complicated. Activities might themselves have to be broken down into mini-projects Provides managers with a useful overview of a complex project Links well with other aspects of business planning, including cash flow forecasting and budgeting
  • 21.
    Keep up-to-date withbusiness stories, resources, quizzes and worksheets for your business course. Click the logo!
  • 22.
    Follow tutor2u onTwitter tutor2u tutor2u_econ
  • 23.
    Become a fanof tutor2u on Facebook! tutor2u on Facebook