An IP radio access network (IPRAN) is an IP-based wireless access network that uses IP/MPLS at the metro aggregation/core layer and Layer 2 enhanced Ethernet (with or without Layer 3 IP/MPLS) at the access layer.
CPM and PERT
Critical Path is one of the two ways or tools to
identify the paths through your project
PERT stands for program evaluation review
technique
CPM stands for critical path method
CPM uses one time estimate, whereas PERT
uses three time estimates
CPM is used when you are sure about the
duration of each activity
PERT is used in more uncertain situations
3.
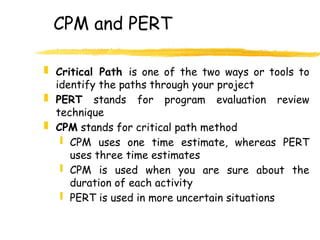
How to findthe Critical Path
1. Start with an activity network diagram
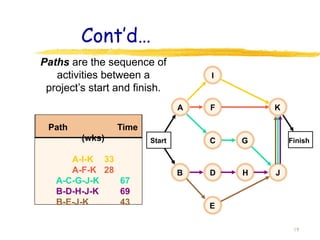
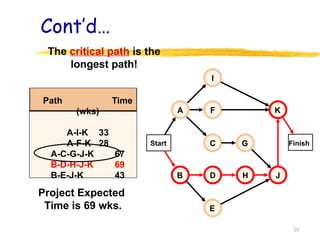
2. Find all of the paths in the diagram. A path is any
string of activities that goes from the start of the
project to the end.
3. Find the duration of each path by adding up the
durations of each of the activities on the path.
The critical path is the one with the longest
duration
Start
A
B
C
D
E
Finish
4
7
2
5
3
3
4.
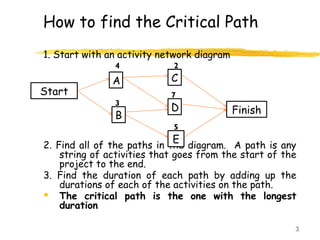
How to findthe Critical Path…Cont’d
The float for each of the activities on the critical path
is zero.
Another word for float is slack.
Float tells you how much extra time you have
Once you know the float, you know how much play you have in
your schedule.
Find the next longest path. Subtract its duration from
the duration of the critical path, and that’s the float for
each activity on it.
You can use this method to find the float for every
activity in a network diagram.
Do the same for the next longest path, and so on
through the rest of the network diagram.
4
5.
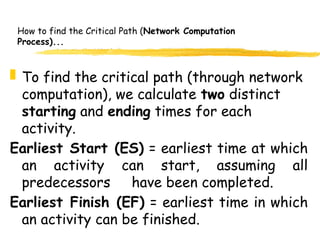
How to findthe Critical Path (Network Computation
Process)...
To find the critical path (through network
computation), we calculate two distinct
starting and ending times for each
activity.
Earliest Start (ES) = earliest time at which
an activity can start, assuming all
predecessors have been completed.
Earliest Finish (EF) = earliest time in which
an activity can be finished.
5
6.
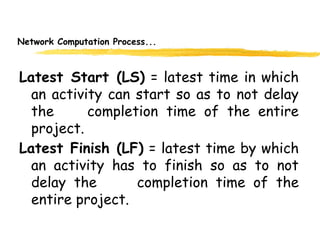
Network Computation Process...
LatestStart (LS) = latest time in which
an activity can start so as to not delay
the completion time of the entire
project.
Latest Finish (LF) = latest time by which
an activity has to finish so as to not
delay the completion time of the
entire project.
6
7.
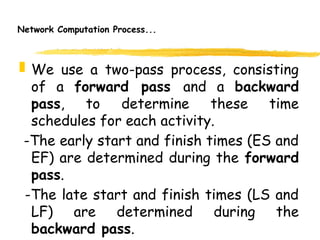
Network Computation Process...
We use a two-pass process, consisting
of a forward pass and a backward
pass, to determine these time
schedules for each activity.
-The early start and finish times (ES and
EF) are determined during the forward
pass.
-The late start and finish times (LS and
LF) are determined during the
backward pass. 7
8.
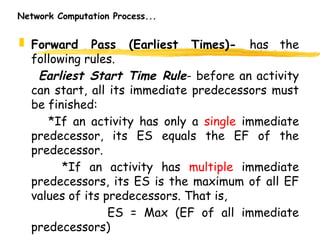
Network Computation Process...
Forward Pass (Earliest Times)- has the
following rules.
Earliest Start Time Rule- before an activity
can start, all its immediate predecessors must
be finished:
*If an activity has only a single immediate
predecessor, its ES equals the EF of the
predecessor.
*If an activity has multiple immediate
predecessors, its ES is the maximum of all EF
values of its predecessors. That is,
ES = Max (EF of all immediate
predecessors) 8
9.
Network Computation Process...
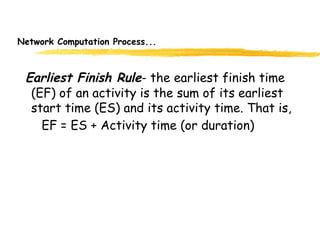
EarliestFinish Rule- the earliest finish time
(EF) of an activity is the sum of its earliest
start time (ES) and its activity time. That is,
EF = ES + Activity time (or duration)
9
10.
Network Computation Process...
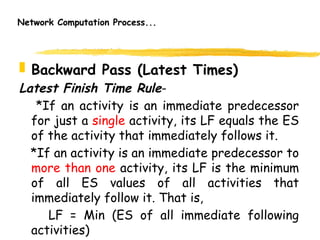
Backward Pass (Latest Times)
Latest Finish Time Rule-
*If an activity is an immediate predecessor
for just a single activity, its LF equals the ES
of the activity that immediately follows it.
*If an activity is an immediate predecessor to
more than one activity, its LF is the minimum
of all ES values of all activities that
immediately follow it. That is,
LF = Min (ES of all immediate following
activities) 10
11.
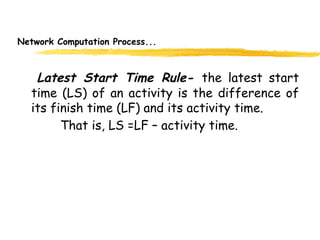
Network Computation Process...
LatestStart Time Rule- the latest start
time (LS) of an activity is the difference of
its finish time (LF) and its activity time.
That is, LS =LF – activity time.
11
12.
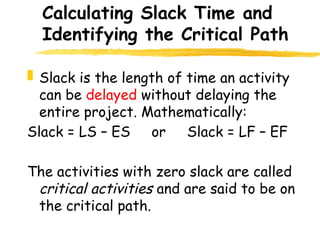
Calculating Slack Timeand
Identifying the Critical Path
Slack is the length of time an activity
can be delayed without delaying the
entire project. Mathematically:
Slack = LS – ES or Slack = LF – EF
The activities with zero slack are called
critical activities and are said to be on
the critical path.
12
13.
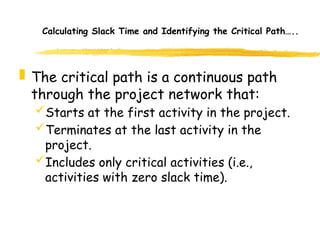
Calculating Slack Timeand Identifying the Critical Path…..
The critical path is a continuous path
through the project network that:
Starts at the first activity in the project.
Terminates at the last activity in the
project.
Includes only critical activities (i.e.,
activities with zero slack time).
13
14.
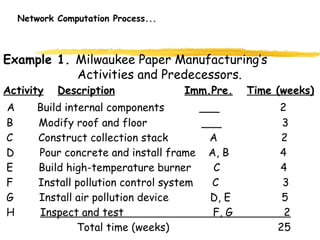
Network Computation Process...
Example1. Milwaukee Paper Manufacturing’s
Activities and Predecessors.
Activity Description Imm.Pre. Time (weeks)
A Build internal components ___ 2
B Modify roof and floor ___ 3
C Construct collection stack A 2
D Pour concrete and install frame A, B 4
E Build high-temperature burner C 4
F Install pollution control system C 3
G Install air pollution device D, E 5
H Inspect and test F, G 2
Total time (weeks) 25
15.
Network Computation Process...
Required:
1.Draw AON networks for Milwaukee Papers.
2. Determine the earliest and latest times for
the activities.
3. Calculate the slack time and identify the
critical path.
15
16.
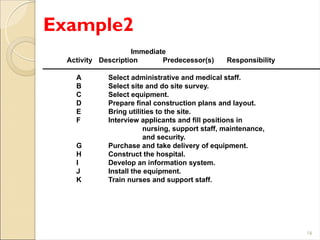
Example2
16
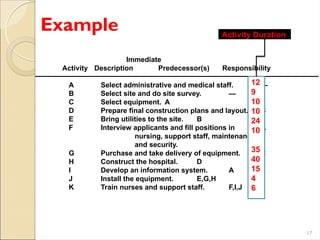
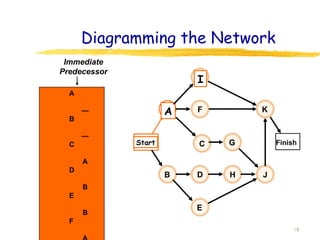
Immediate
Activity Description Predecessor(s)Responsibility
A Select administrative and medical staff.
B Select site and do site survey.
C Select equipment.
D Prepare final construction plans and layout.
E Bring utilities to the site.
F Interview applicants and fill positions in
nursing, support staff, maintenance,
and security.
G Purchase and take delivery of equipment.
H Construct the hospital.
I Develop an information system.
J Install the equipment.
K Train nurses and support staff.
17.
Example
17
Immediate
Activity Description Predecessor(s)Responsibility
A Select administrative and medical staff. —
B Select site and do site survey. —
C Select equipment. A
D Prepare final construction plans and layout. B
E Bring utilities to the site. B
F Interview applicants and fill positions in A
nursing, support staff, maintenance,
and security.
G Purchase and take delivery of equipment. C
H Construct the hospital. D
I Develop an information system. A
J Install the equipment. E,G,H
K Train nurses and support staff. F,I,J
12
9
10
10
24
10
35
40
15
4
6
Activity Duration
22
Estimation of TaskTimes
In CPM, we assume that the task durations
are known with certainty.
This may not be realistic in many project
settings.
How long does it take to design a switch?
PERT tries to account for the uncertainty in
task durations.
Key question: What is the probability of
completing a project by a given deadline?
23.
23
CPM vs. PERT
CPM (critical path method)
PERT (program evaluation and review
technique)
Both approaches work on a project network,
which graphically portrays the activities of the
project and their relationships.
· CPM assumes that activity times are
deterministic, while PERT views the time to
complete a task as a random variable.
24.
24
Estimation of theduration of project
activities
(1) The deterministic approach (CPM), which
ignores uncertainty thus results in a point
estimate (e.g. The duration of task 1 = 23
hours, etc.)
(2) The stochastic approach (PERT) considers the
uncertain nature of project activities by
estimating the expected duration of each
activity and its corresponding variance.
Analyse the past data to construct the probabilistic
distribution of a task.
25.
25
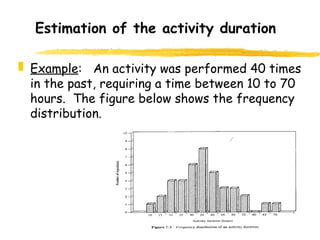
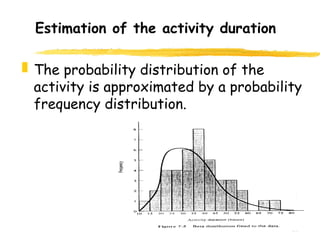
Estimation of theactivity duration
Example: An activity was performed 40 times
in the past, requiring a time between 10 to 70
hours. The figure below shows the frequency
distribution.
26.
26
Estimation of theactivity duration
The probability distribution of the
activity is approximated by a probability
frequency distribution.
27.
27
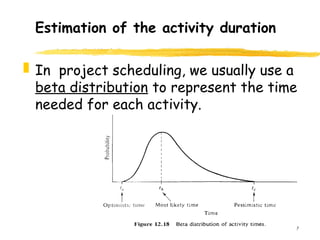
Estimation of theactivity duration
In project scheduling, we usually use a
beta distribution to represent the time
needed for each activity.
28.
28
Estimation of theactivity duration
· Three key values we use in the time estimate
for each activity:
a = optimistic time, which means that there is little
chance that the activity can be completed before
this time;
m = most likely time, which will be required if the
execution is normal;
b = pessimistic time, which means that there is little
chance that the activity will take longer.
29.
29
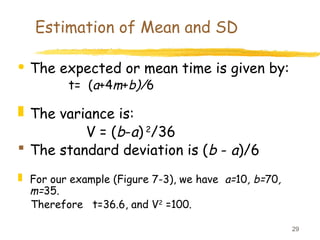
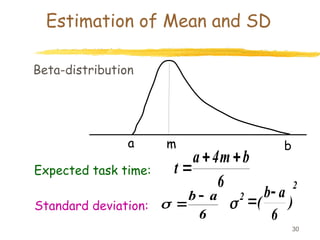
Estimation of Meanand SD
· The expected or mean time is given by:
t= (a+4m+b)/6
The variance is:
V = (b-a) 2
/36
The standard deviation is (b - a)/6
For our example (Figure 7-3), we have a=10, b=70,
m=35.
Therefore t=36.6, and V2
=100.
30.
30
Estimation of Meanand SD
Expected task time:
6
b
m
4
a
t
Standard deviation:
6
a
b
)
6
a
b
(
2
2
m b
Beta-distribution
a
31.
31
The PERT Approach
ThePERT (Program evaluation and
review technique) approach
addresses situations where
uncertainties must be considered.
32.
32
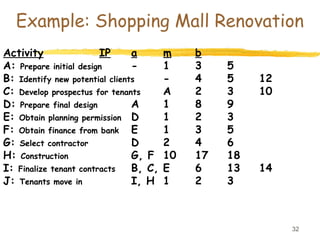
Example: Shopping MallRenovation
Activity IP a m b
A: Prepare initial design - 1 3 5
B: Identify new potential clients - 4 5 12
C: Develop prospectus for tenants A 2 3 10
D: Prepare final design A 1 8 9
E: Obtain planning permission D 1 2 3
F: Obtain finance from bank E 1 3 5
G: Select contractor D 2 4 6
H: Construction G, F 10 17 18
I: Finalize tenant contracts B, C, E 6 13 14
J: Tenants move in I, H 1 2 3
33.
33
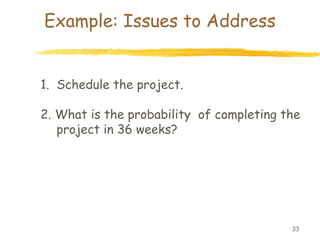
Example: Issues toAddress
1. Schedule the project.
2. What is the probability of completing the
project in 36 weeks?
34.
34
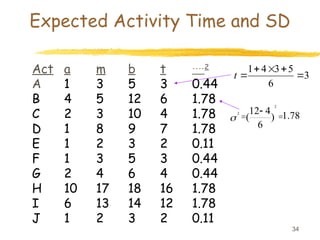
Expected Activity Timeand SD
Act a m b t 2
A 1 3 5 3 0.44
B 4 5 12 6 1.78
C 2 3 10 4 1.78
D 1 8 9 7 1.78
E 1 2 3 2 0.11
F 1 3 5 3 0.44
G 2 4 6 4 0.44
H 10 17 18 16 1.78
I 6 13 14 12 1.78
J 1 2 3 2 0.11
3
6
5
3
4
1
t
78
.
1
)
6
4
12
(
2
2
35.
35
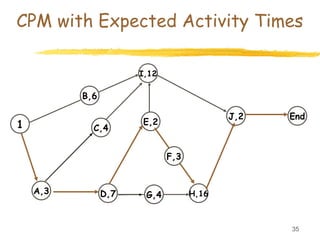
CPM with ExpectedActivity Times
1
A,3 D,7
E,2
H,16
J,2
I,12
End
B,6
C,4
F,3
G,4
36.
36
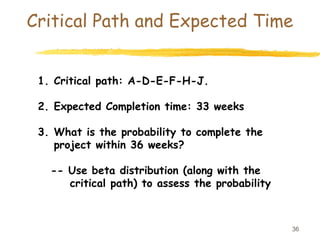
Critical Path andExpected Time
1. Critical path: A-D-E-F-H-J.
2. Expected Completion time: 33 weeks
3. What is the probability to complete the
project within 36 weeks?
-- Use beta distribution (along with the
critical path) to assess the probability
37.
37
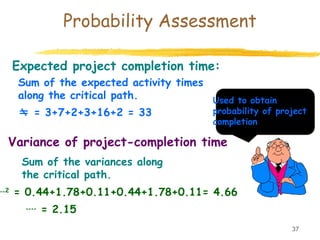
Probability Assessment
Expected projectcompletion time:
Sum of the expected activity times
along the critical path.
= 3+7+2+3+16+2 = 33
Variance of project-completion time
Sum of the variances along
the critical path.
2
= 0.44+1.78+0.11+0.44+1.78+0.11= 4.66
= 2.15
Used to obtain
probability of project
completion
38.
PERT SEEM 353038
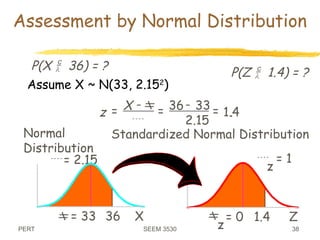
Assessment by Normal Distribution
Assume X ~ N(33, 2.152
)
P(X 36) = ?
= 33
= 2.15
36 X
Normal
Distribution
z
X
=
-
=
-
=
36 33
2.15
1.4
.
z
= 0
z
= 1
Z
1.4
Standardized Normal Distribution
P(Z 1.4) = ?
39.
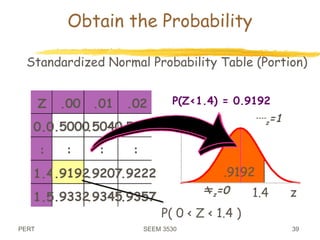
PERT SEEM 353039
Obtain the Probability
z=0
z=1
z
1.4
Z .00 .01 .02
0.0.5000
.5040.5080
: : : :
1.4.9192
.9207.9222
1.5.9332
.9345.9357
Standardized Normal Probability Table (Portion)
P( 0 < Z < 1.4 )
.9192
P(Z<1.4) = 0.9192