Downloaded 43 times

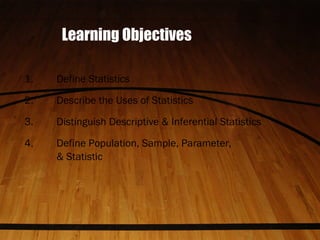
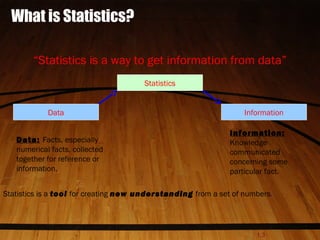

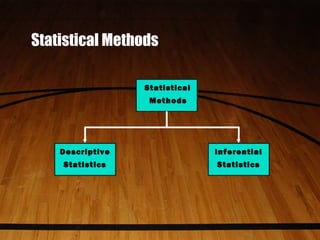
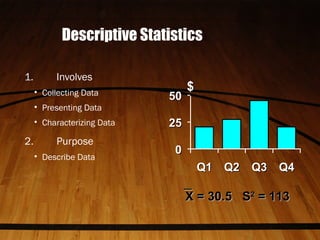
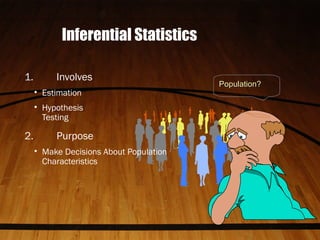
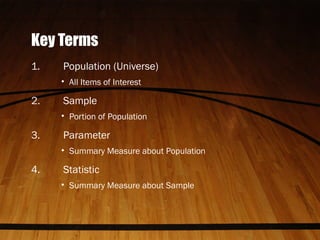
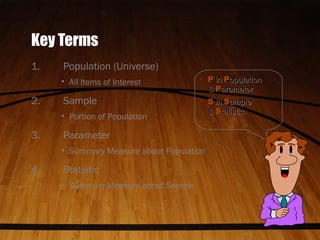


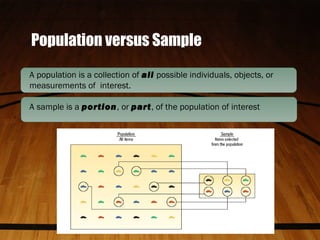
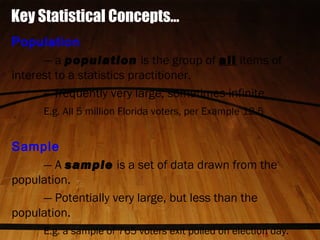
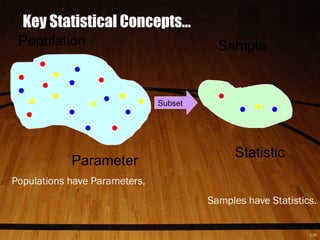
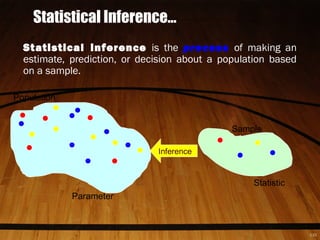

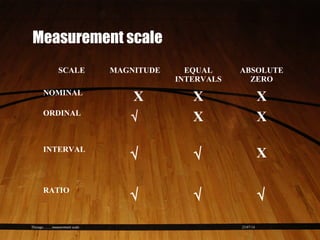
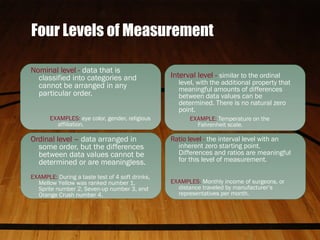
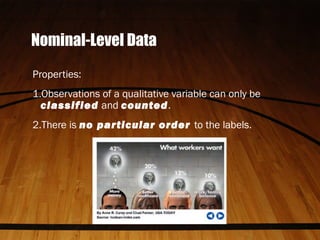
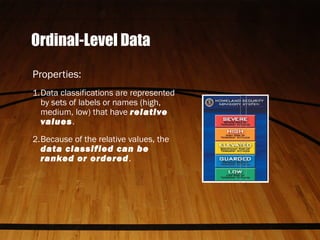
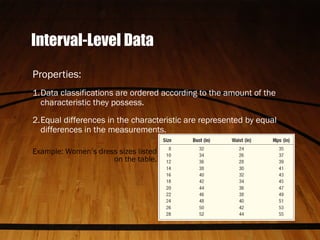
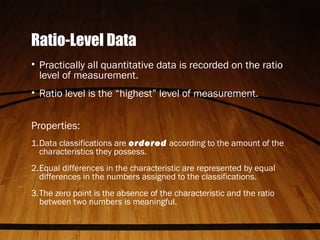
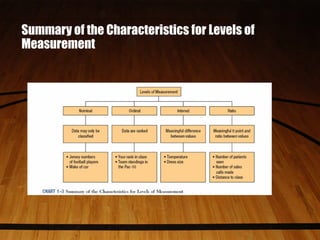

Statistics is the science of collecting, organizing, presenting, analyzing, and interpreting numerical data. It helps make better decisions by extracting information from data. There are two main types: descriptive statistics which describe data through methods like averages and distributions, and inferential statistics which make estimates, predictions, or generalizations about a population based on a sample. Key concepts in statistics include populations, samples, parameters which describe populations, and statistics which describe samples. The level of measurement of data, such as nominal, ordinal, interval, or ratio, determines what calculations and tests can be done.