Downloaded 167 times
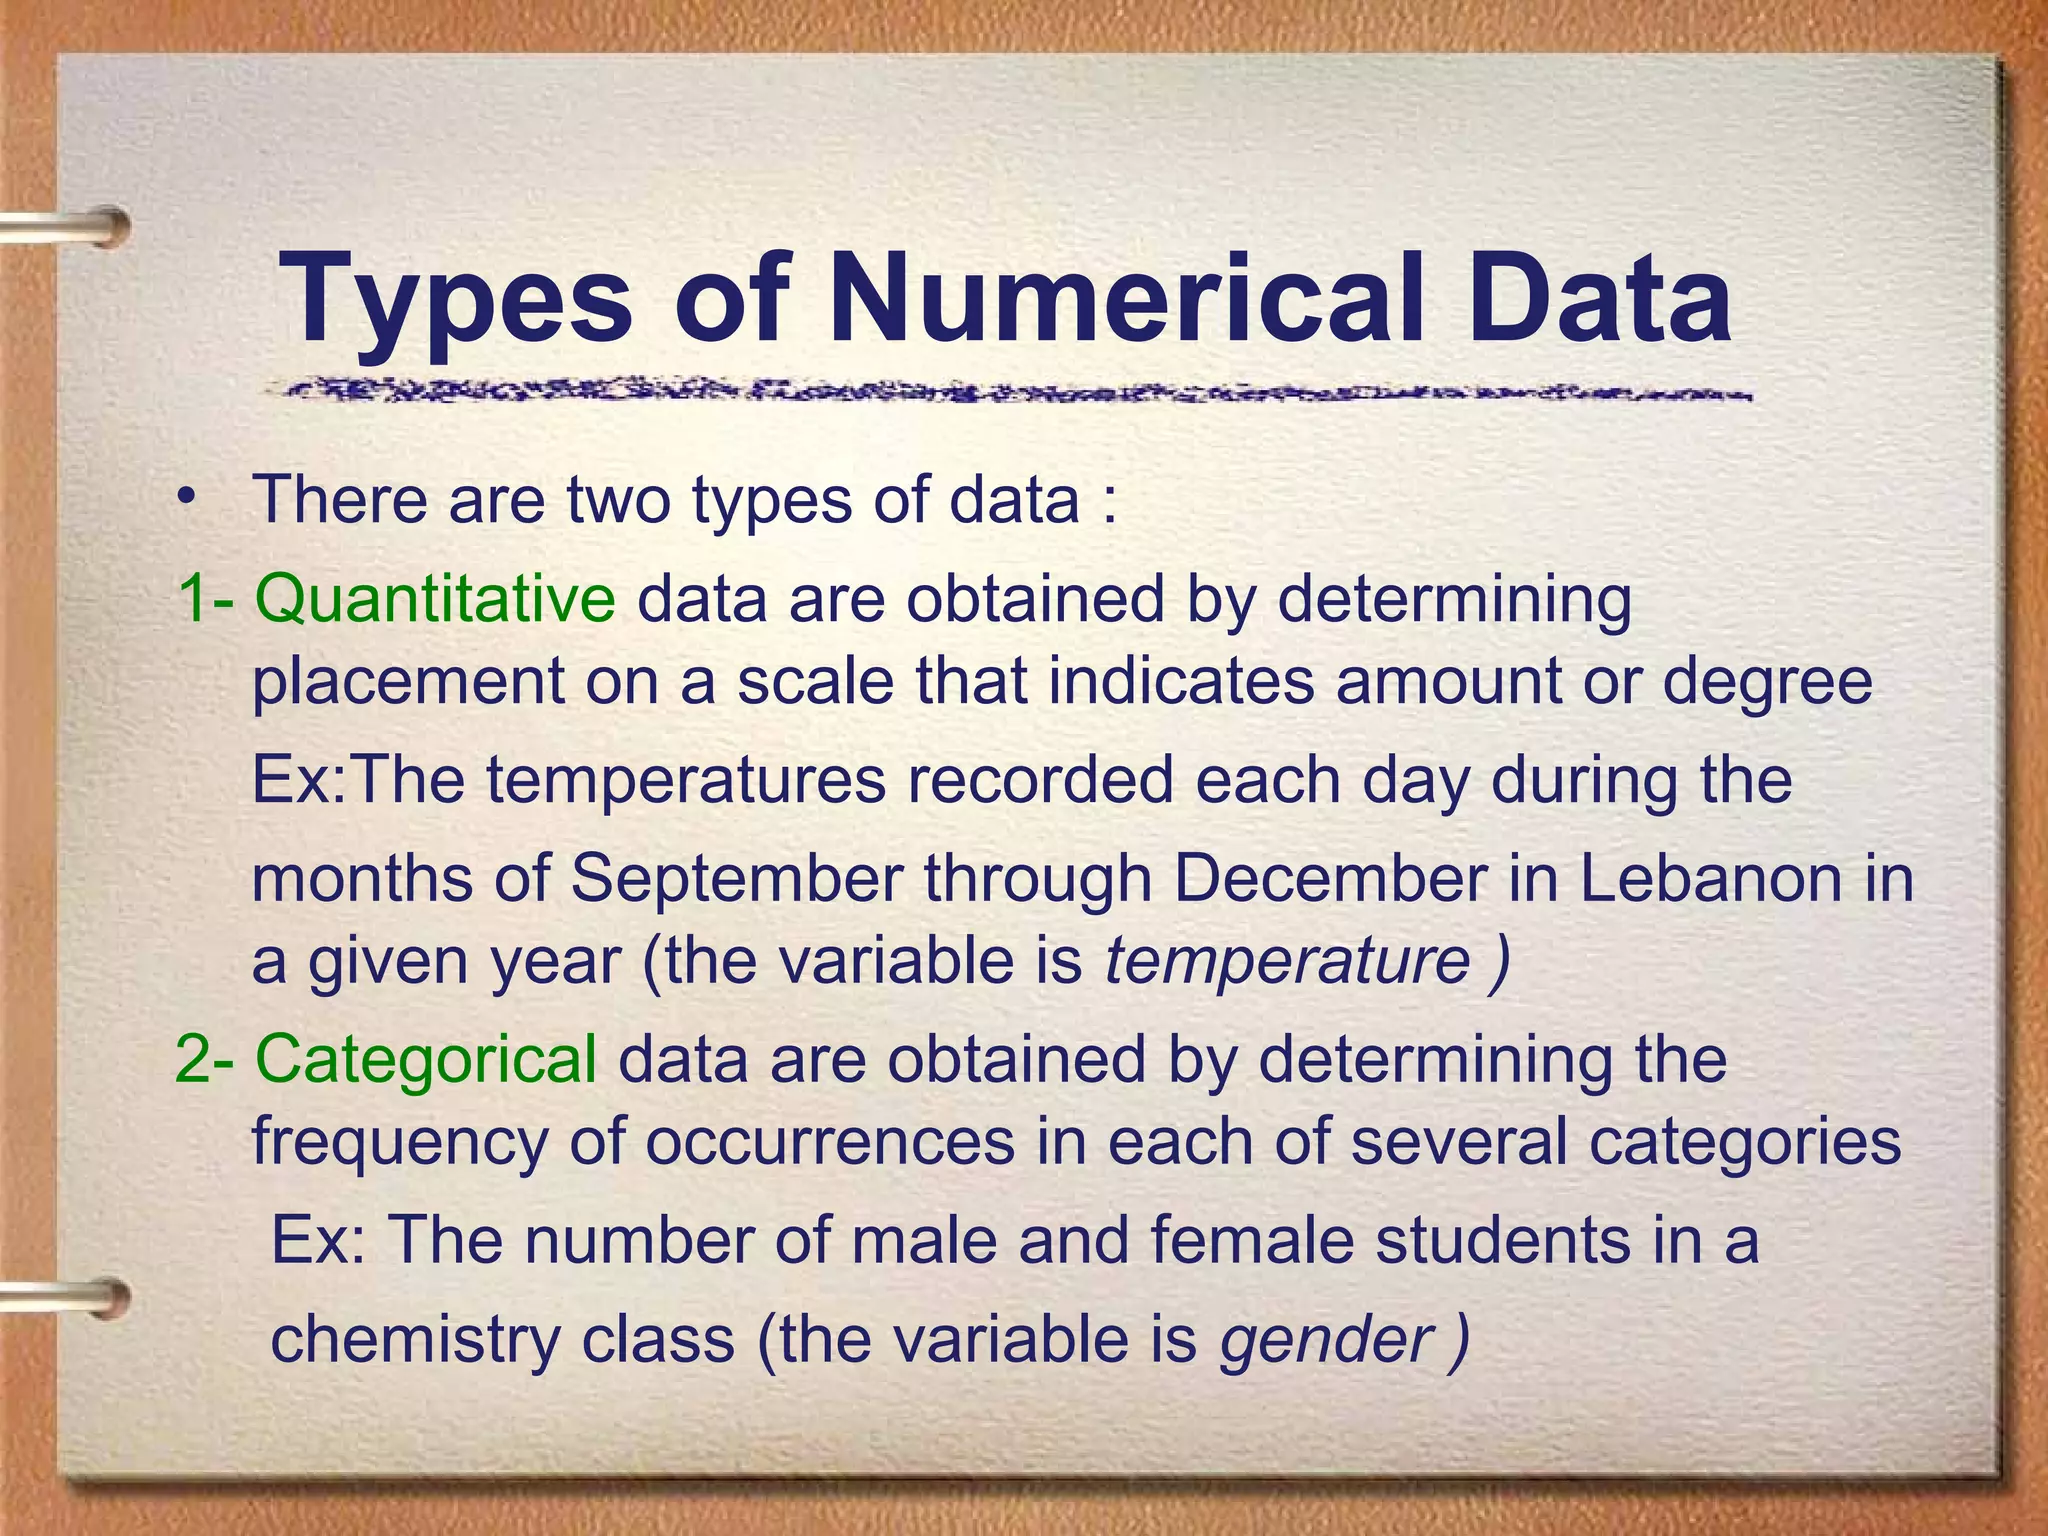
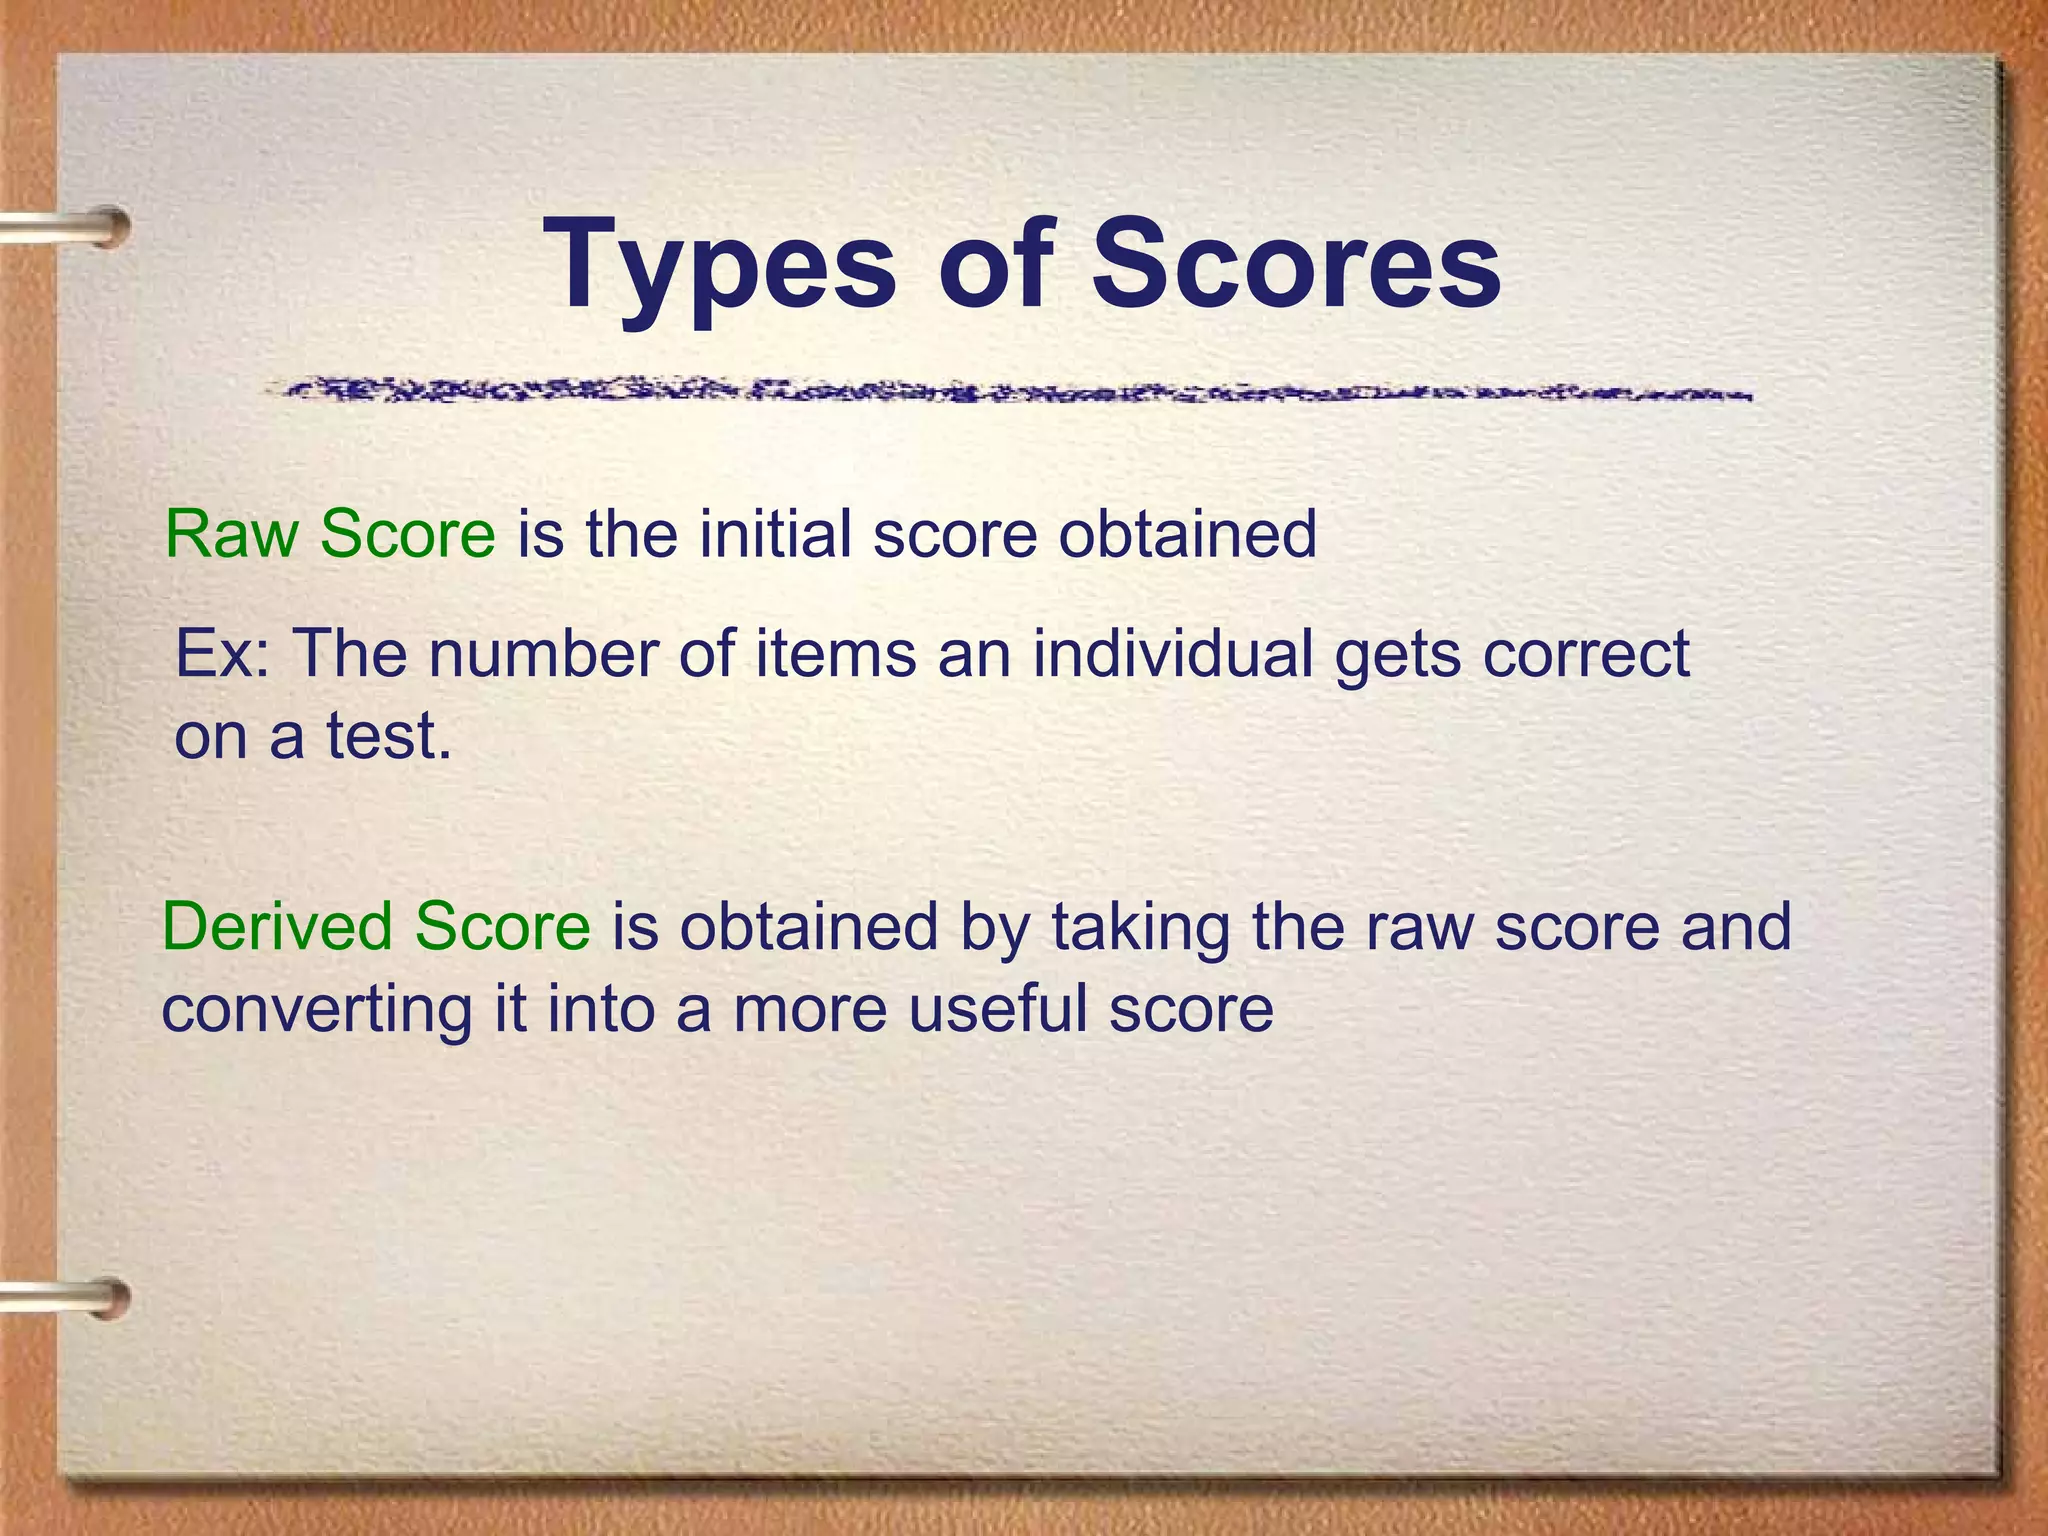
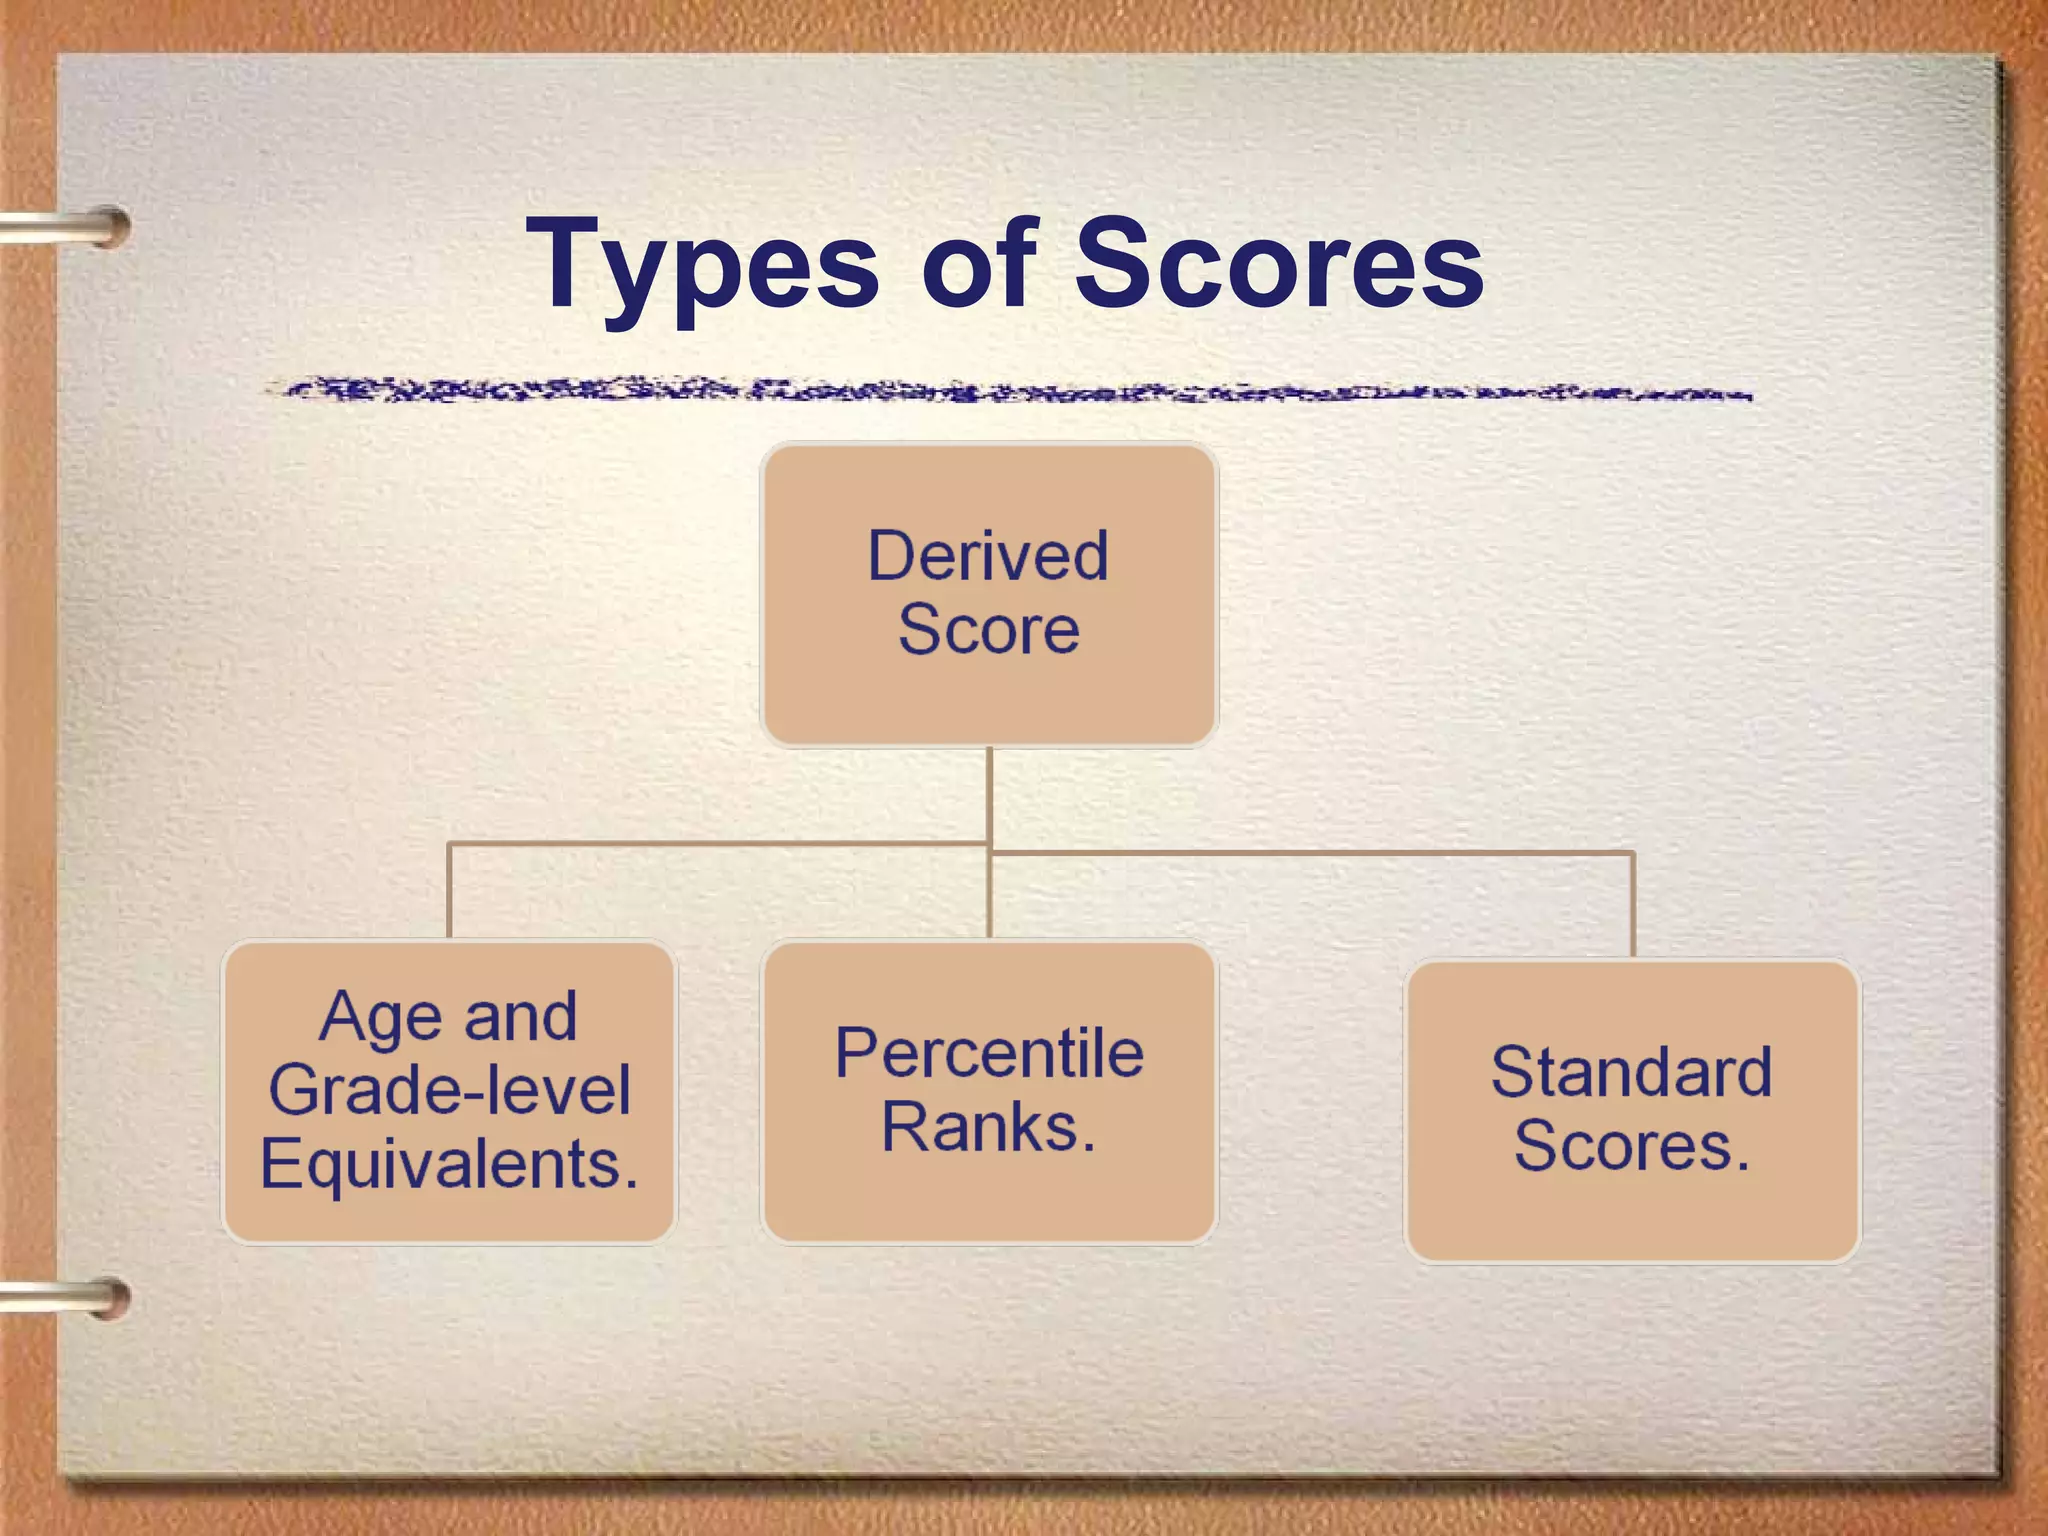
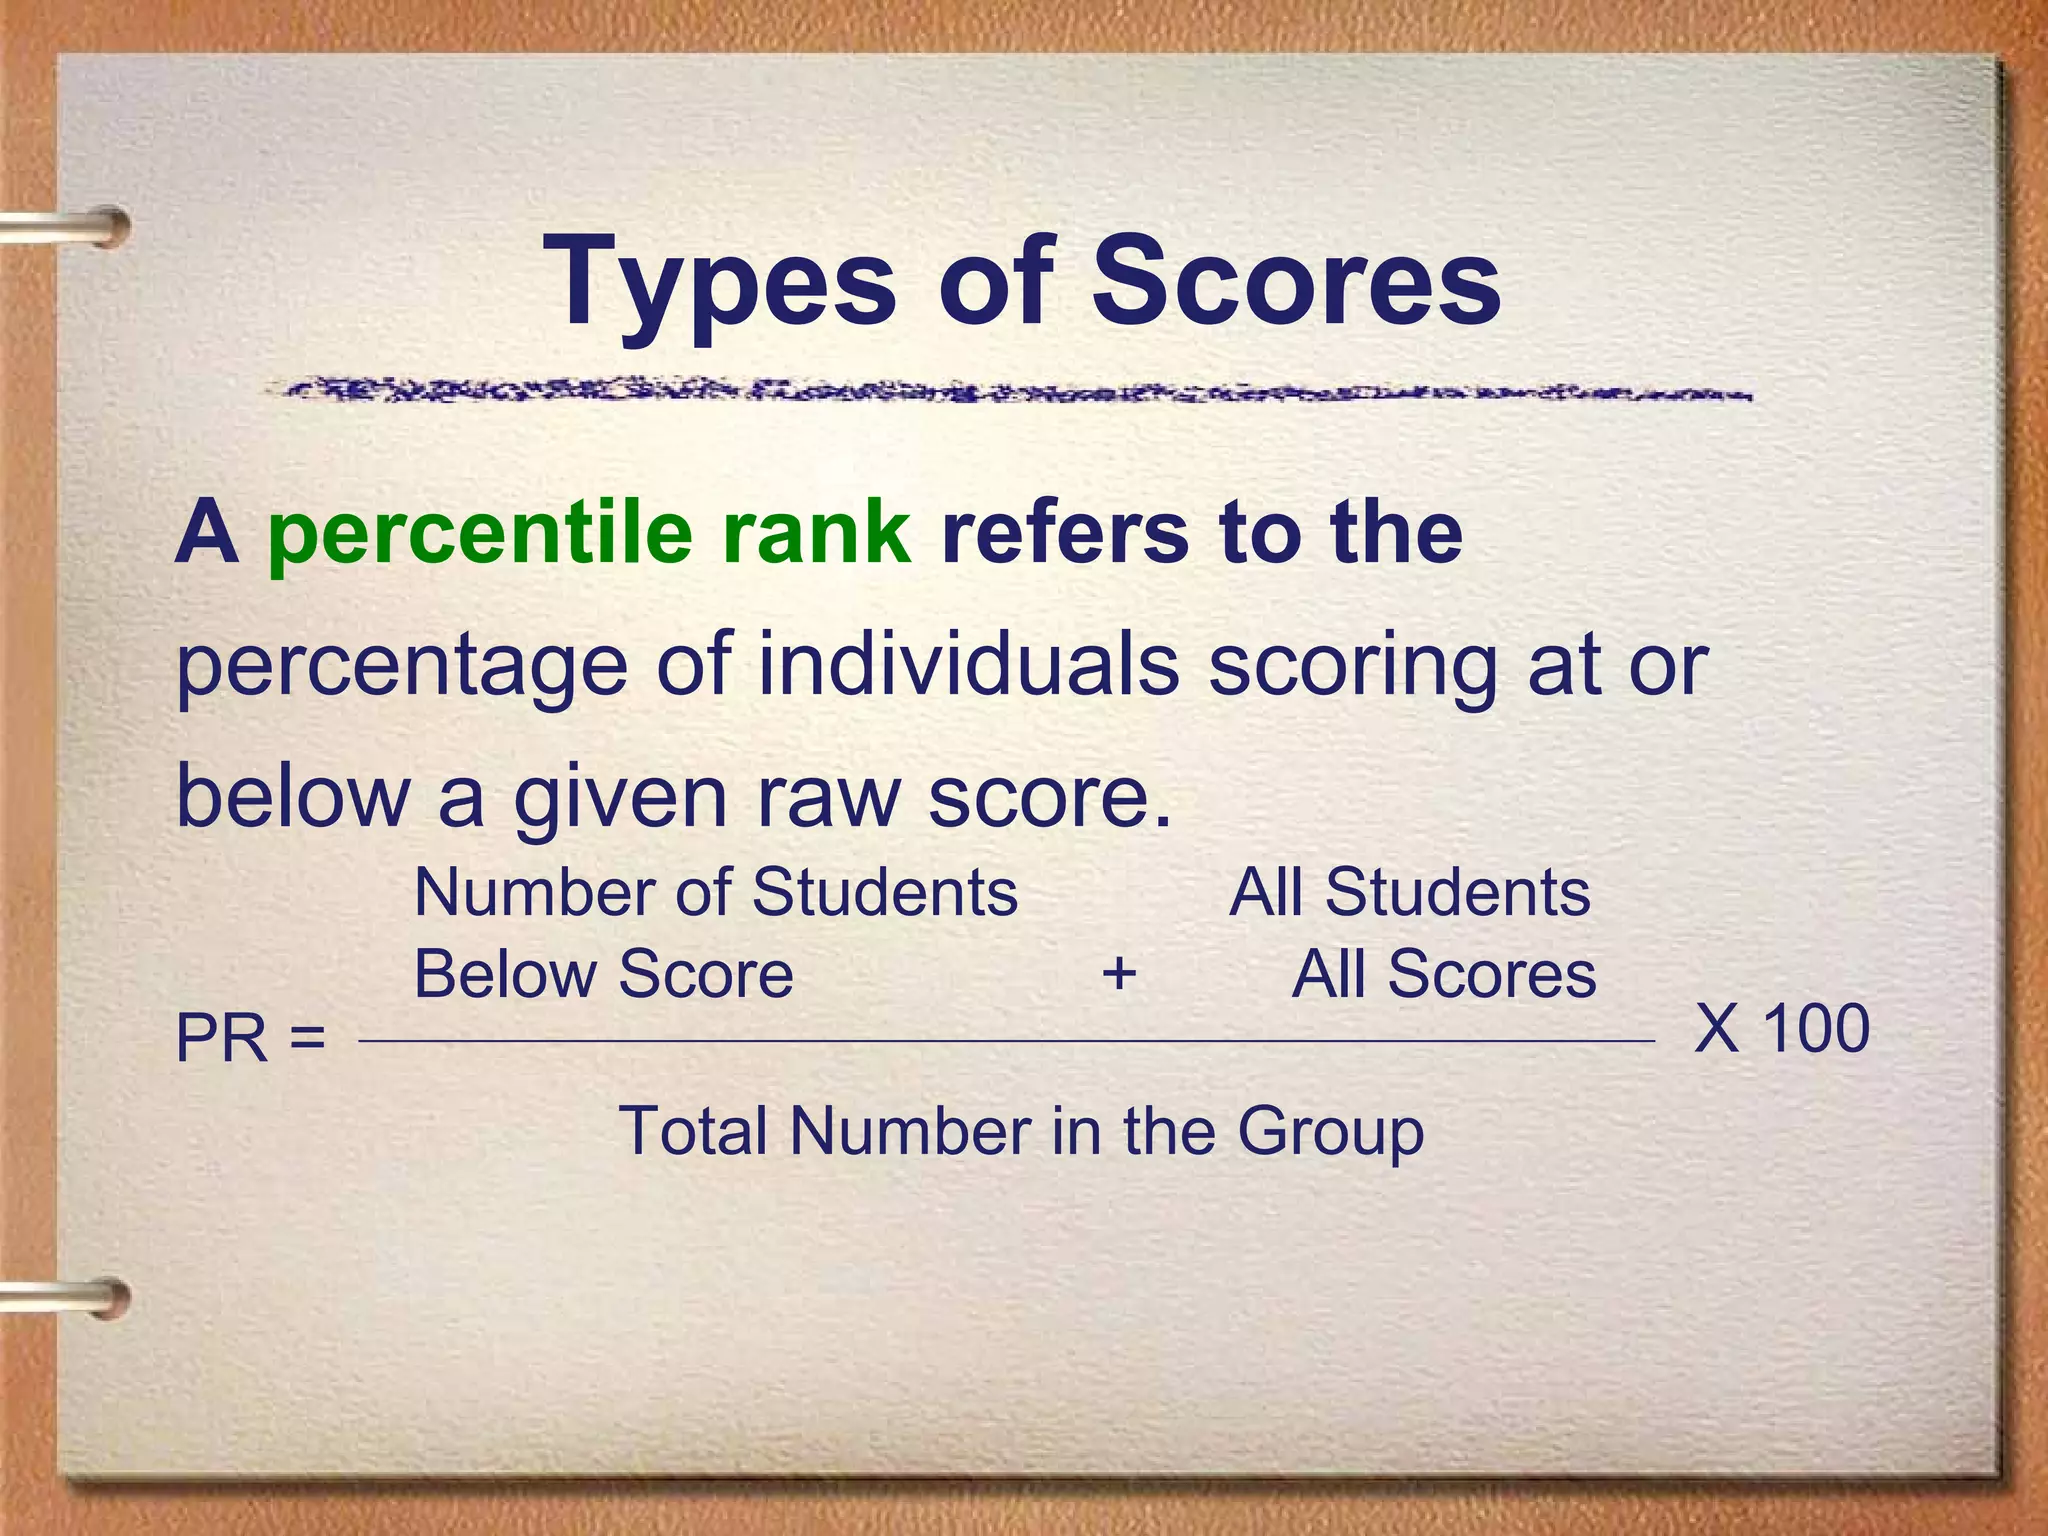
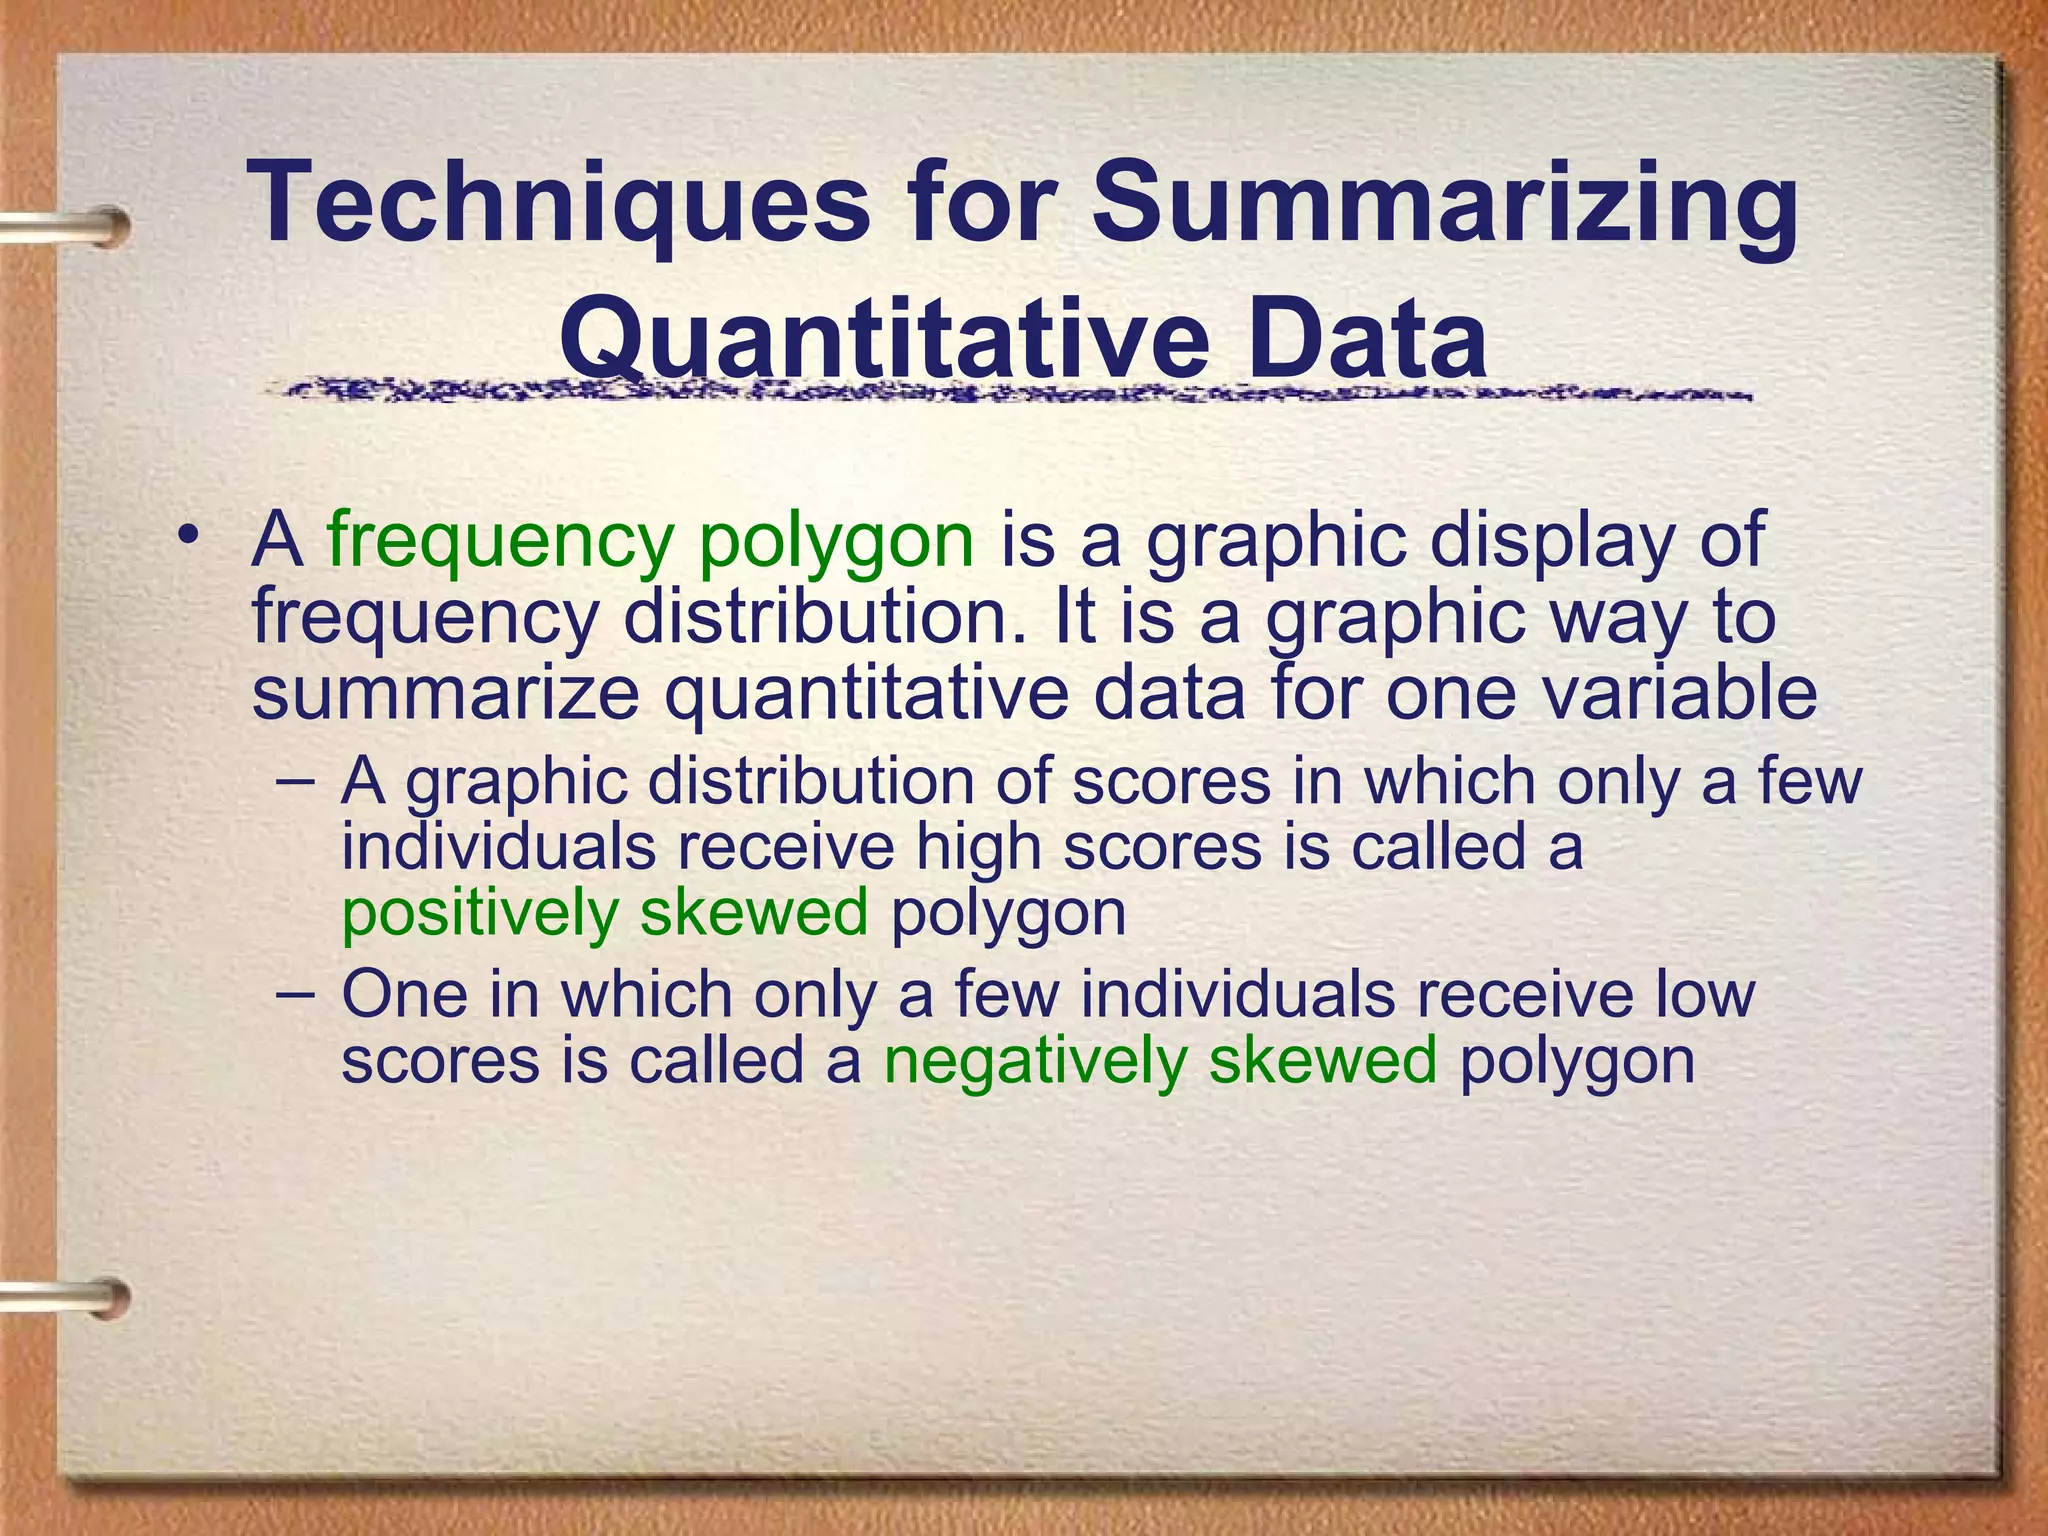
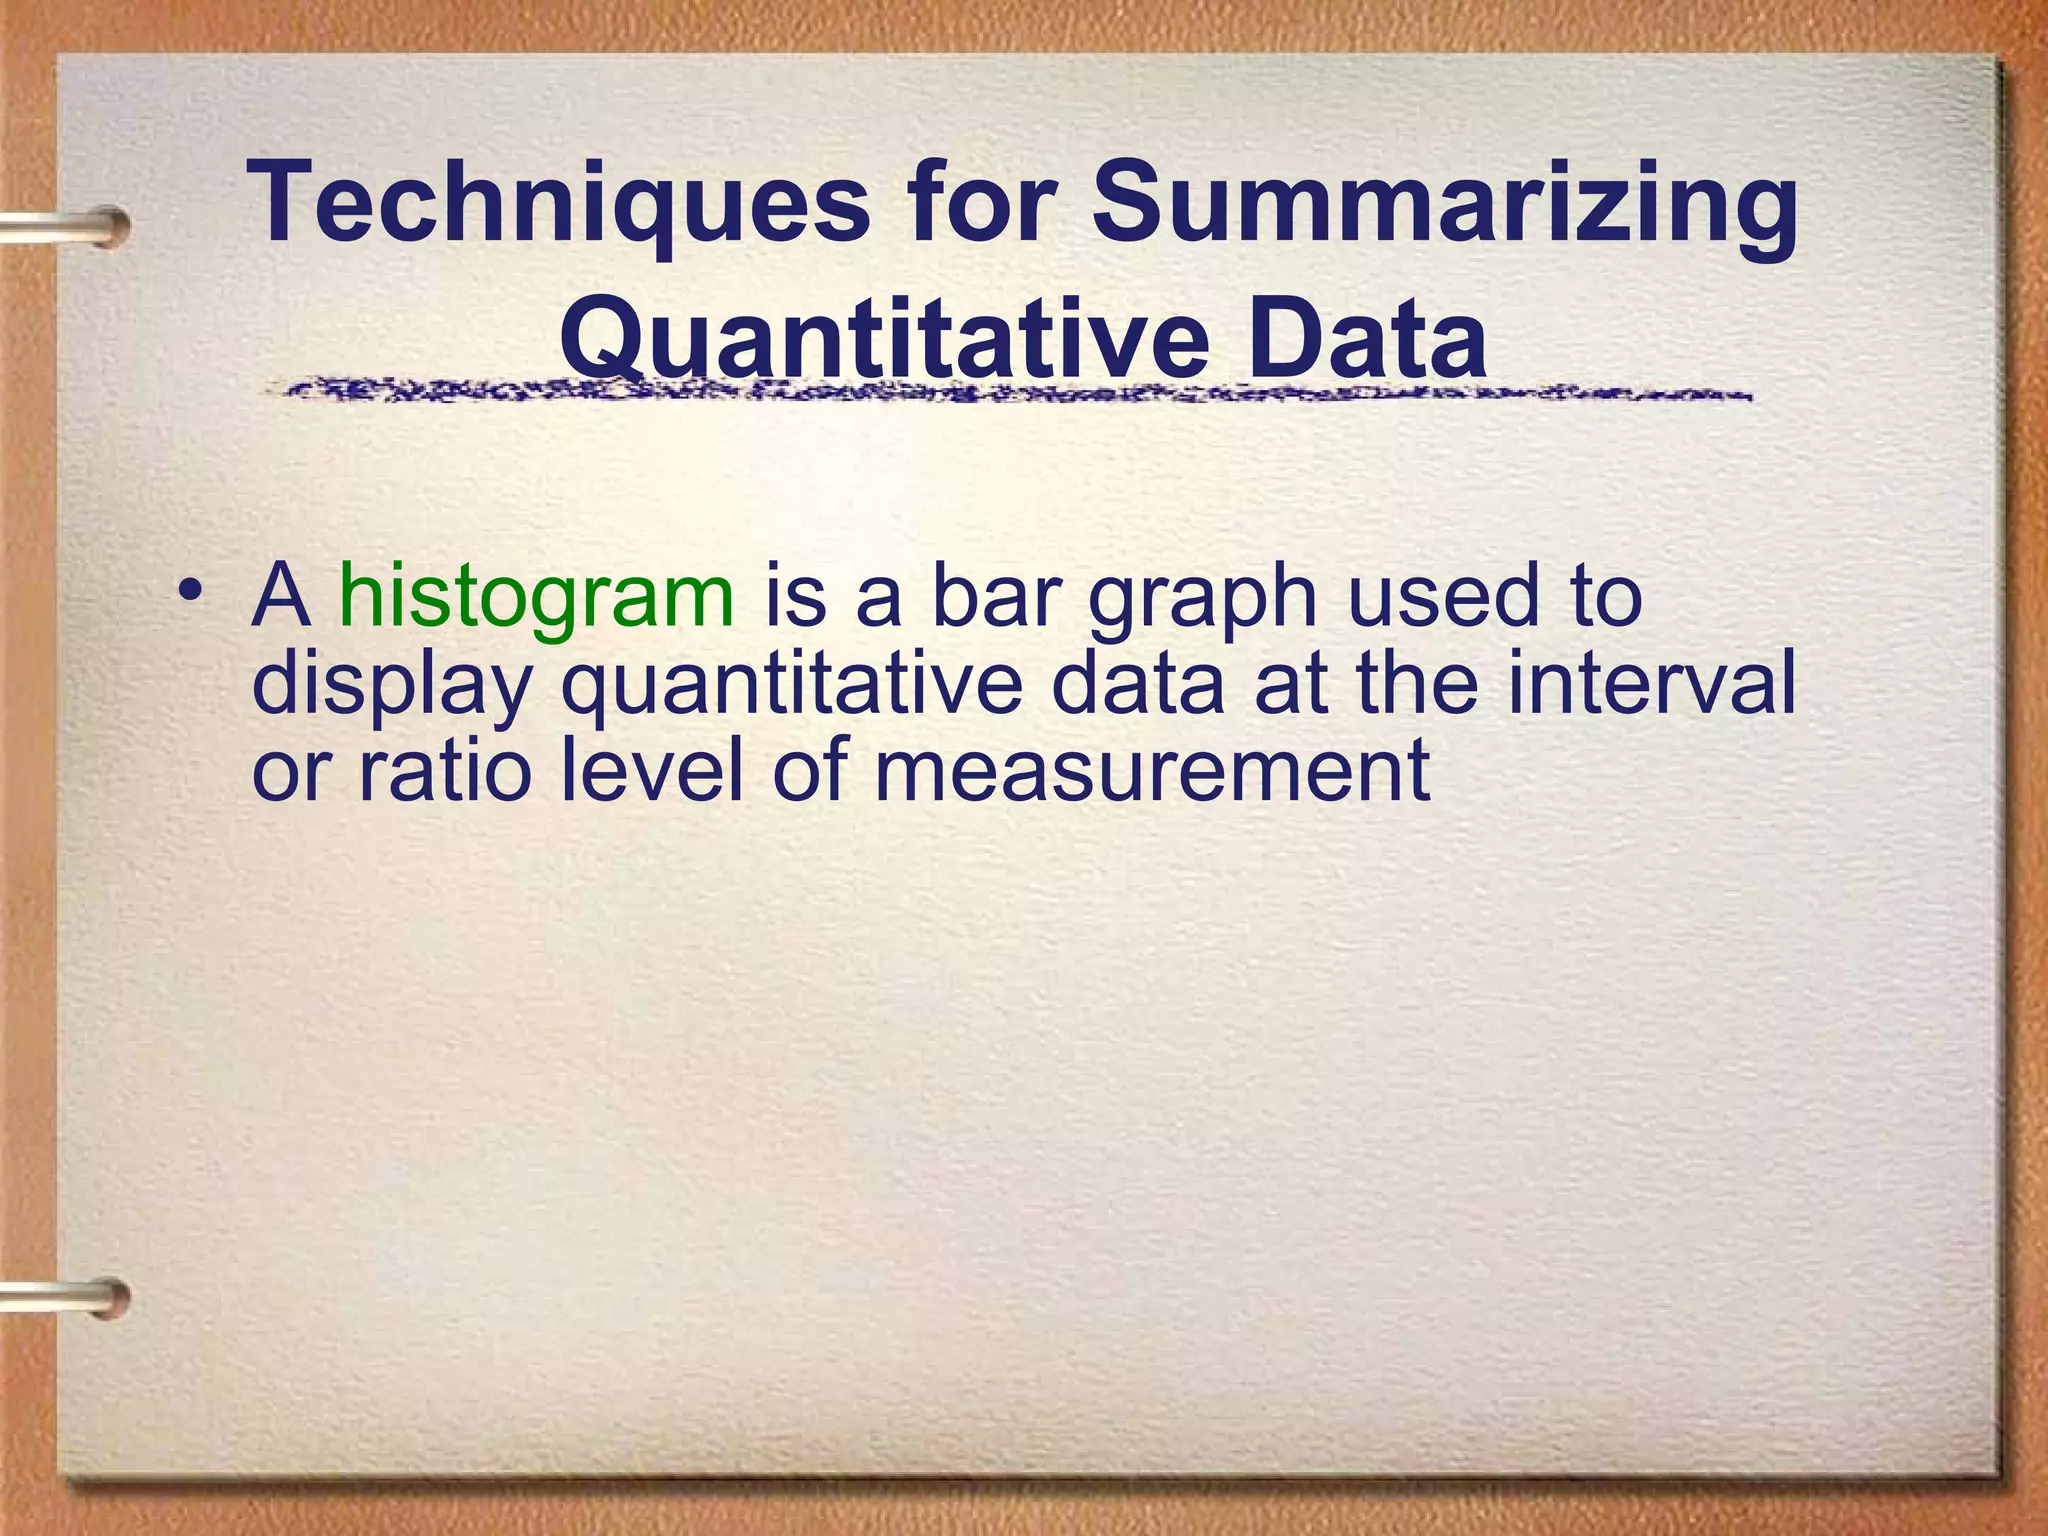
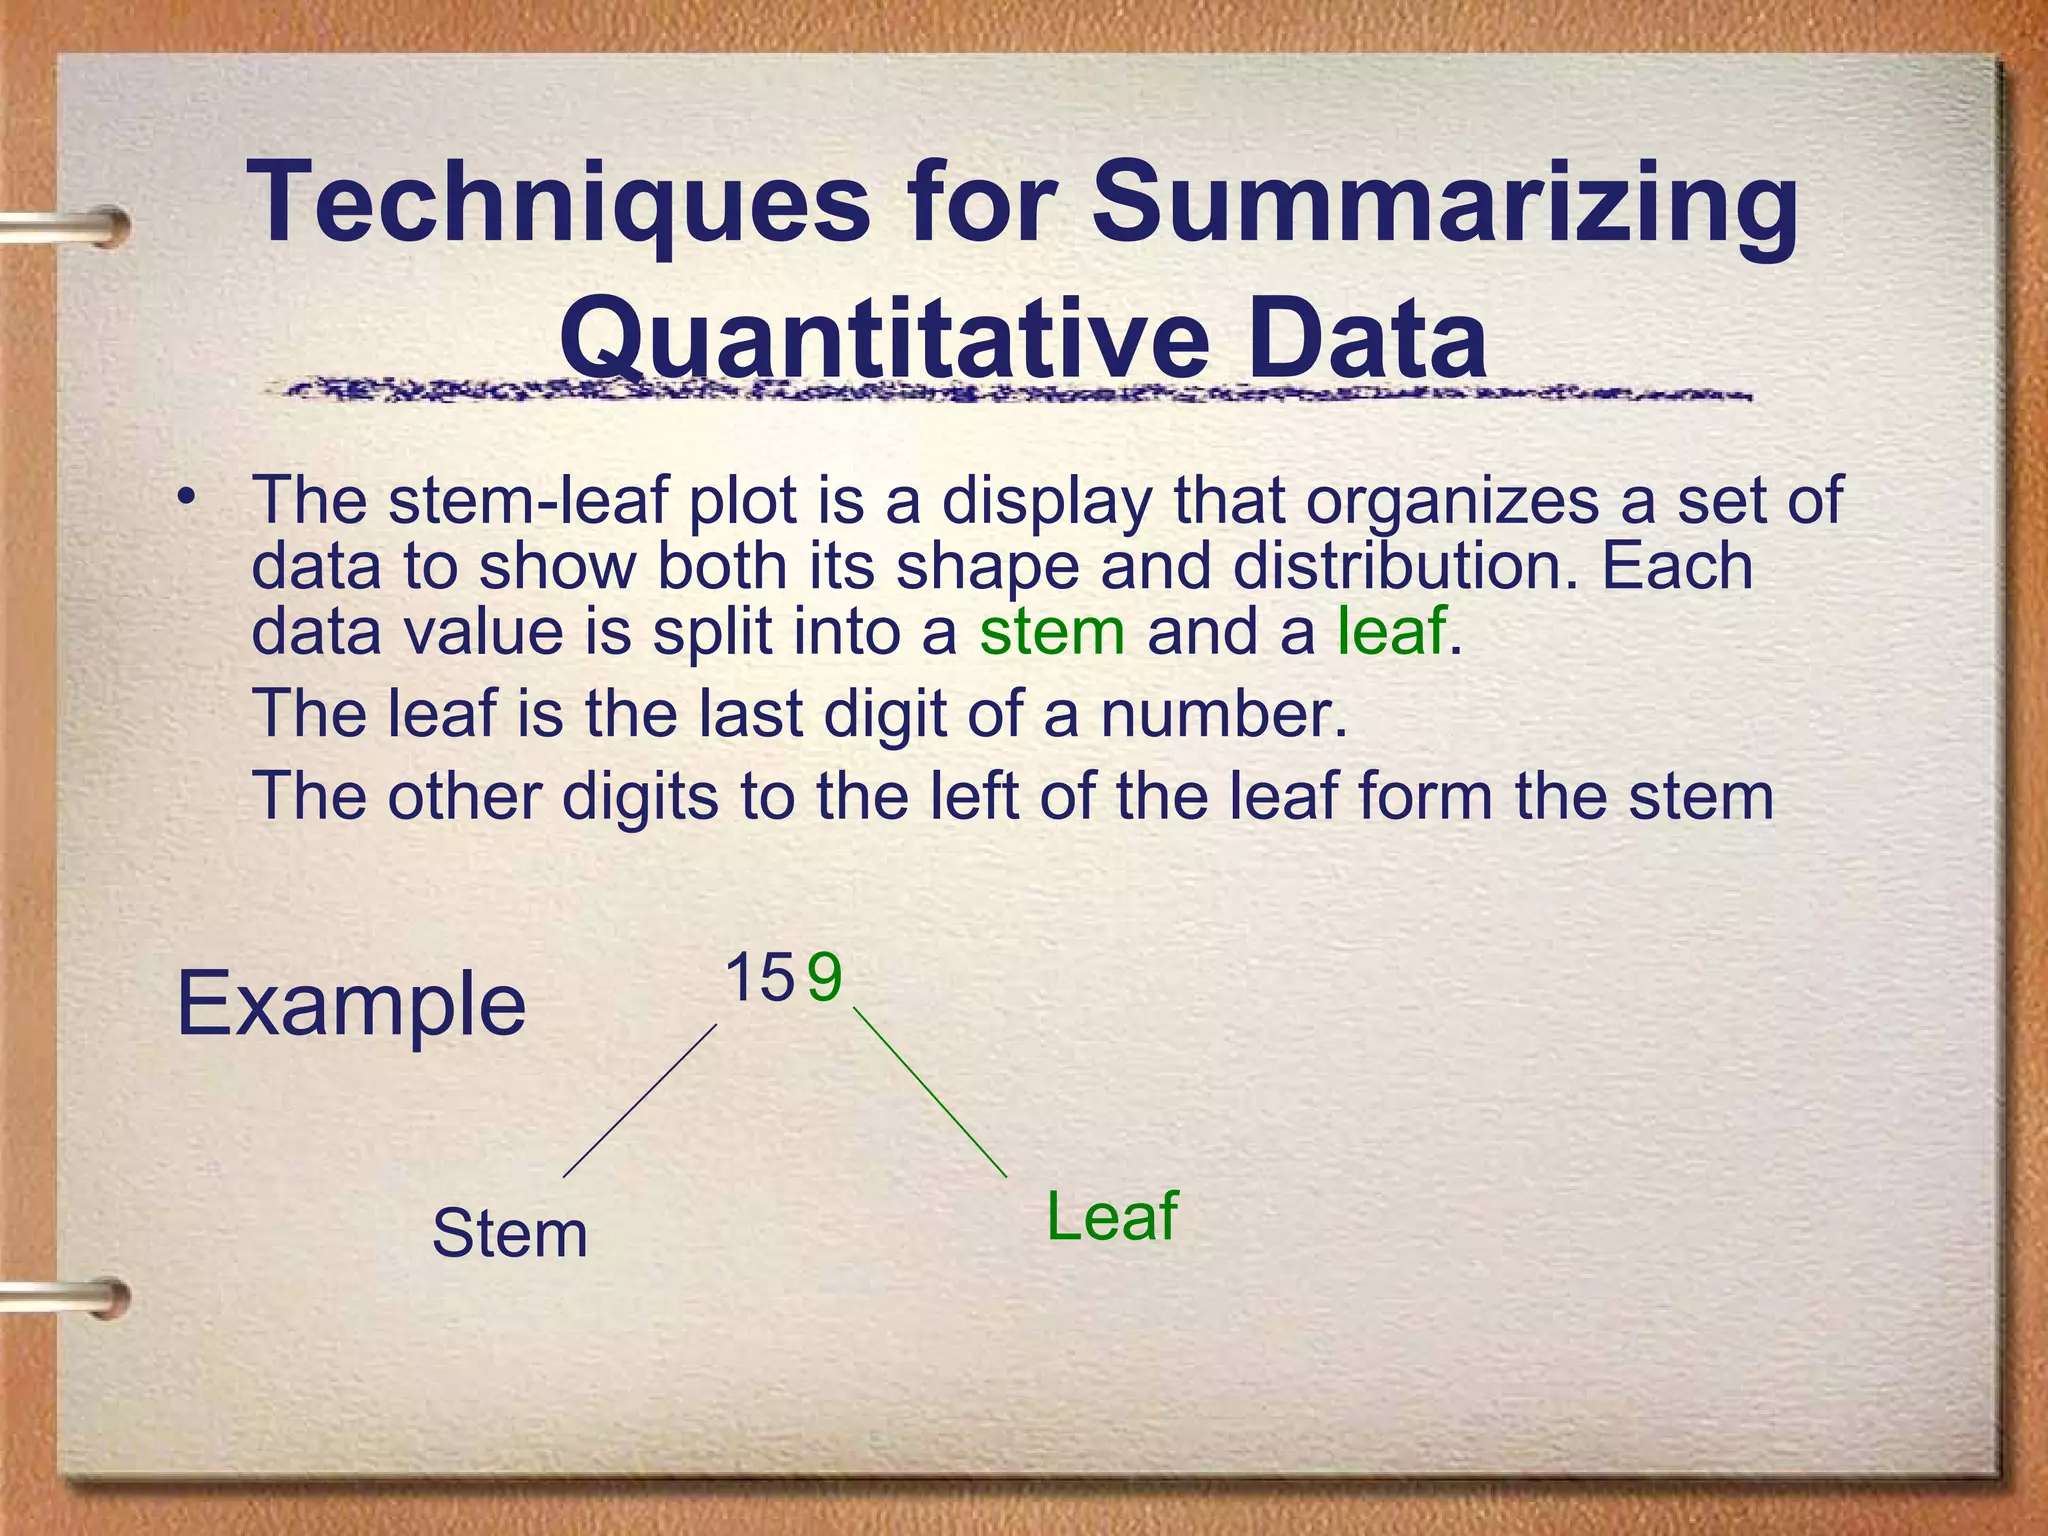
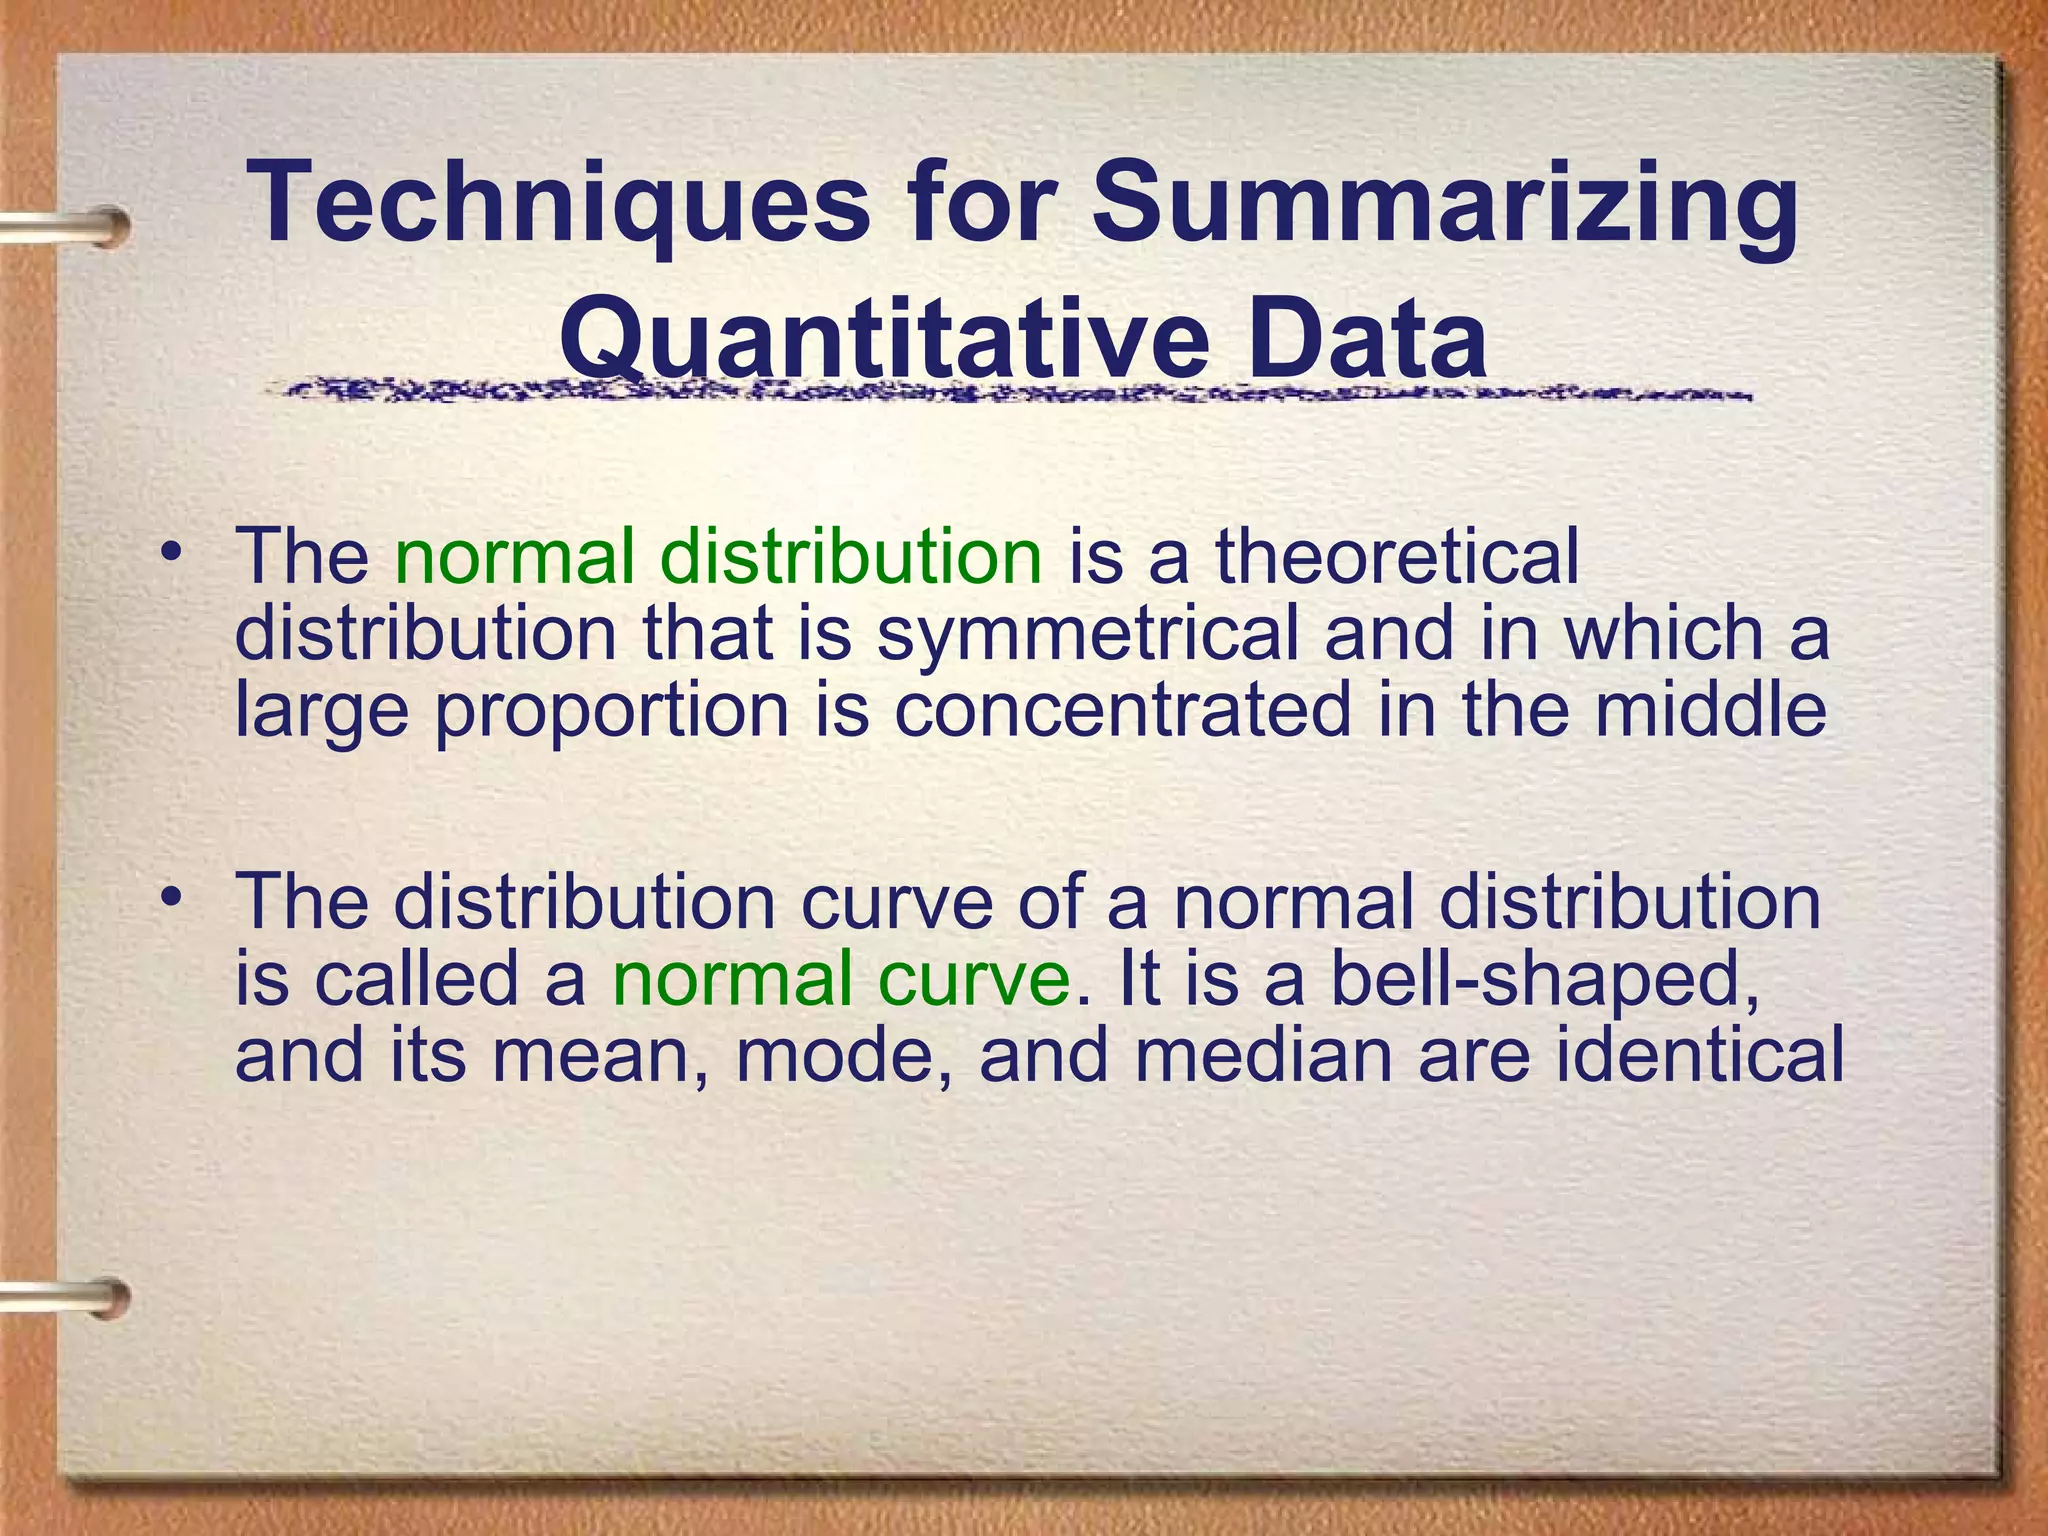
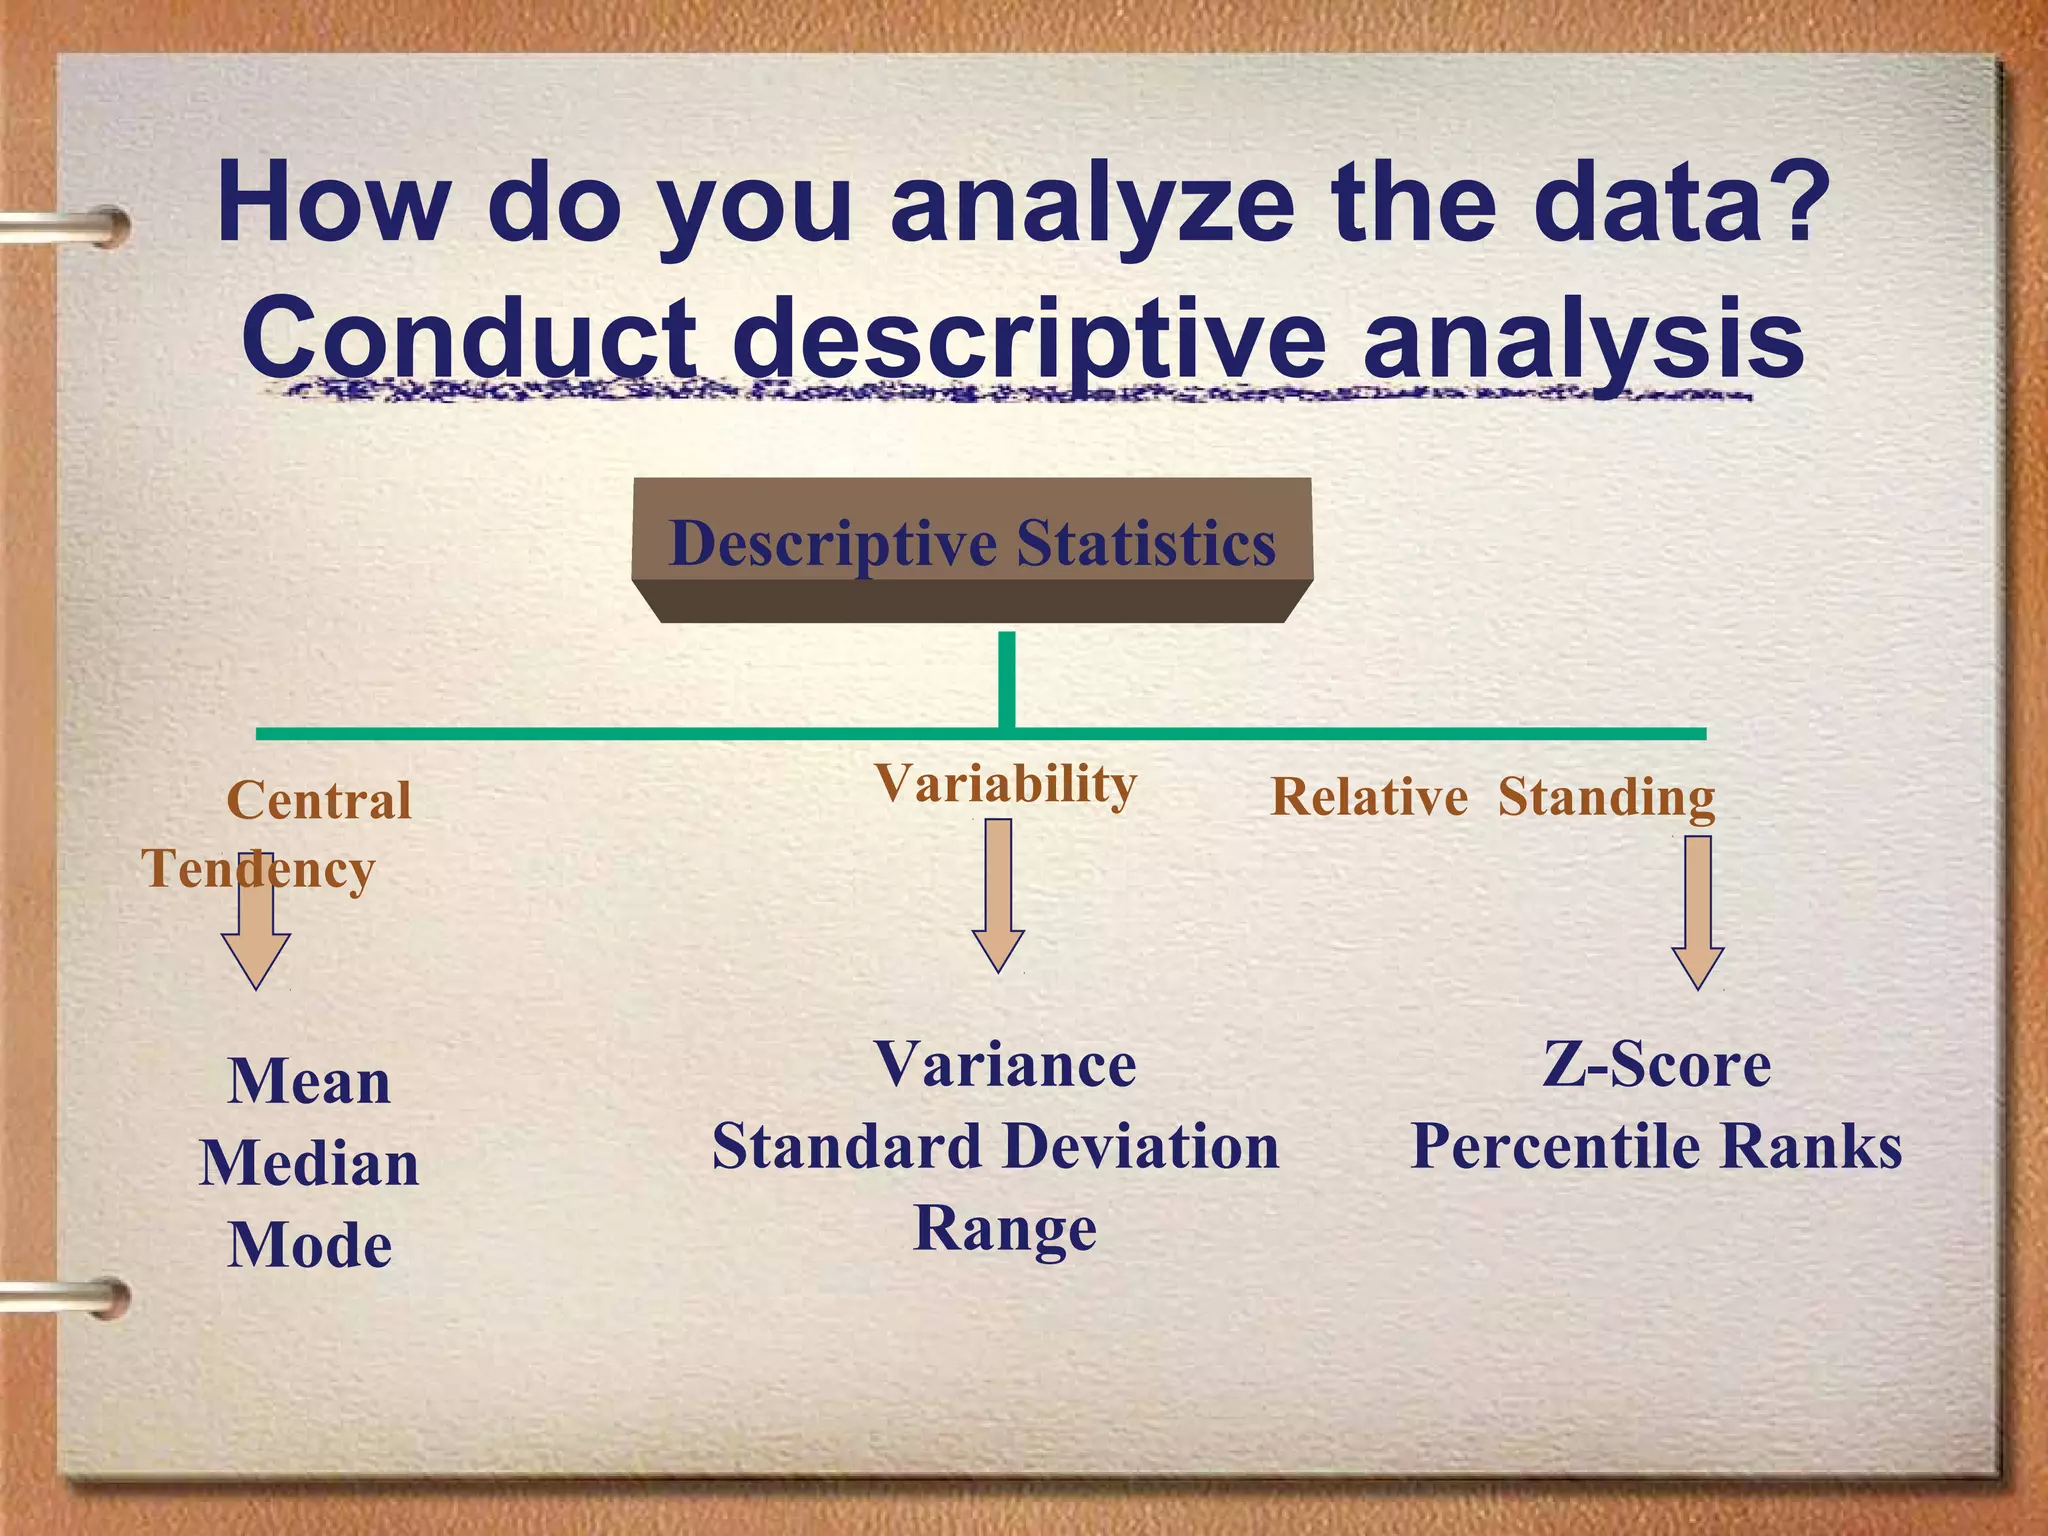
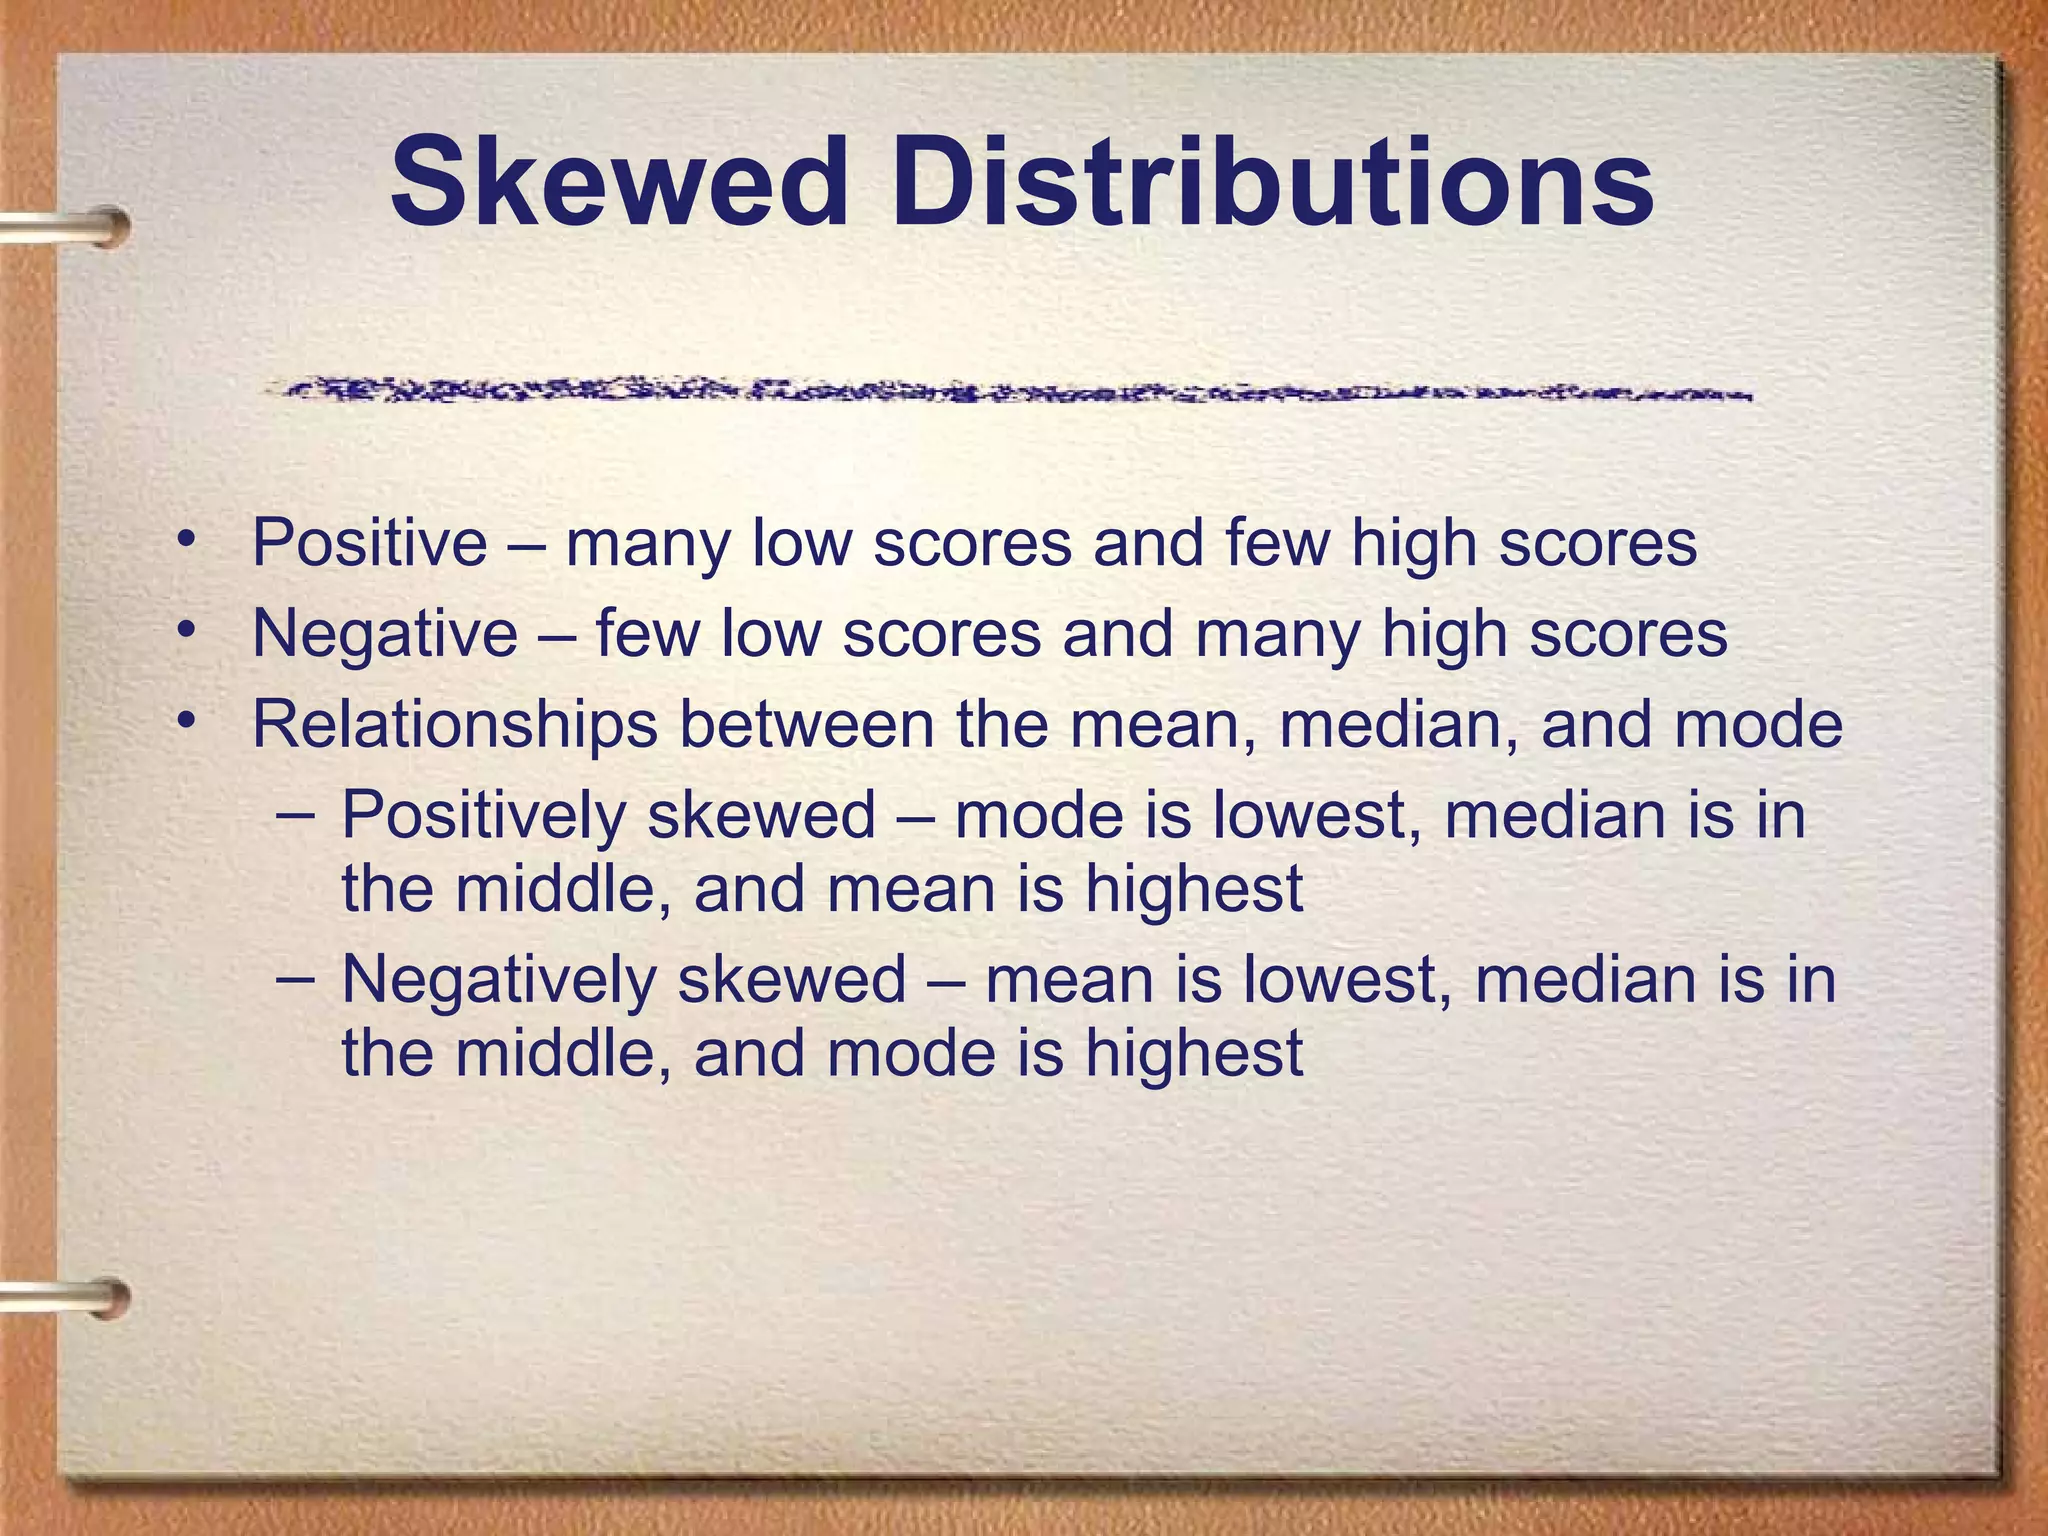
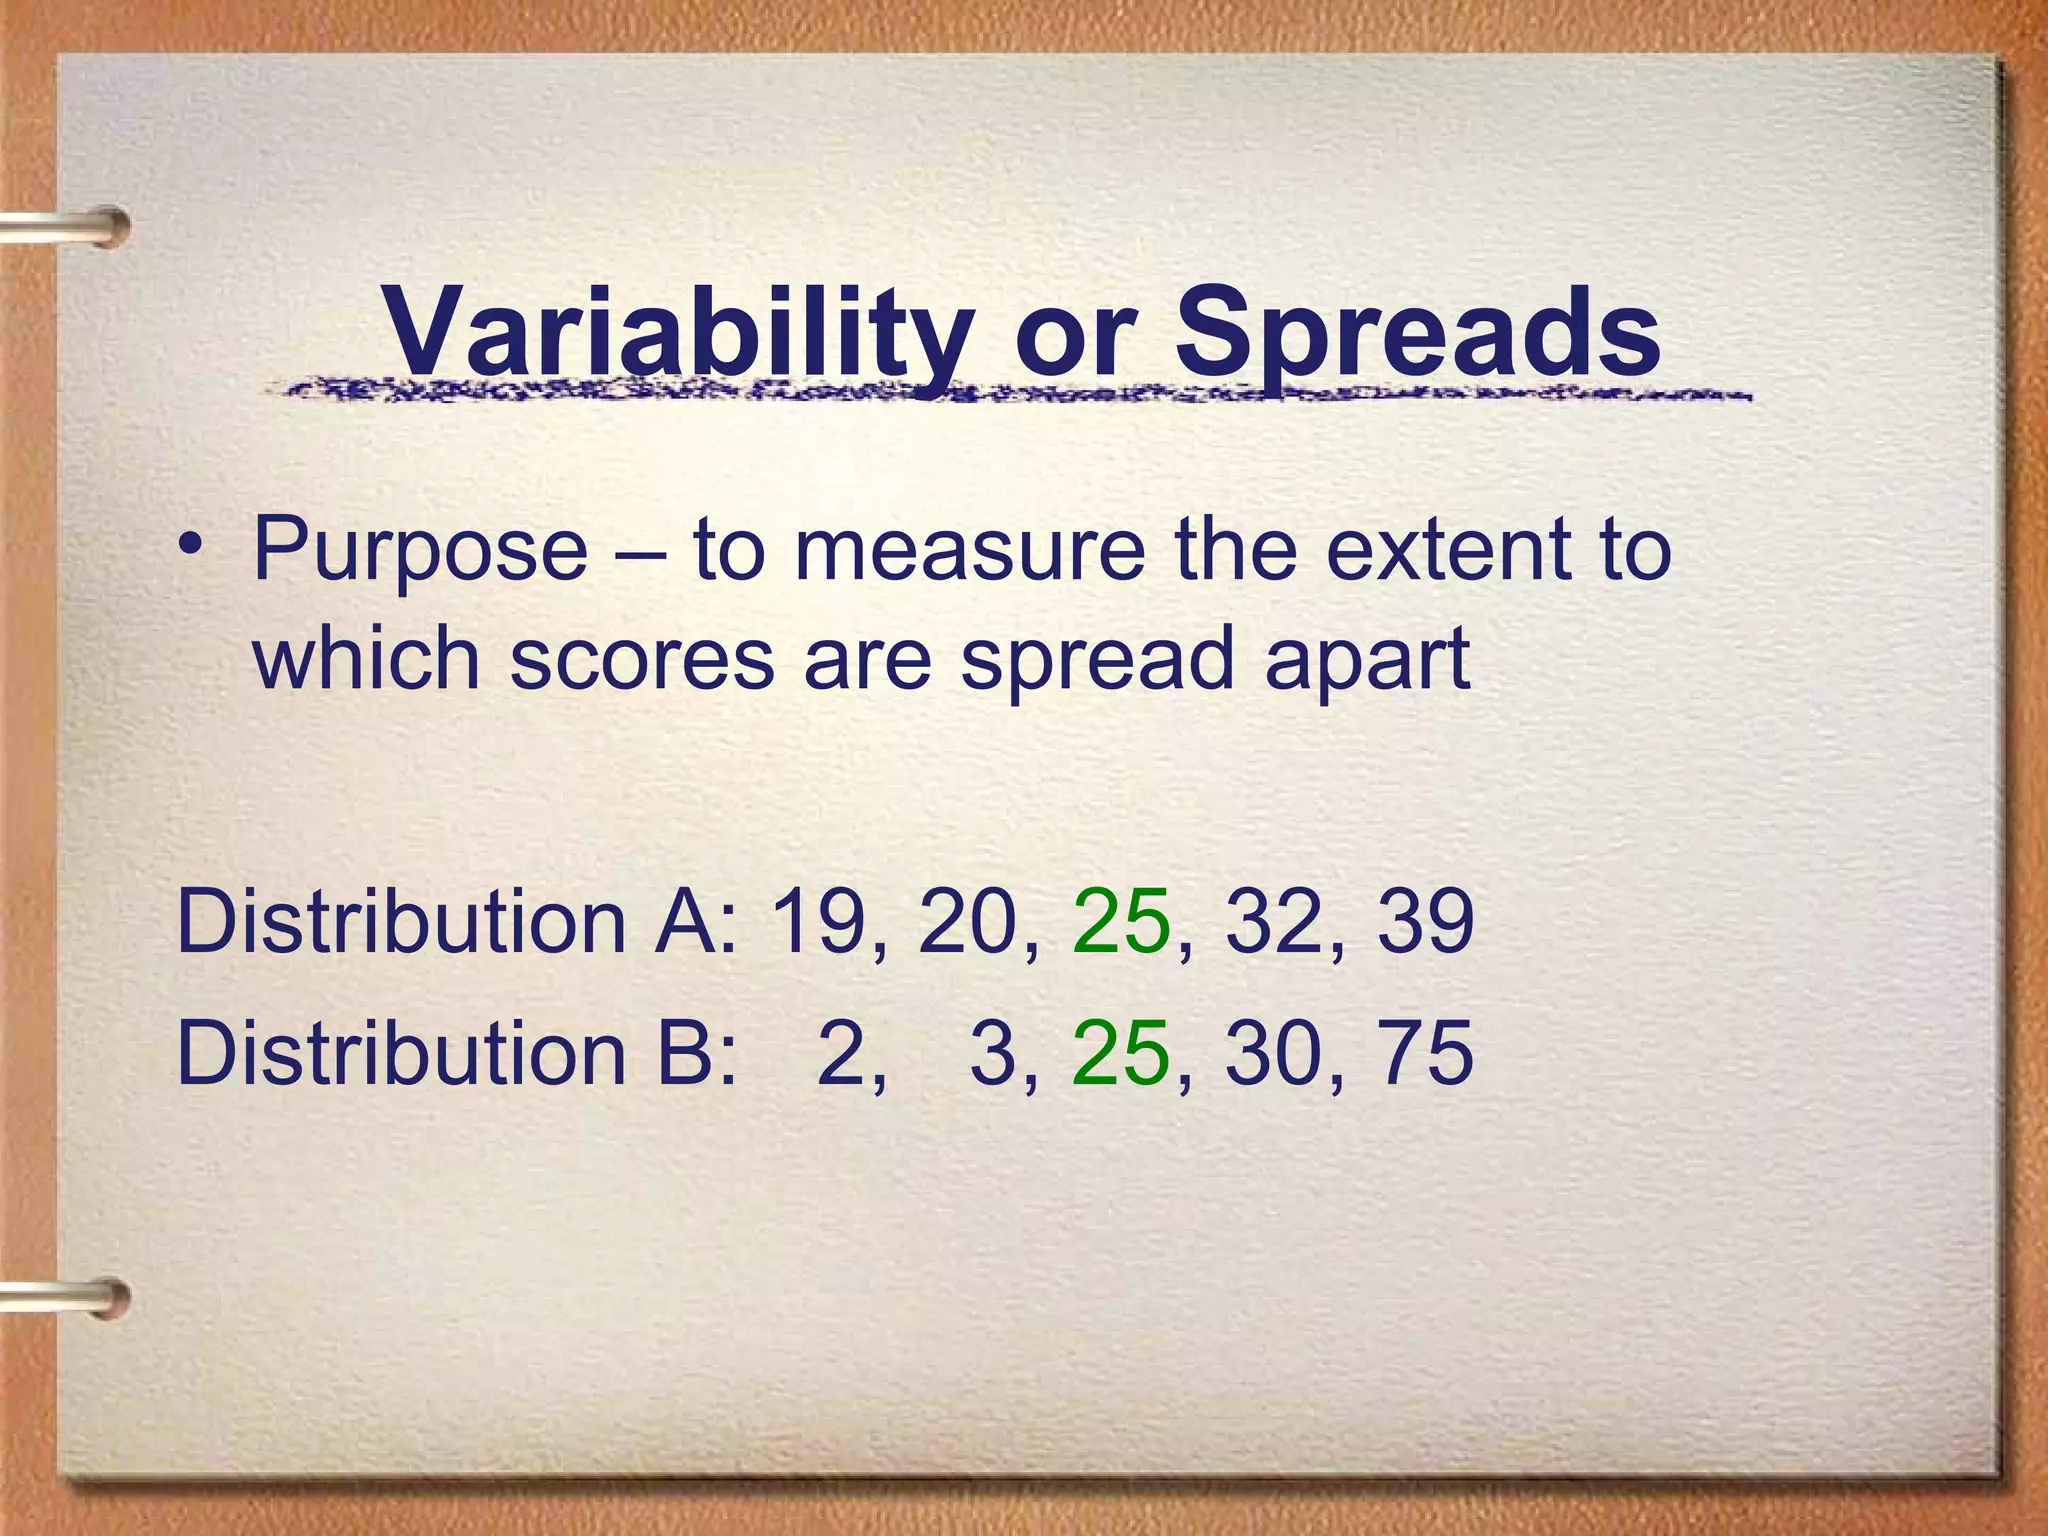
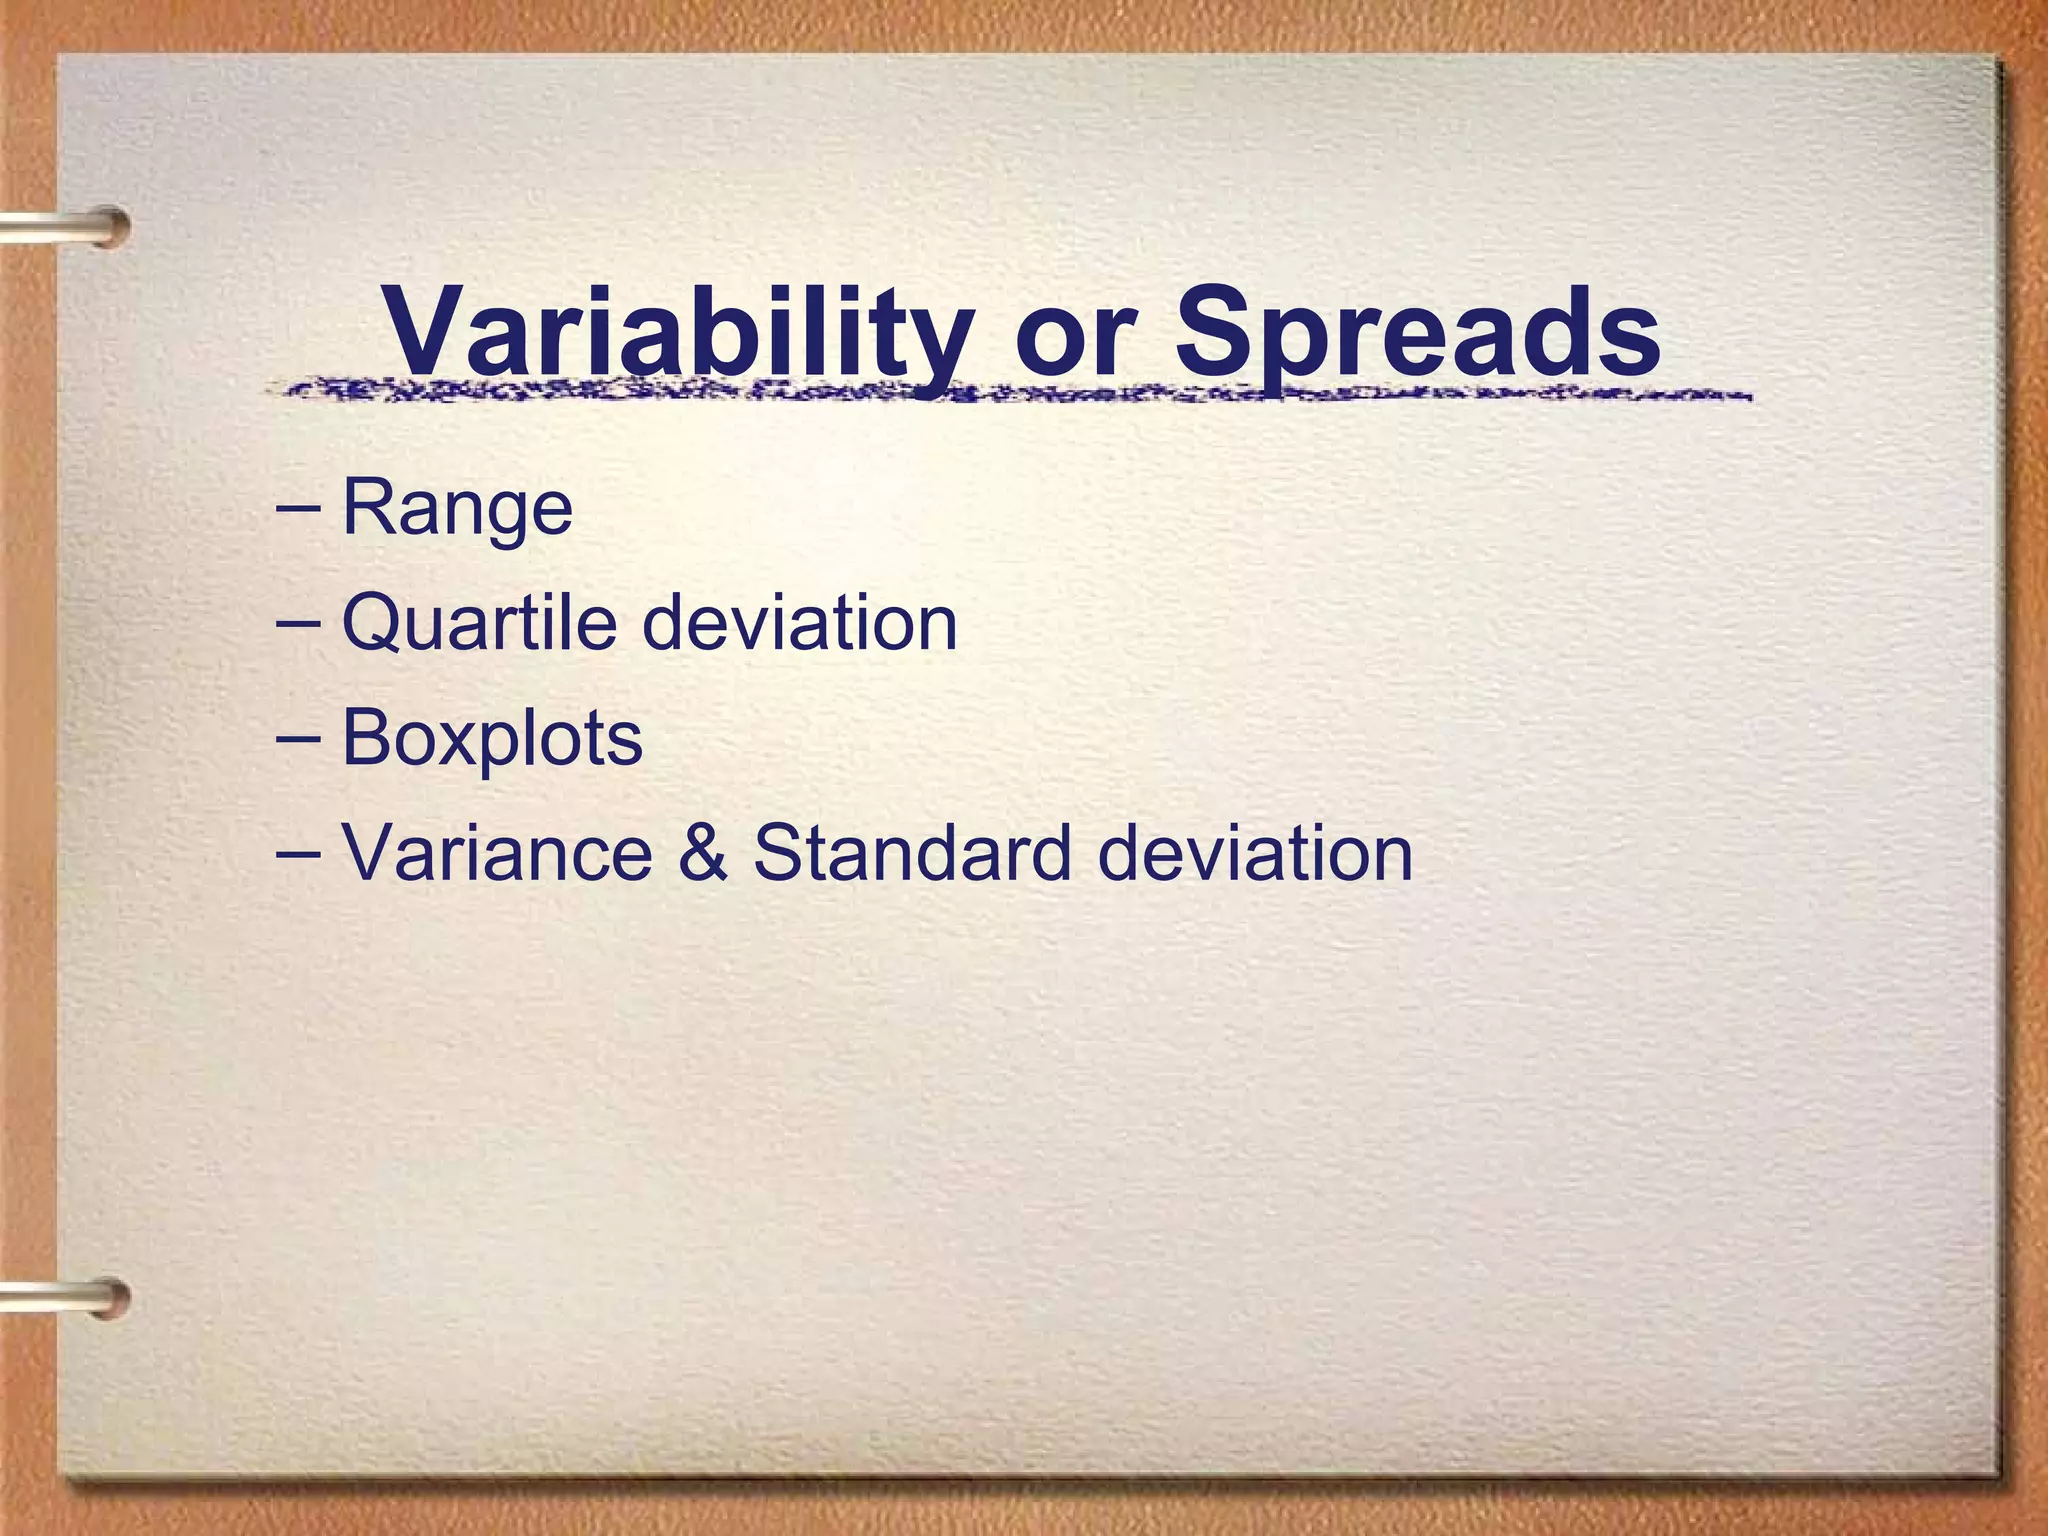
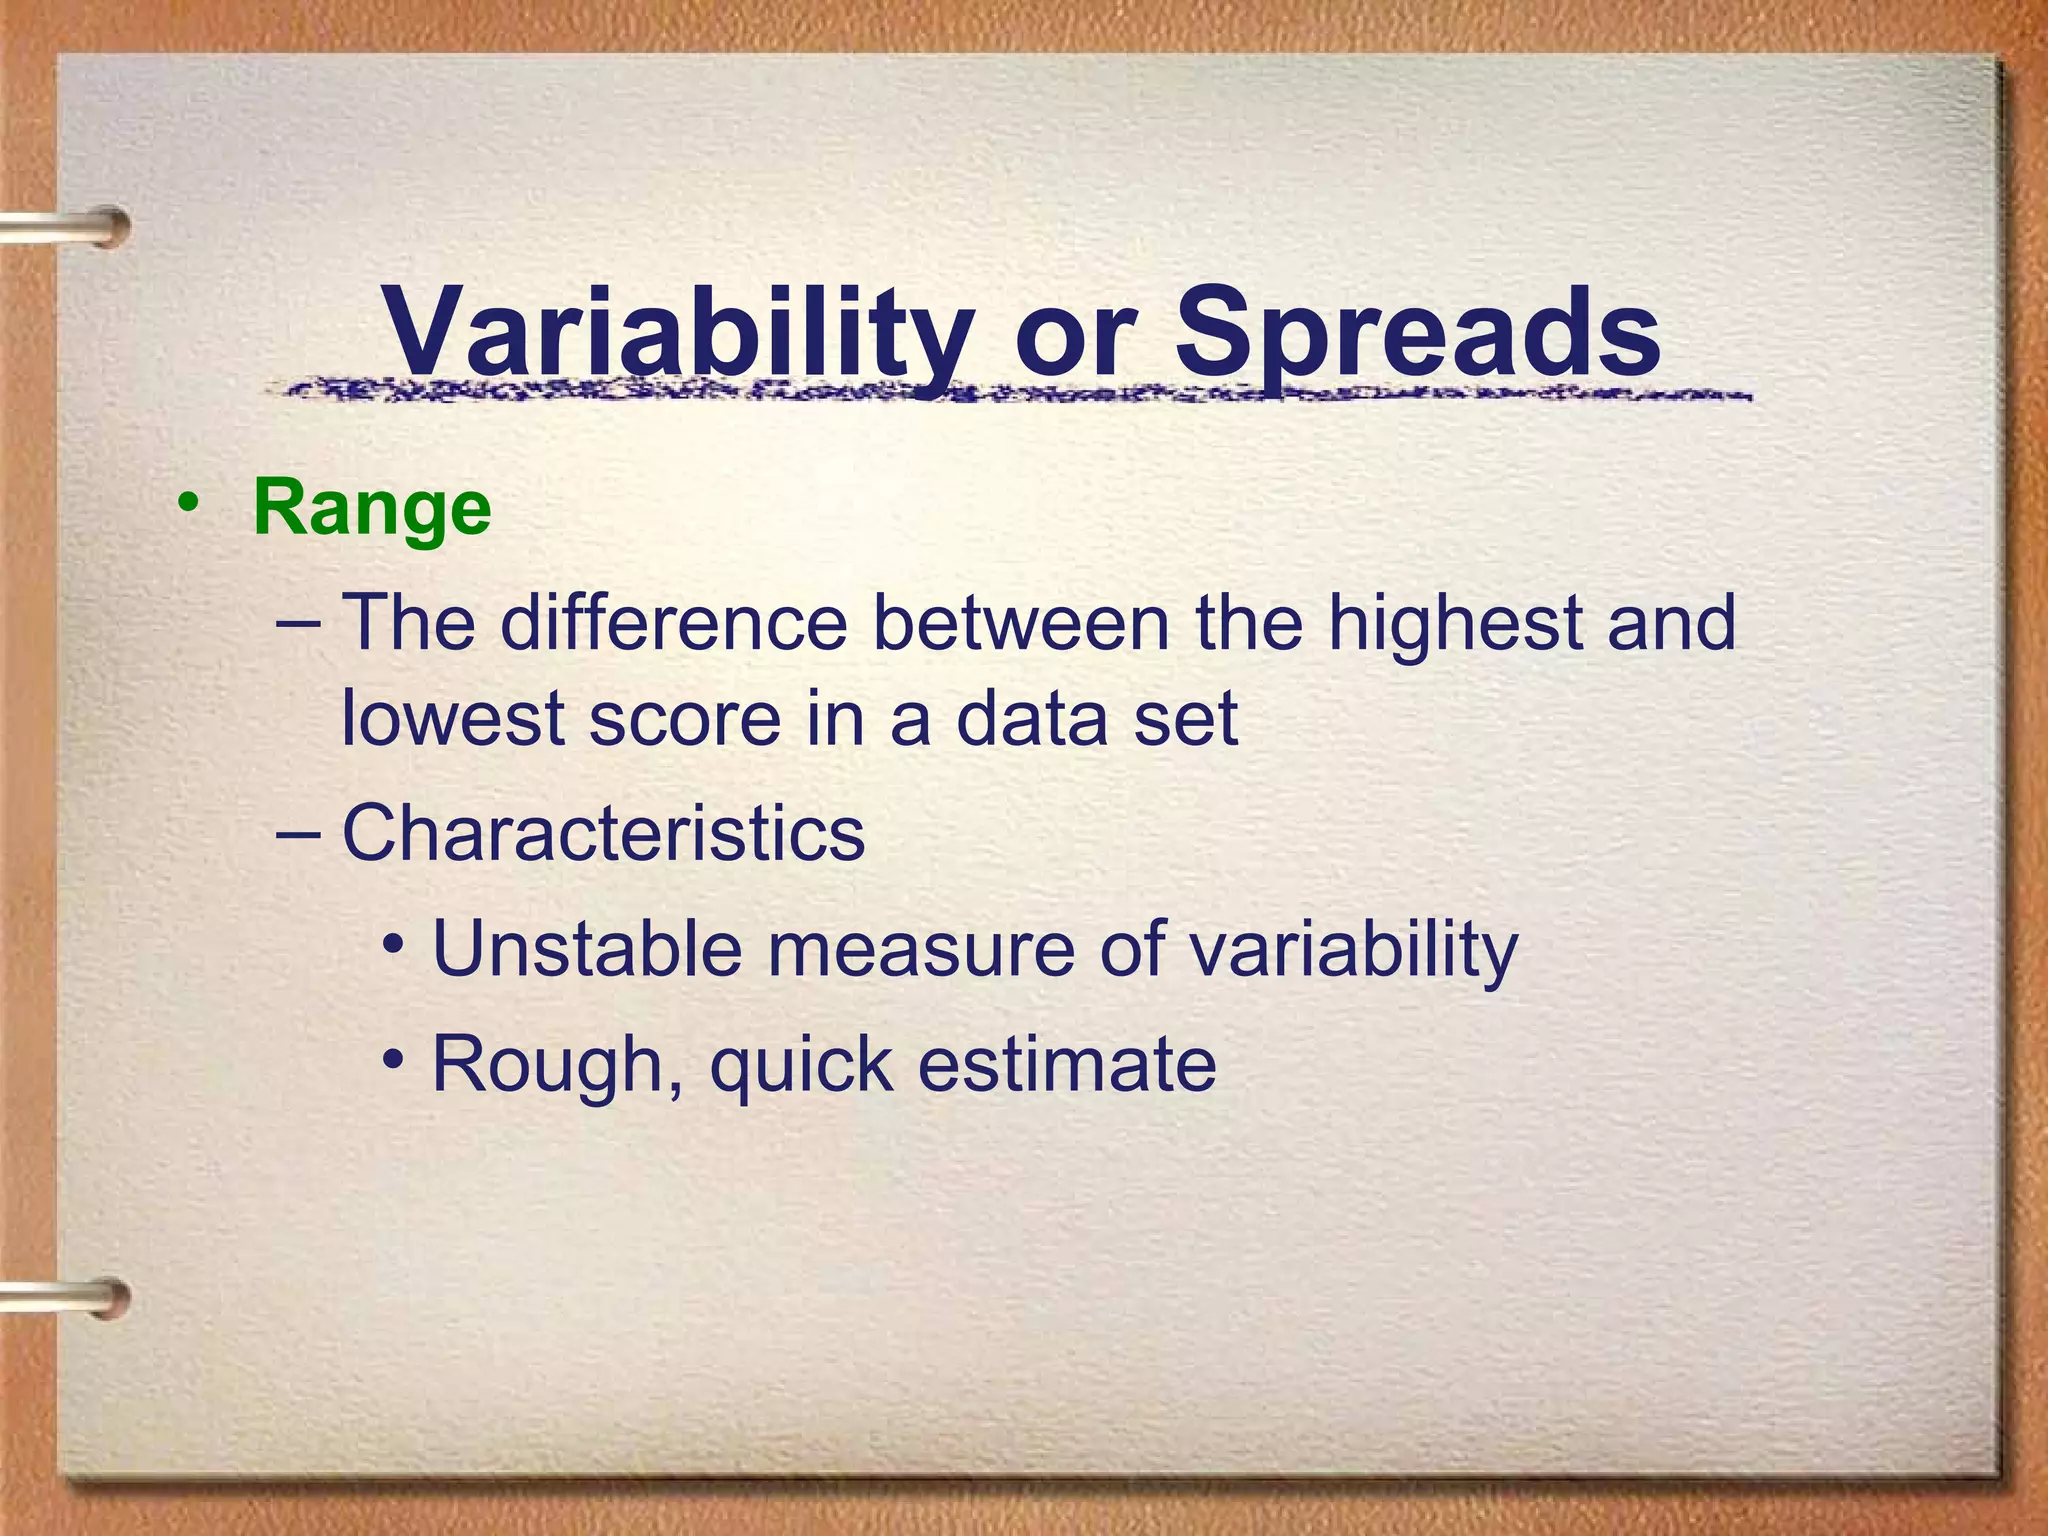
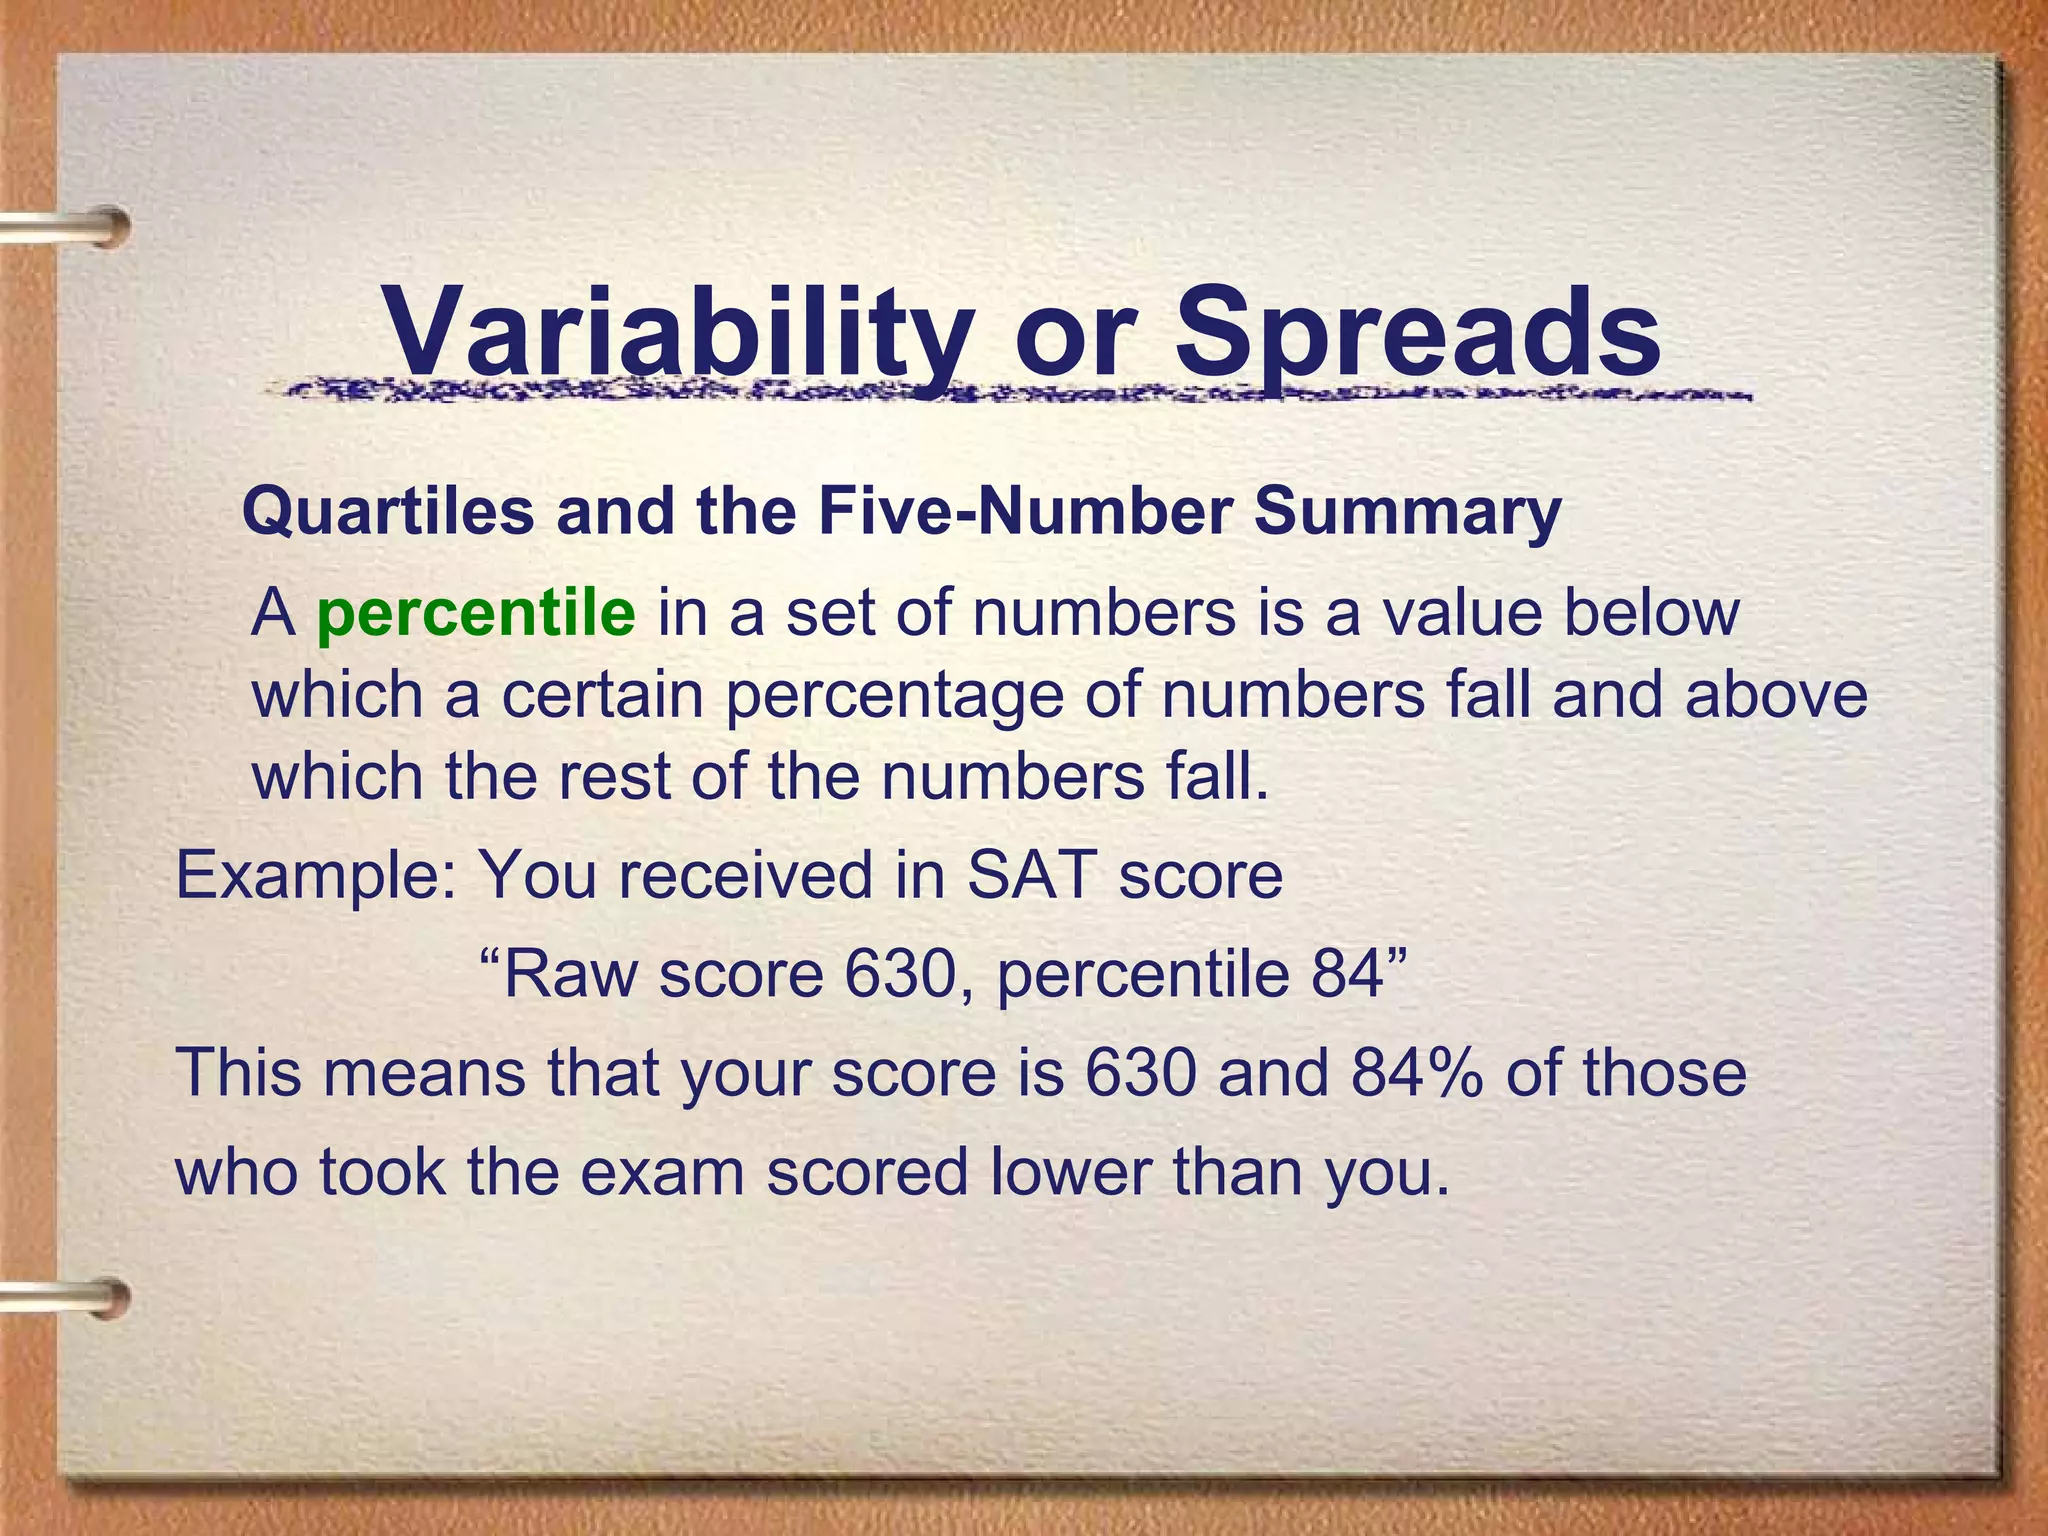
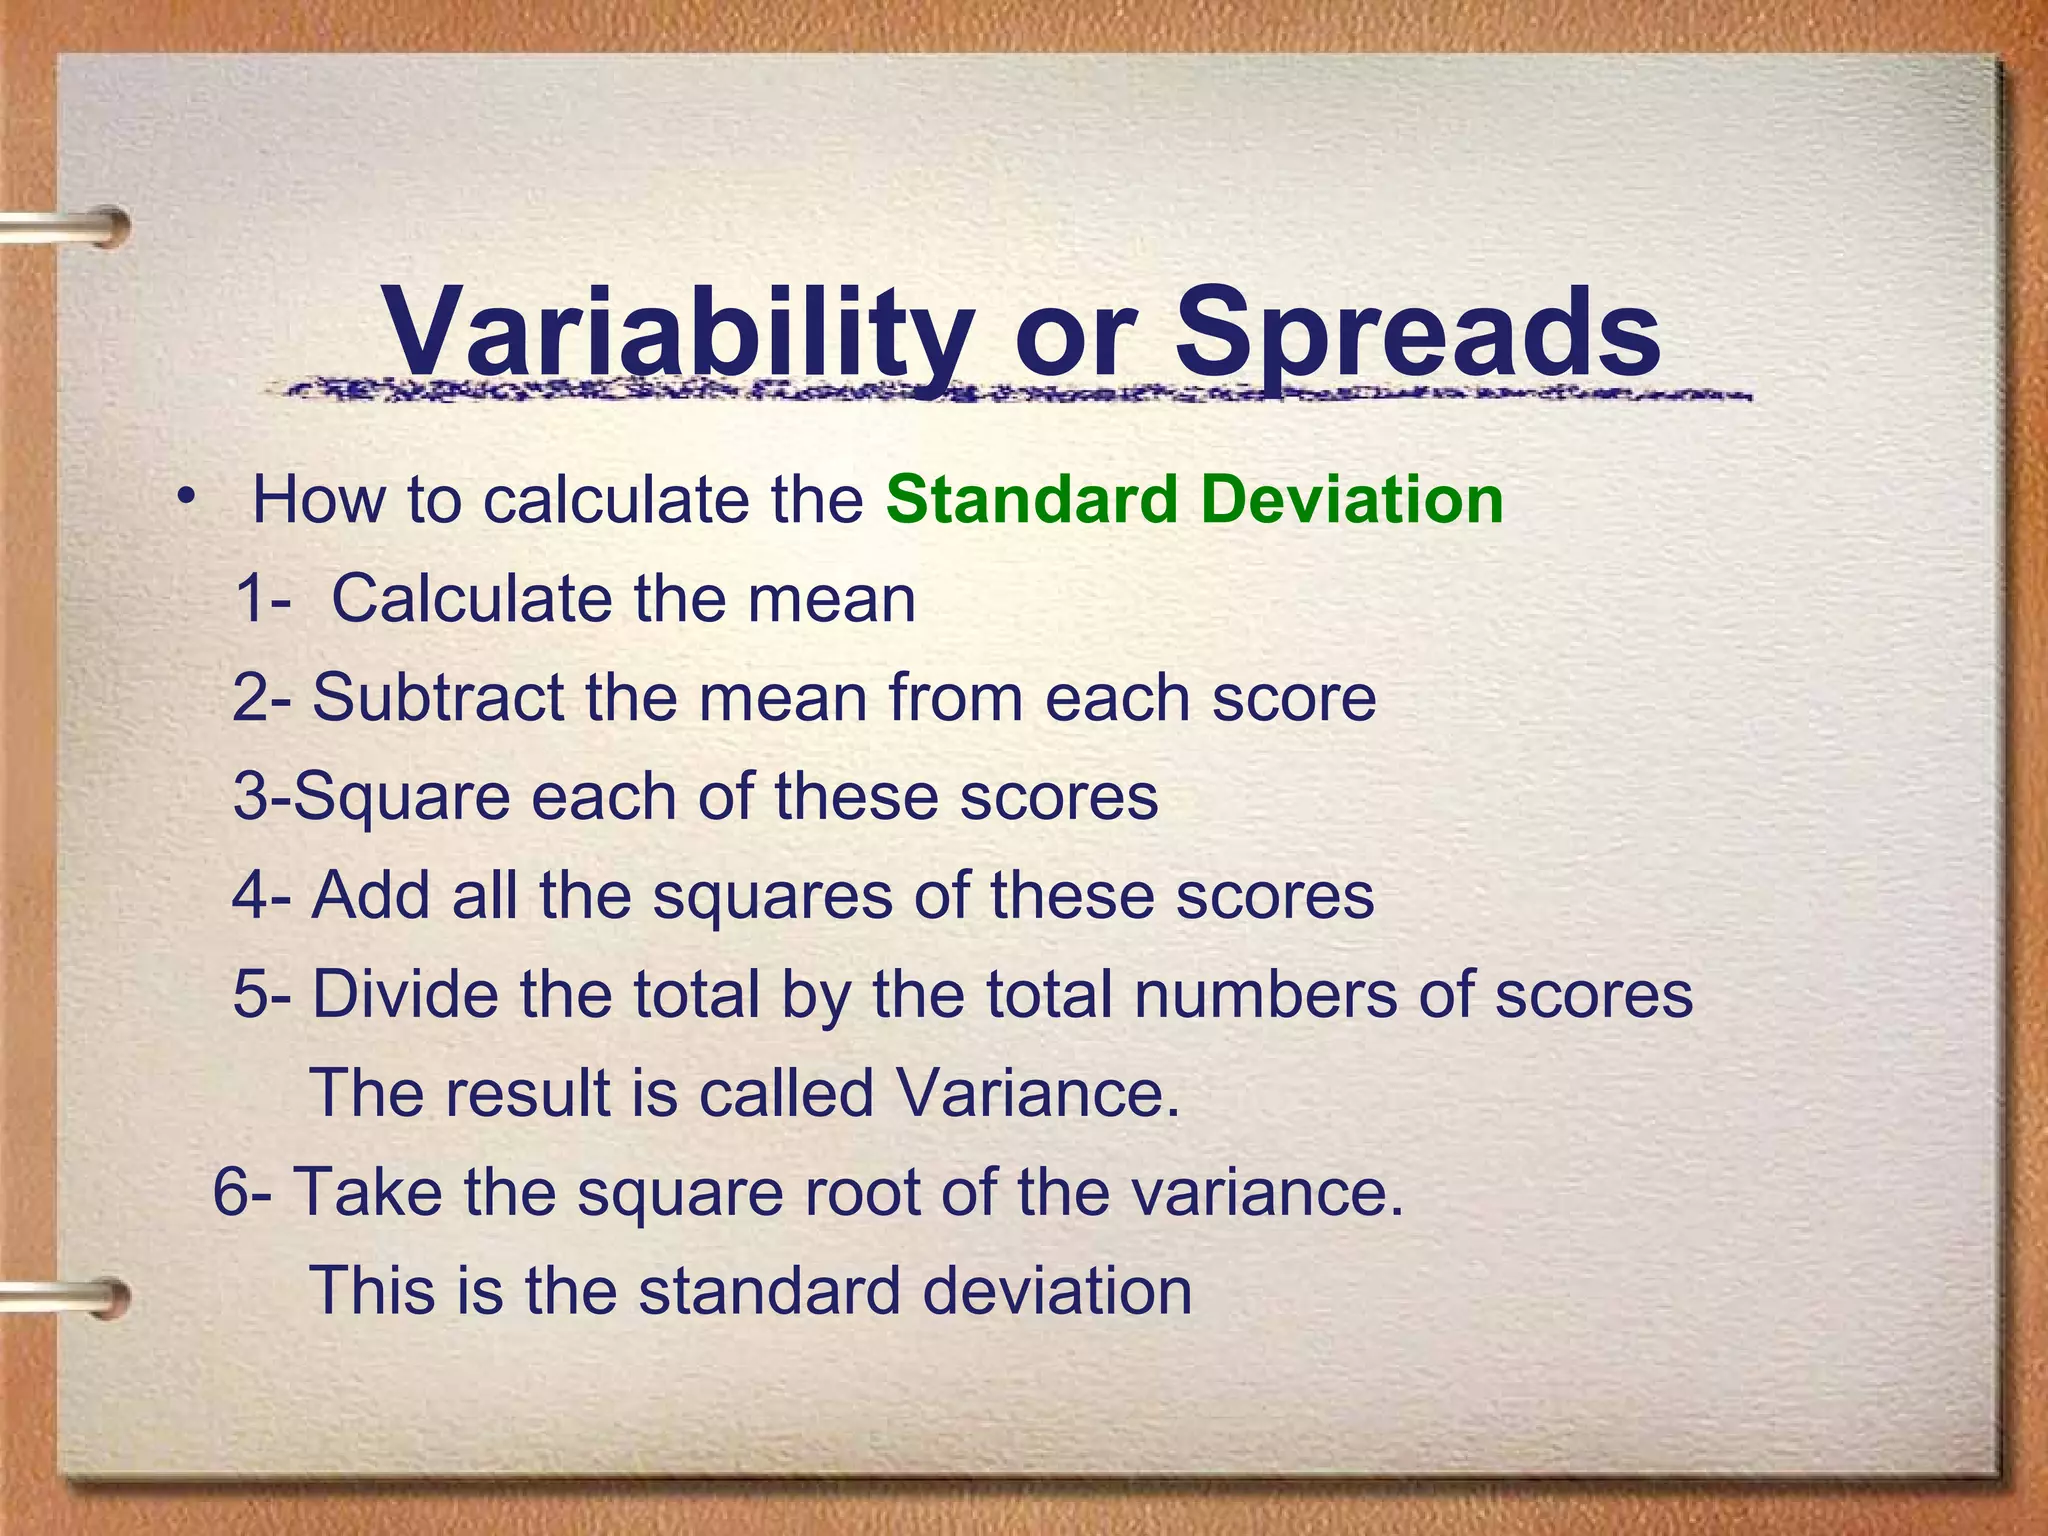
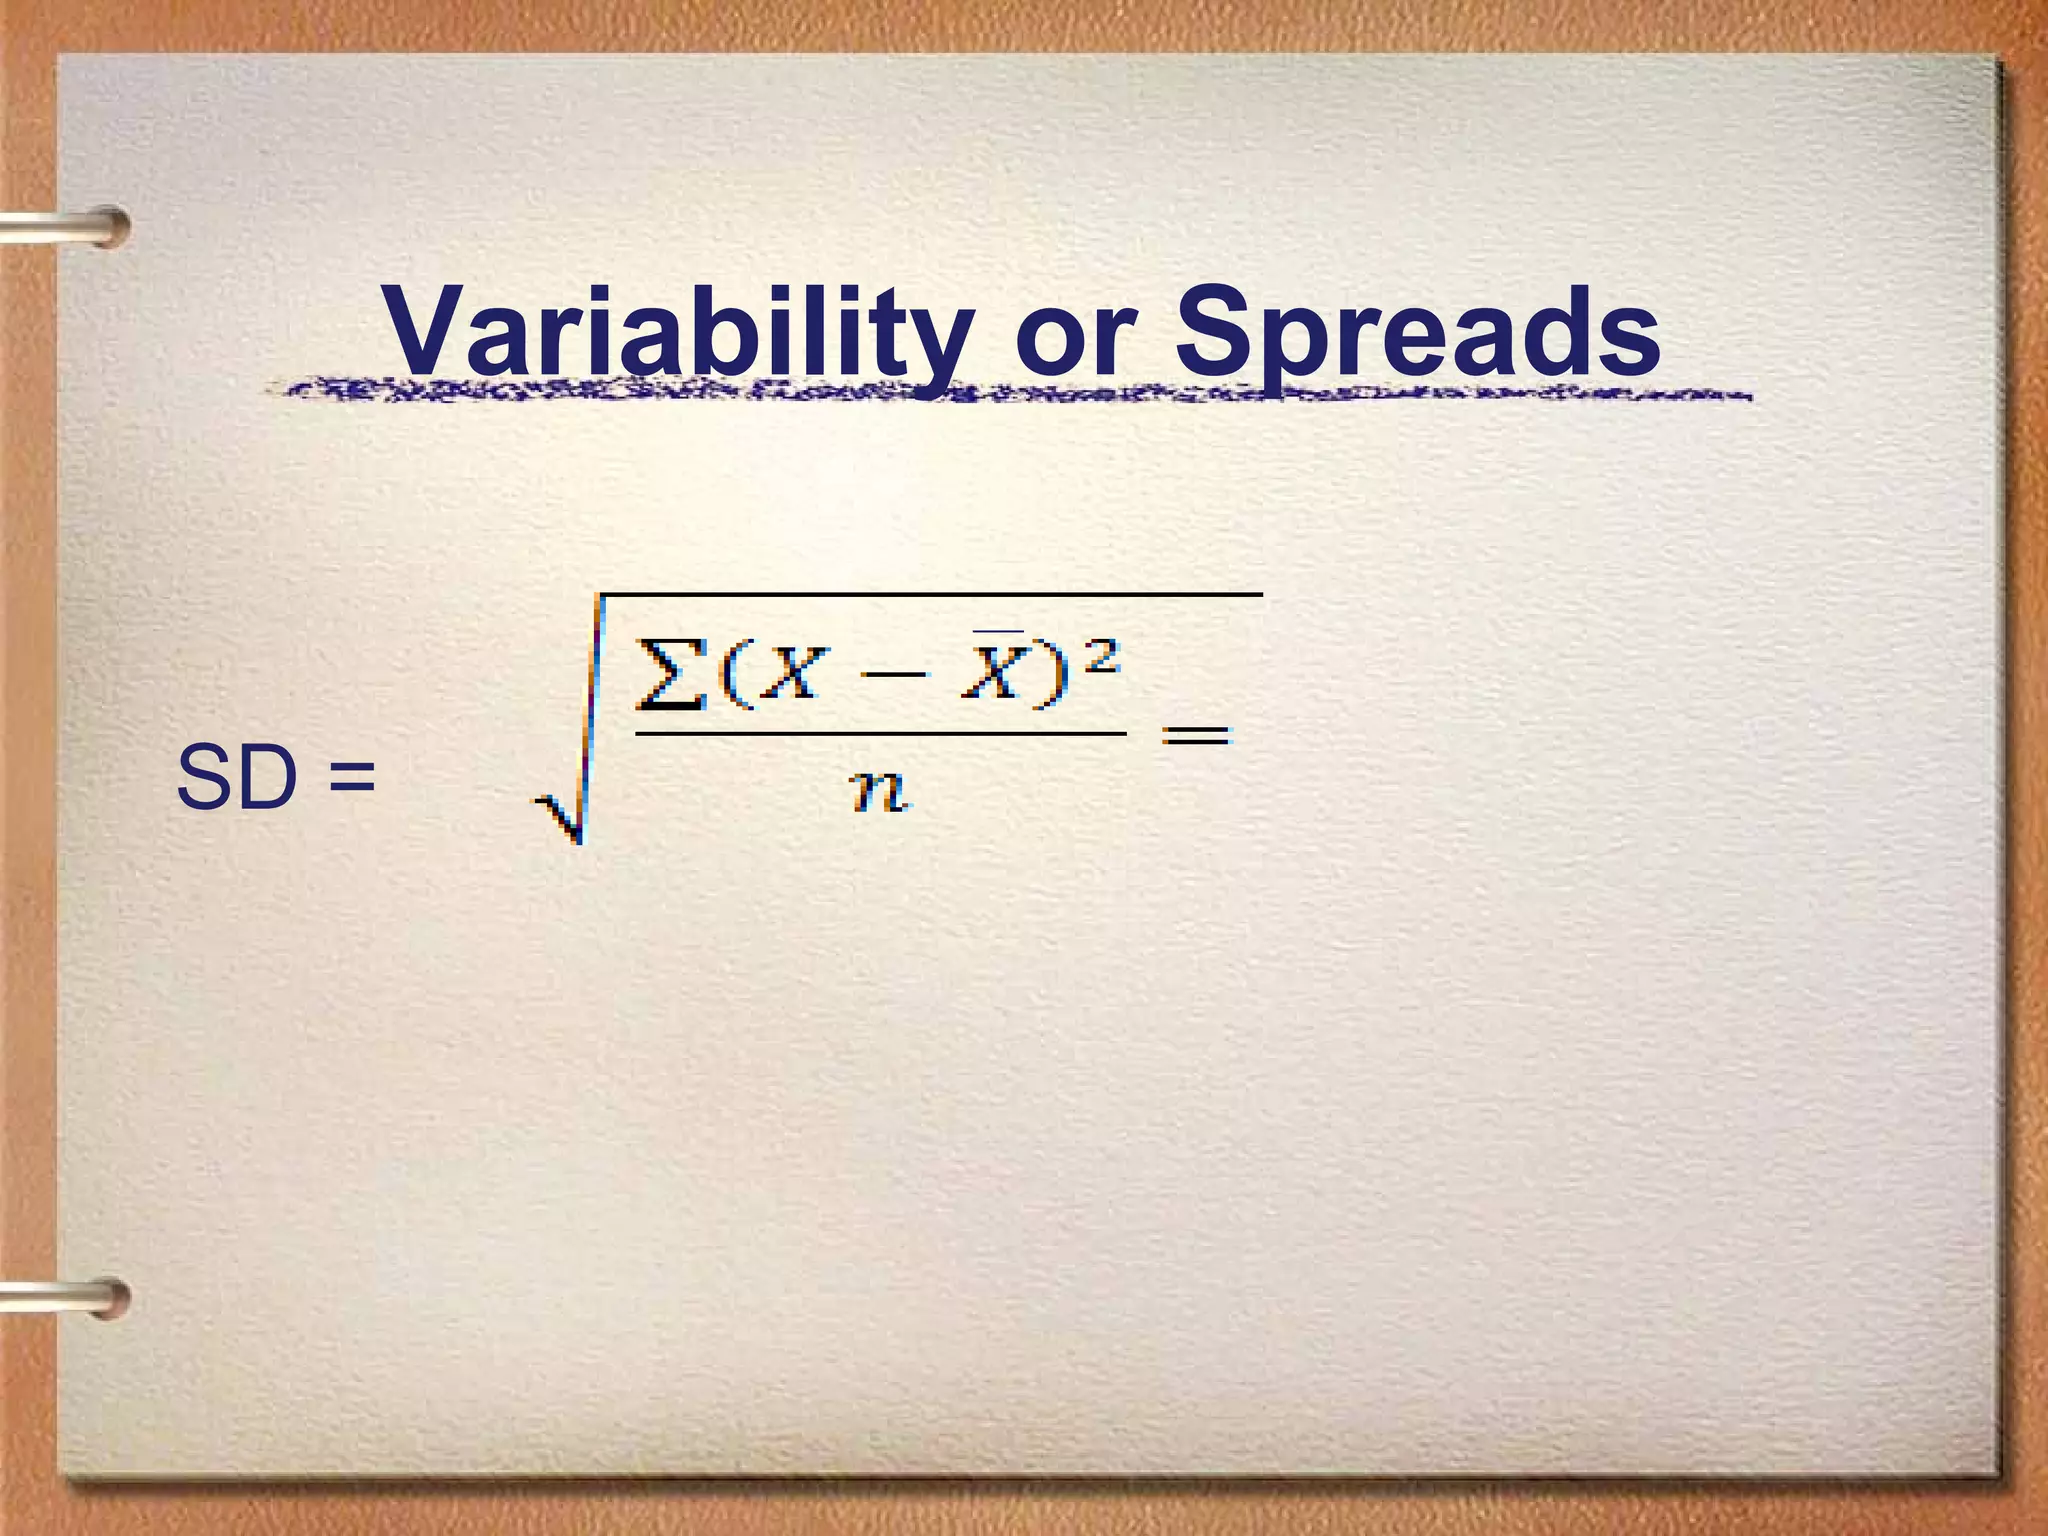
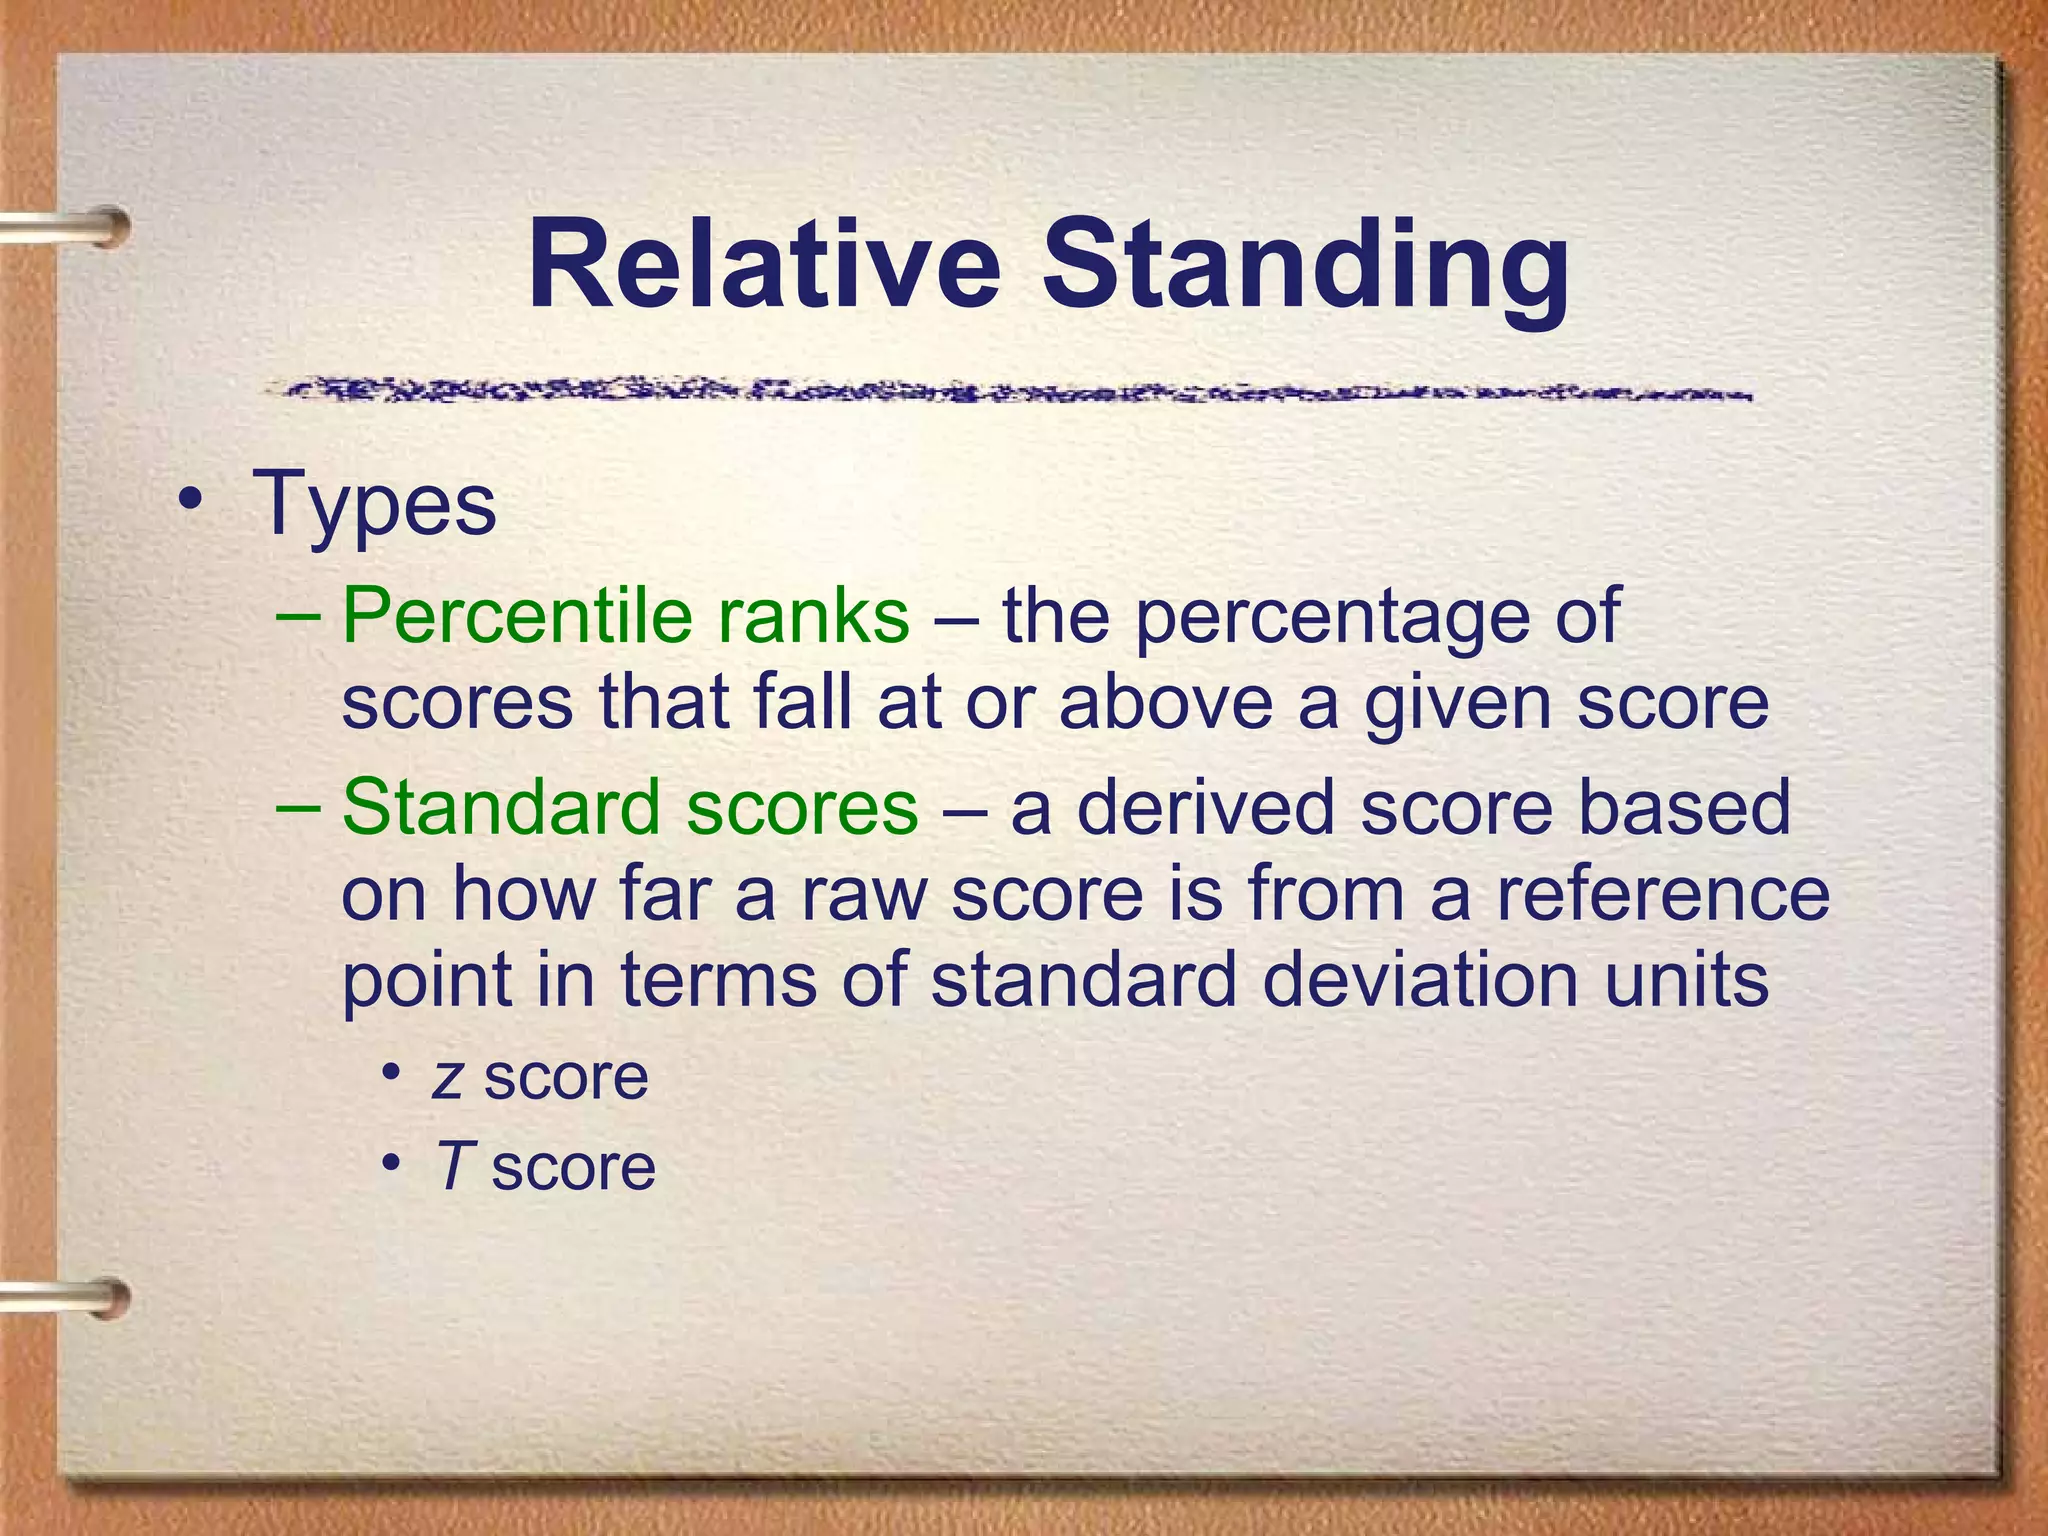


The document by Hiba Armouche provides an overview of descriptive statistics, distinguishing between statistics (characteristics of samples) and parameters (characteristics of populations). It covers various types of numerical data, scores, and techniques for summarizing quantitative data, including frequency distributions, histograms, and measures of central tendency like mean, median, and mode. Additionally, it discusses variability and relative standing through concepts such as standard deviation, percentiles, and skewness in data distributions.