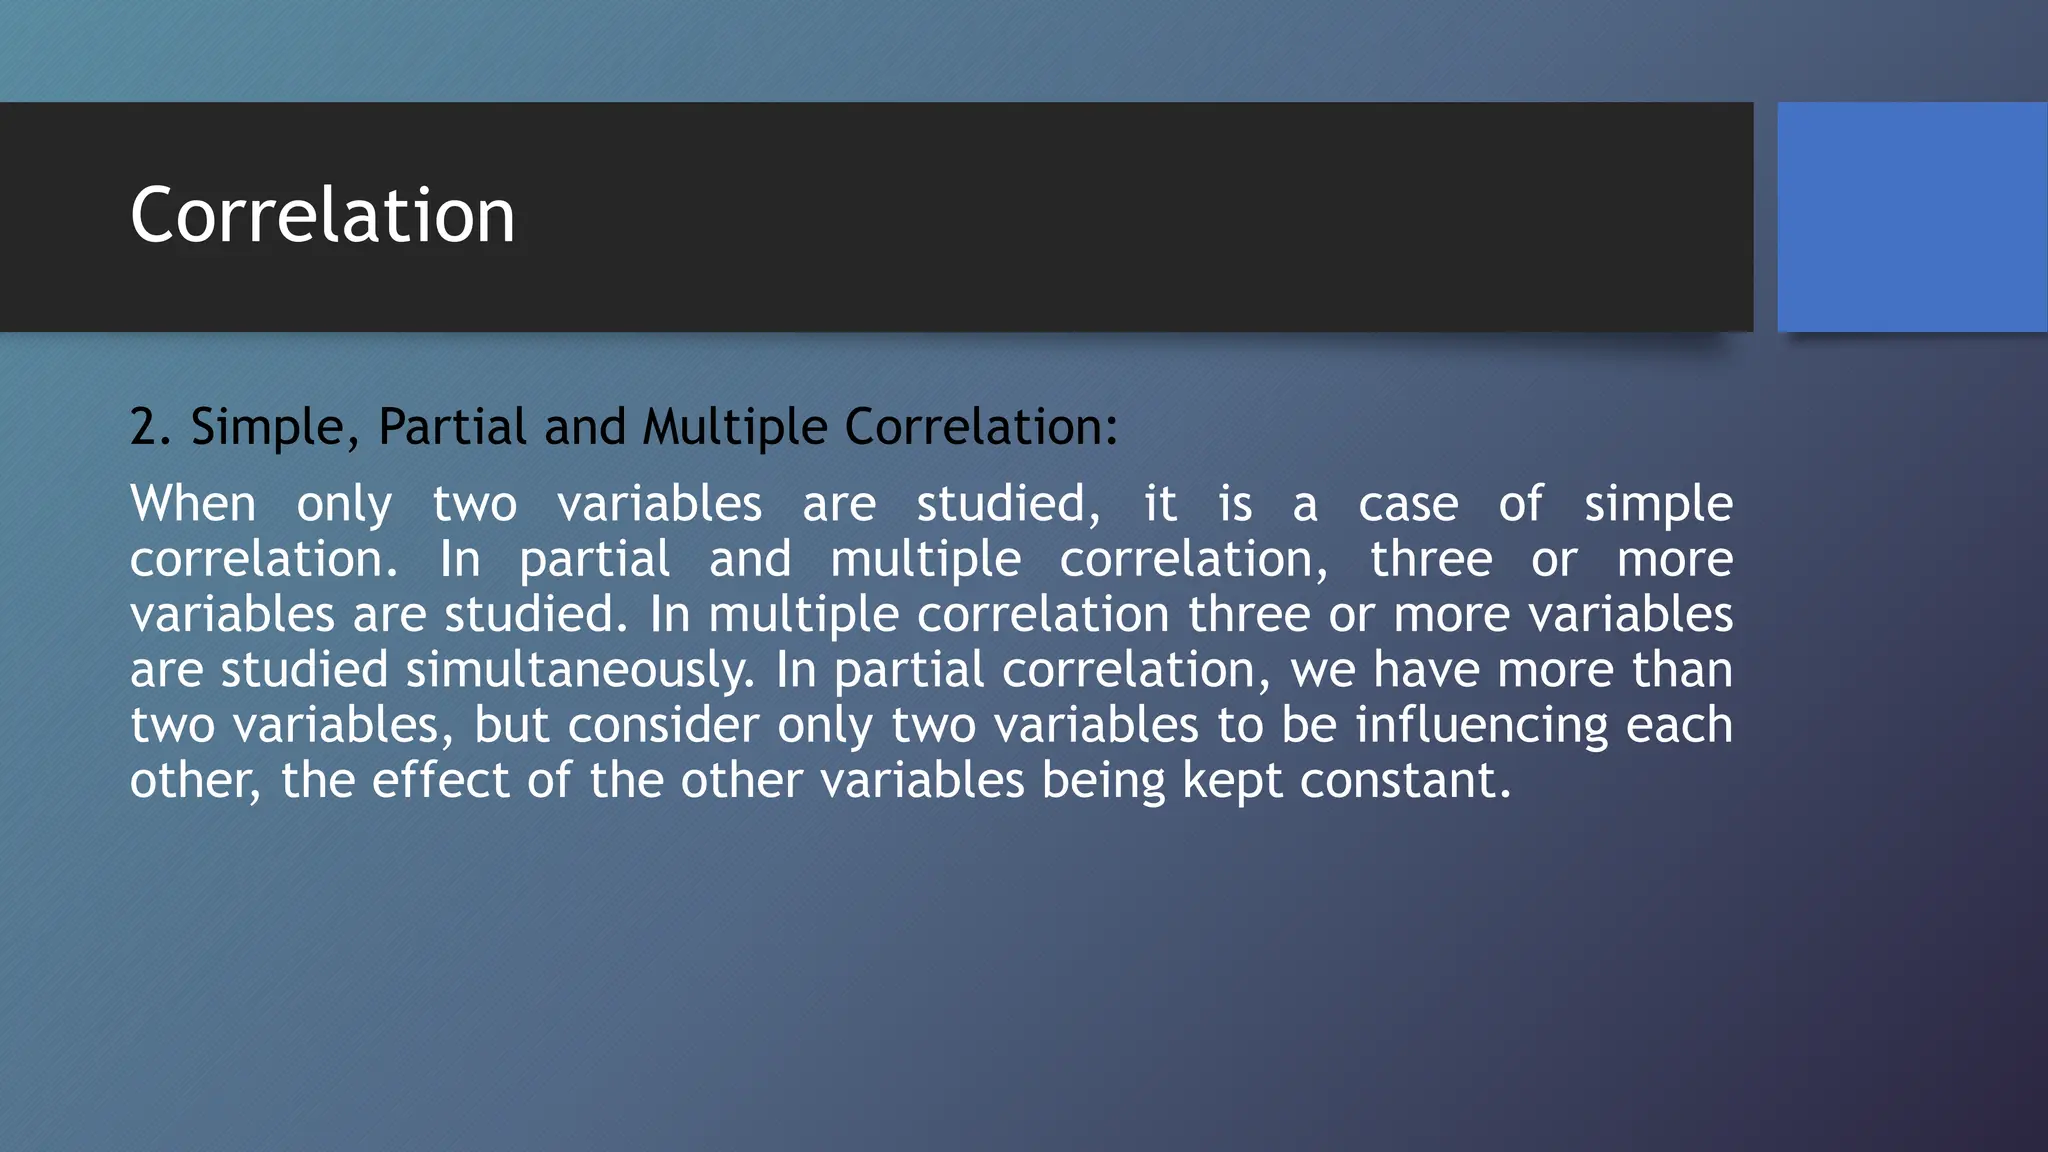
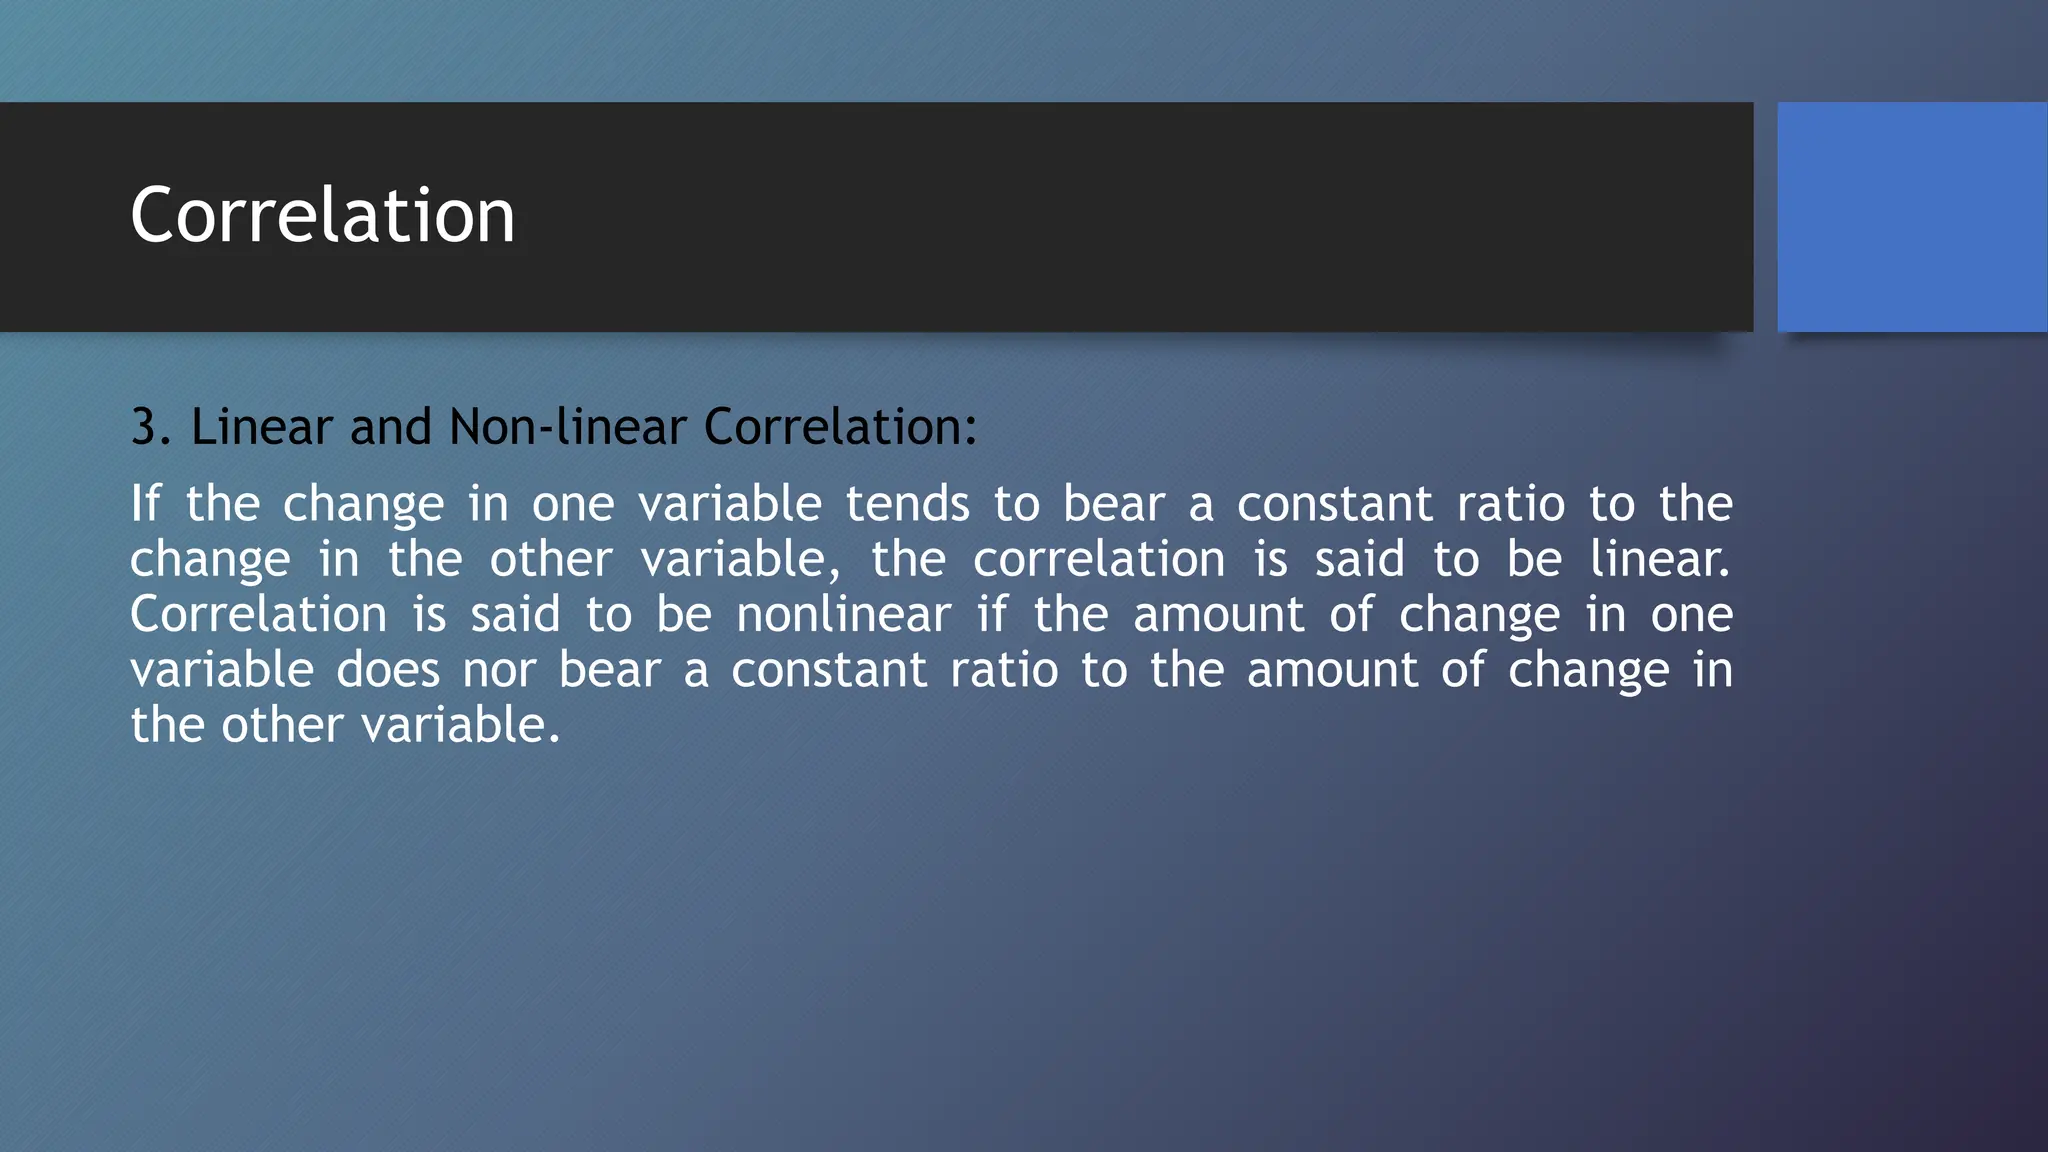
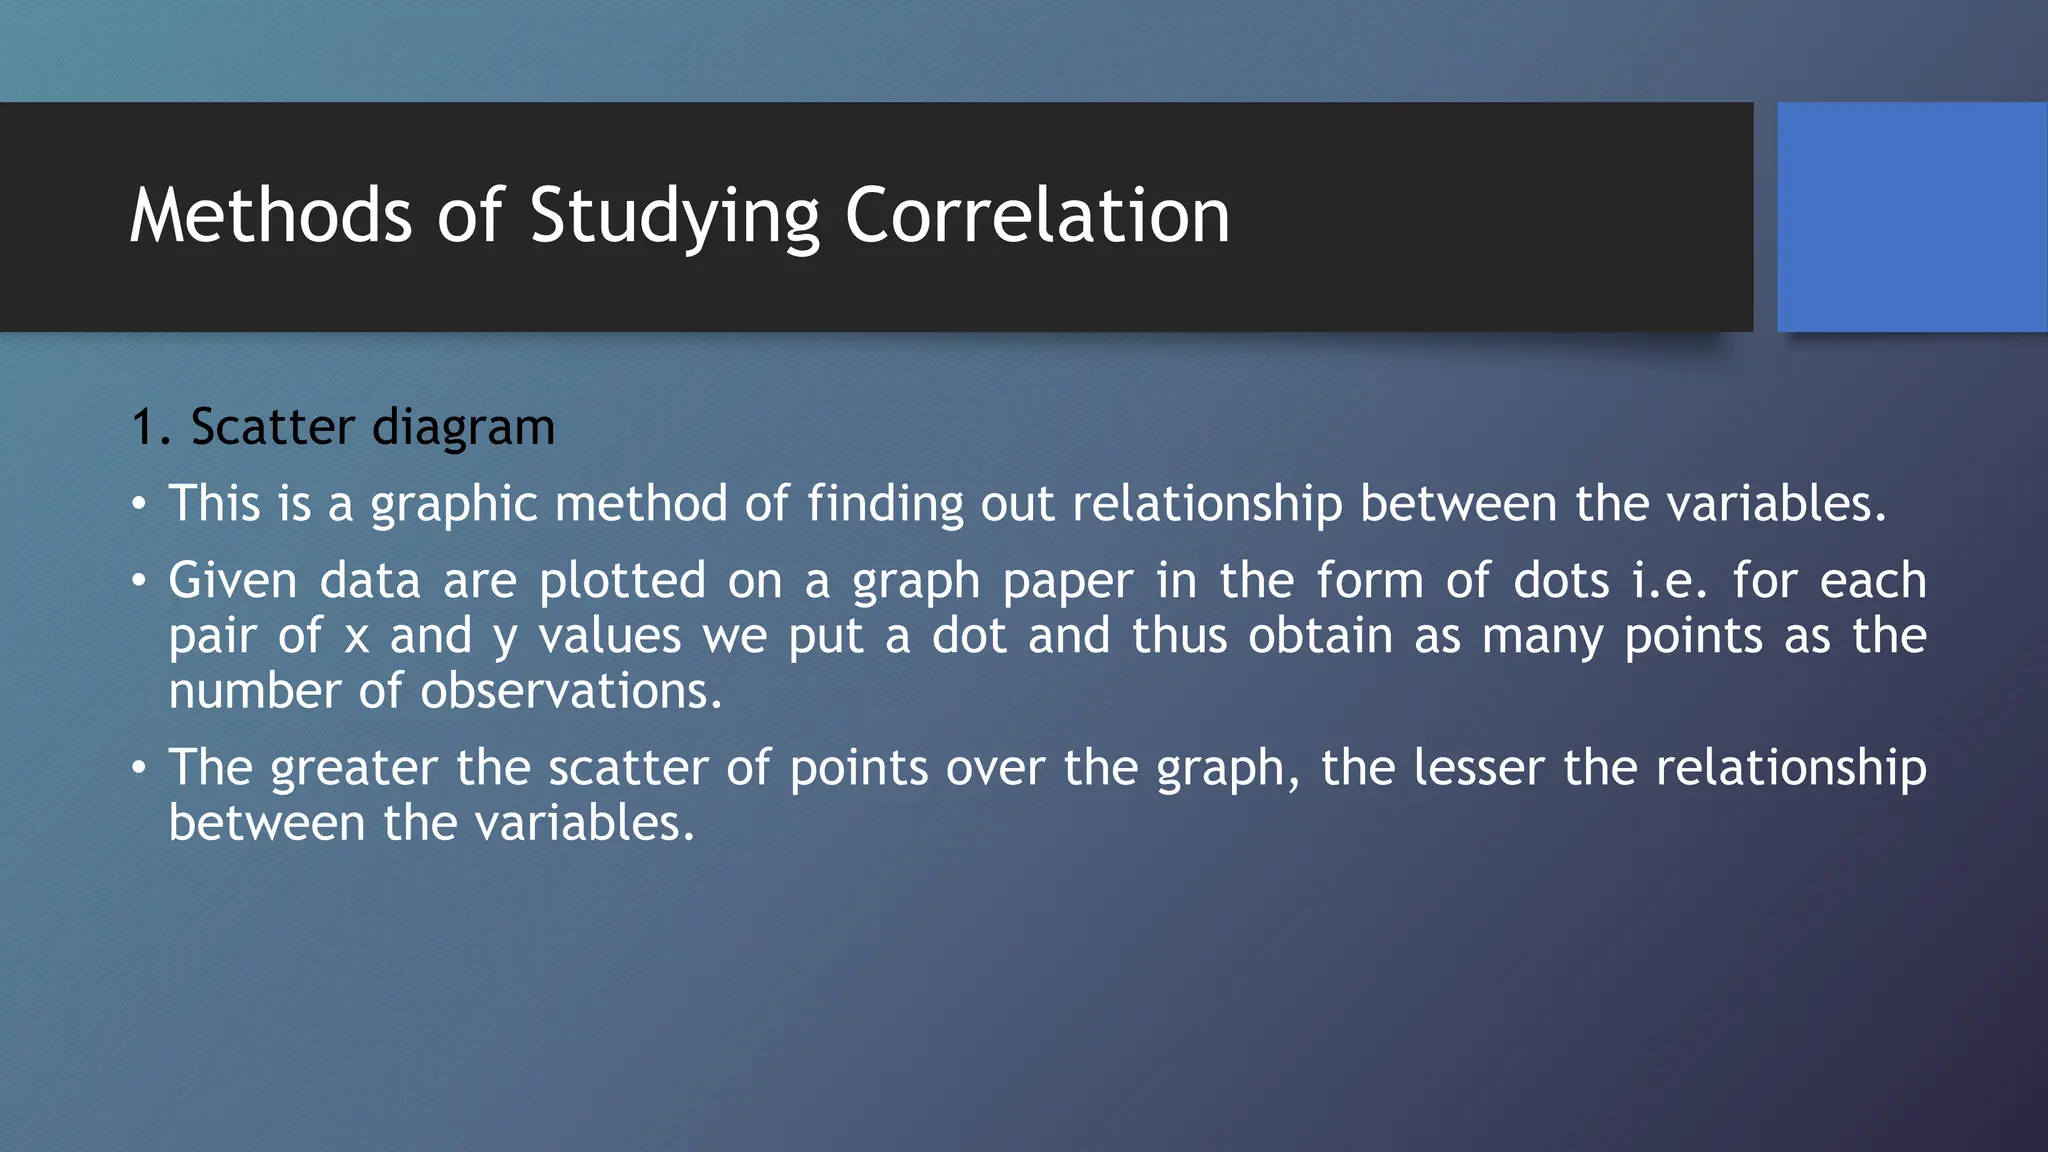
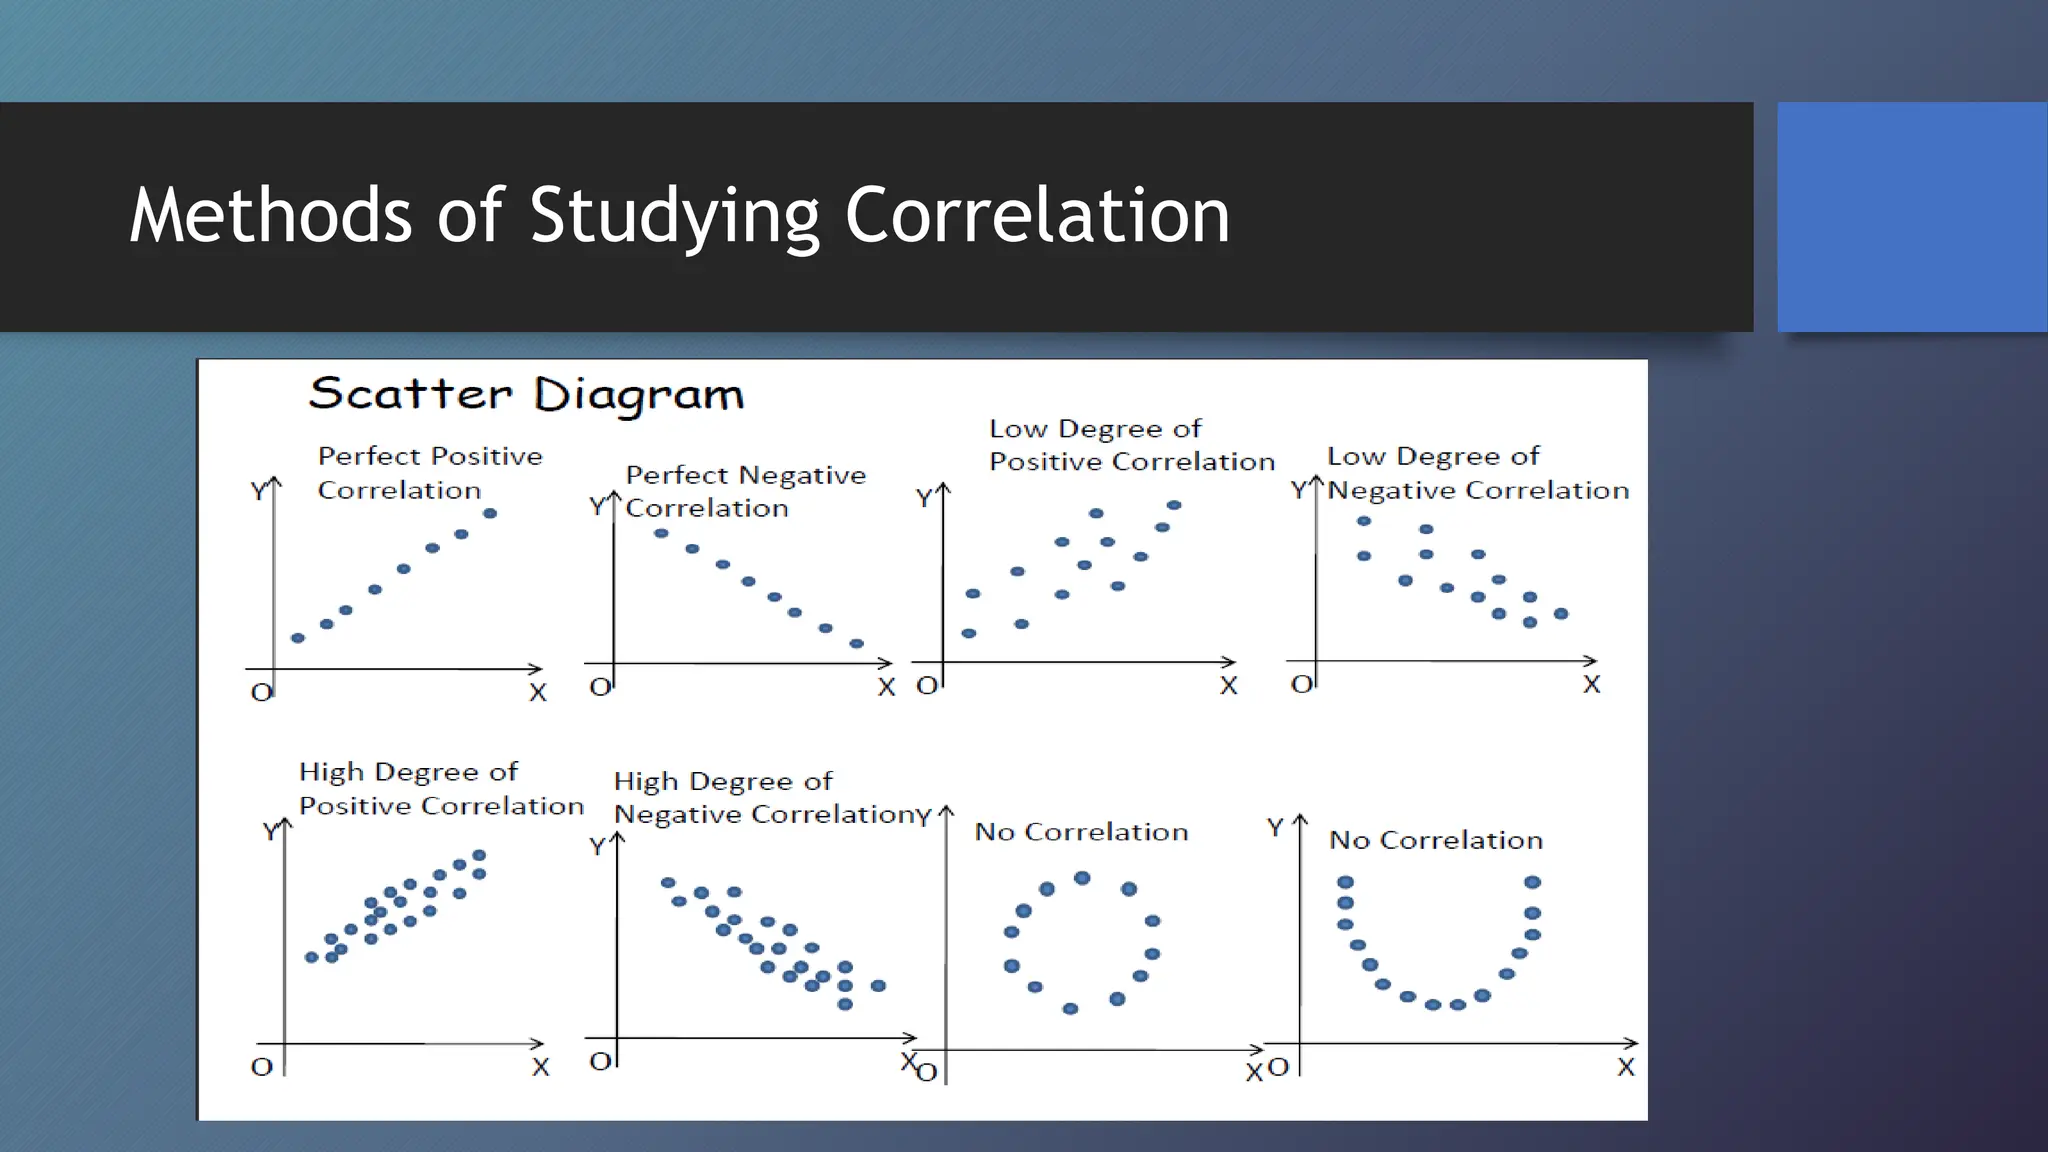
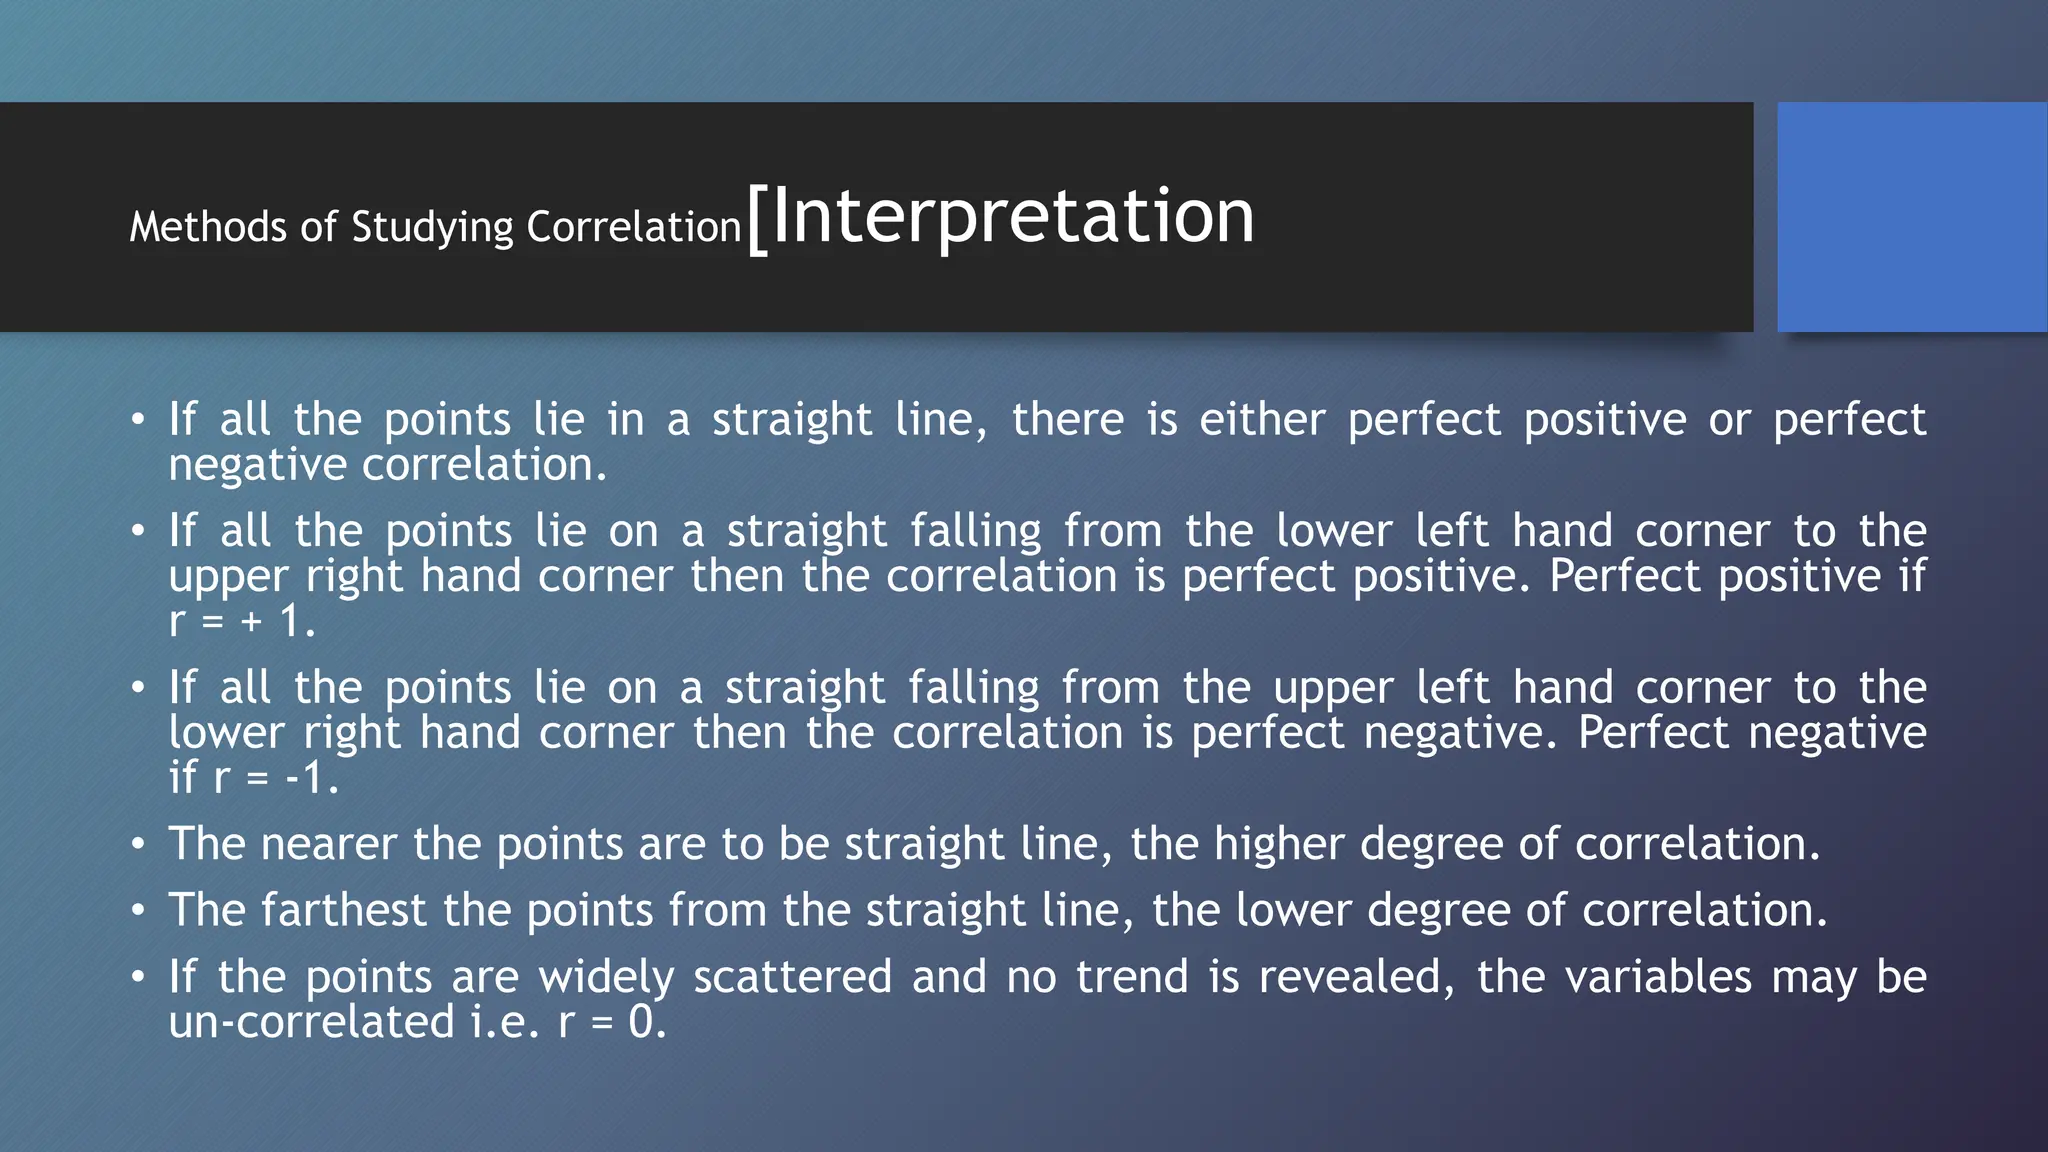
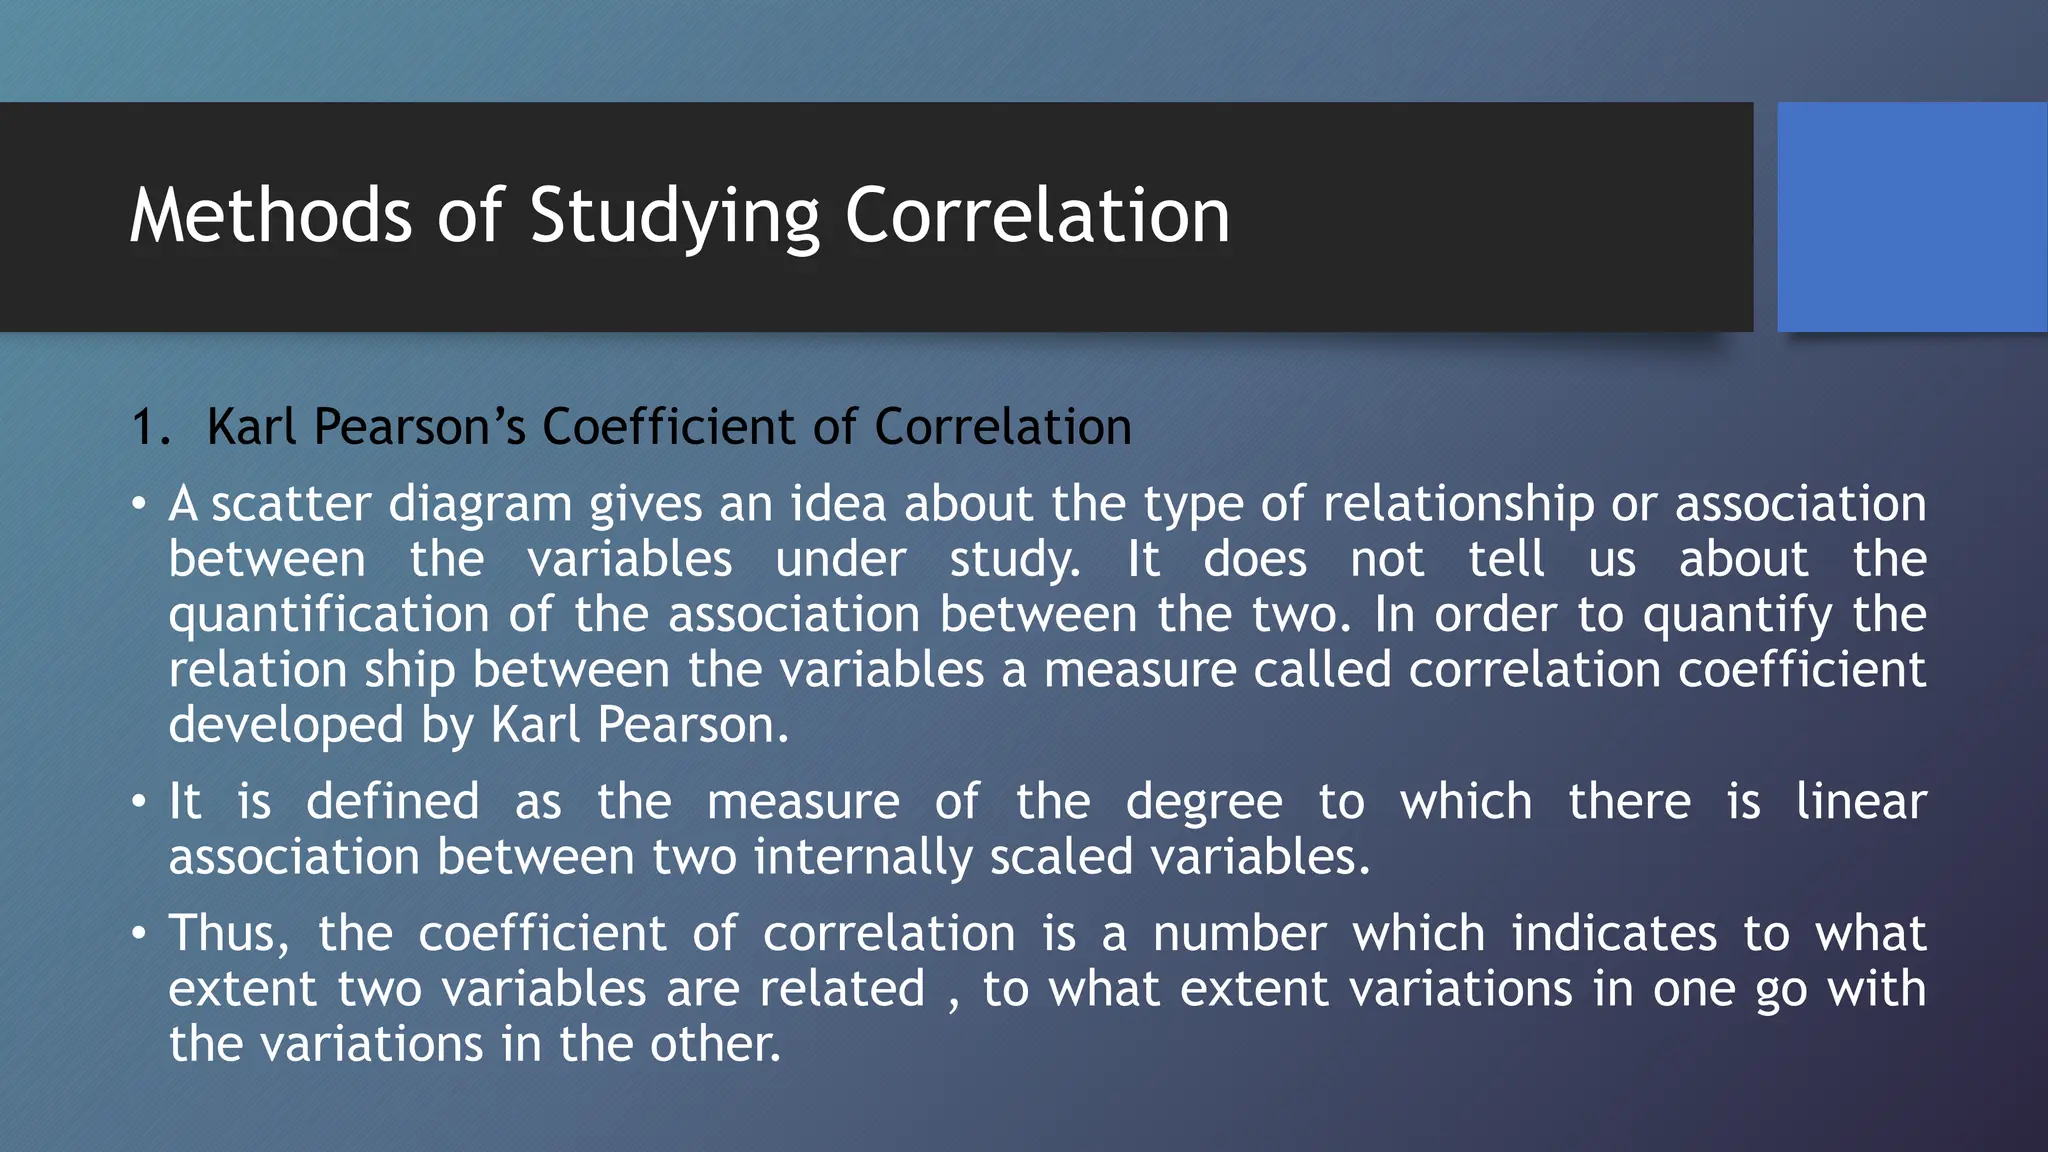
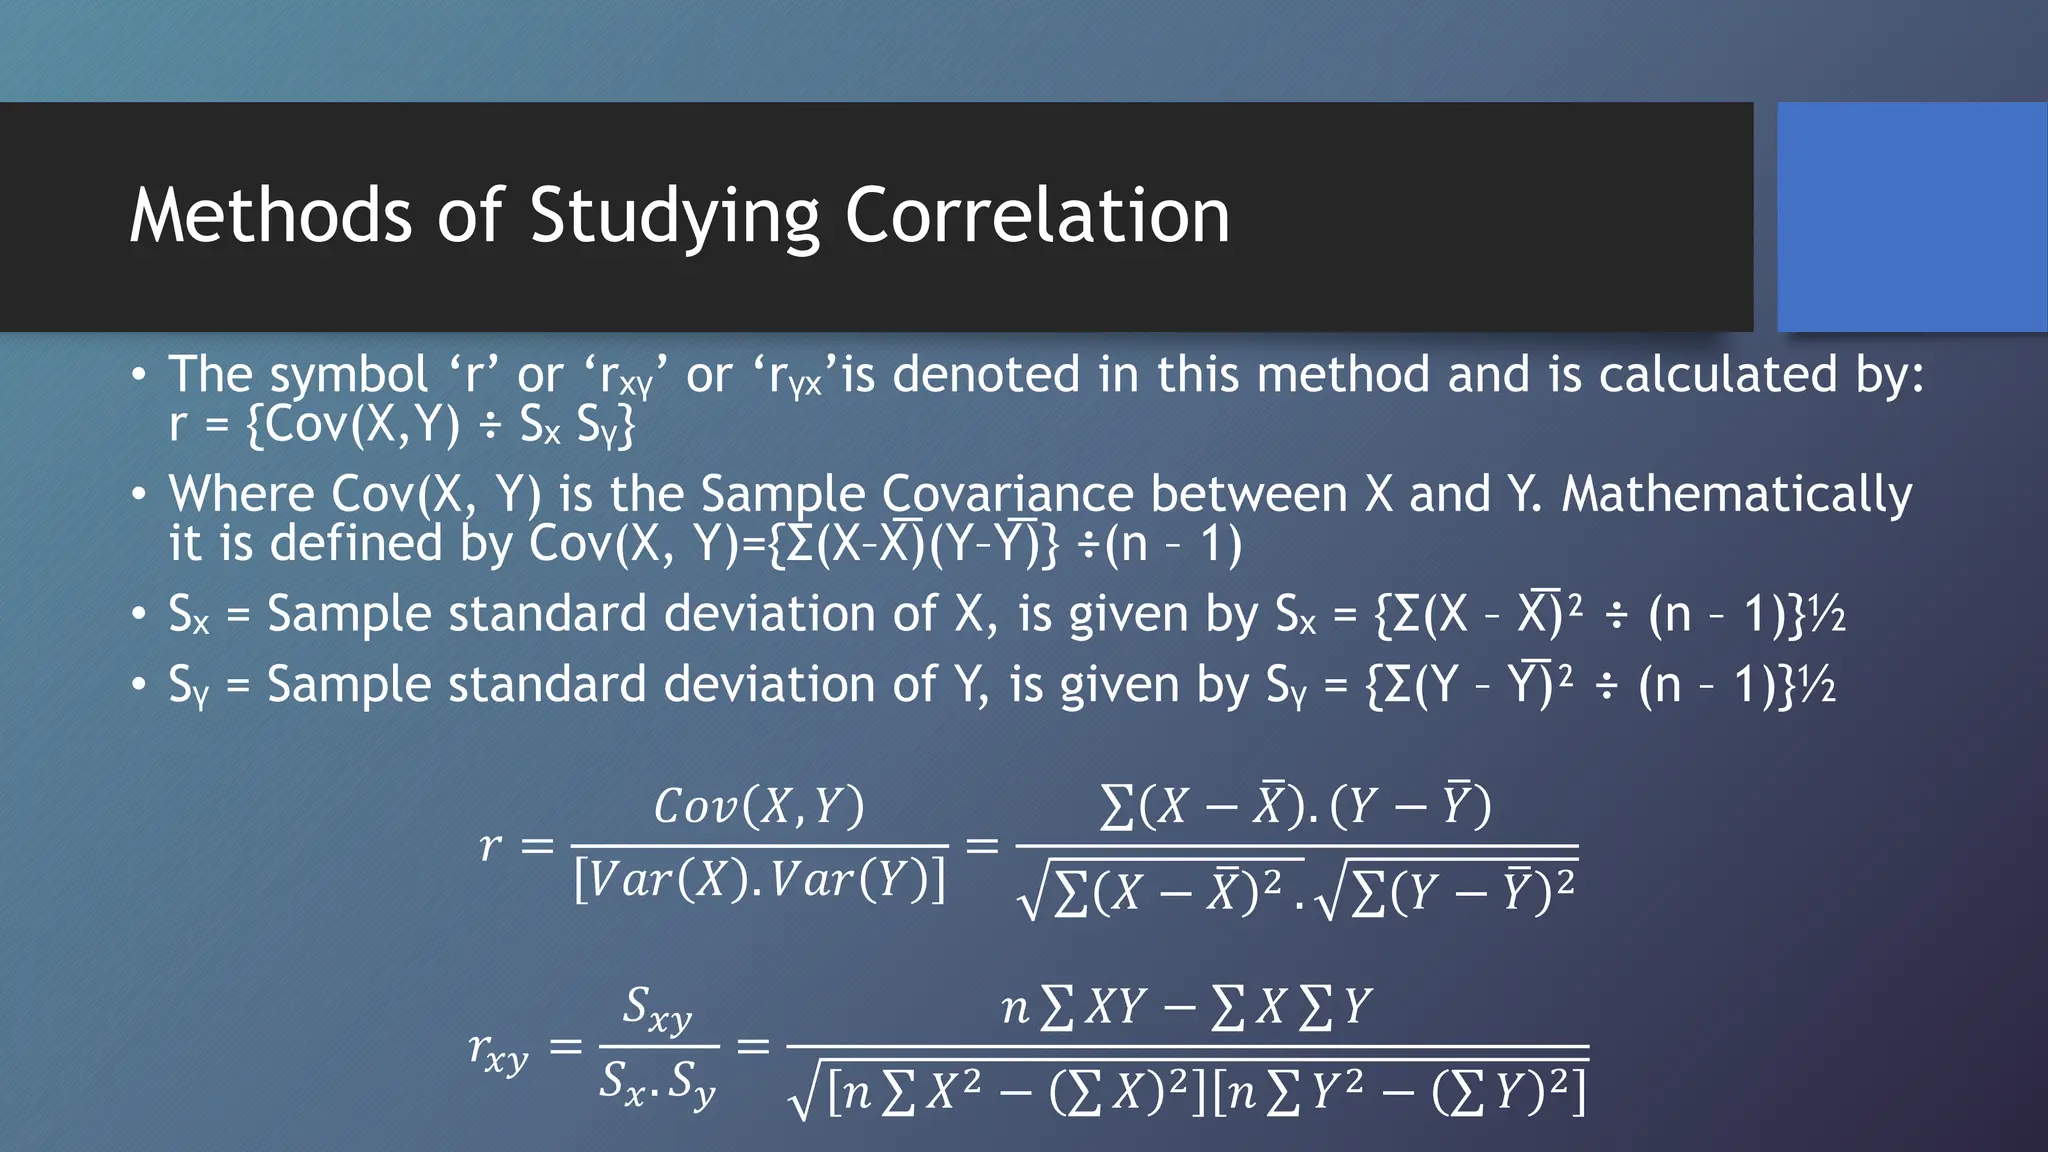
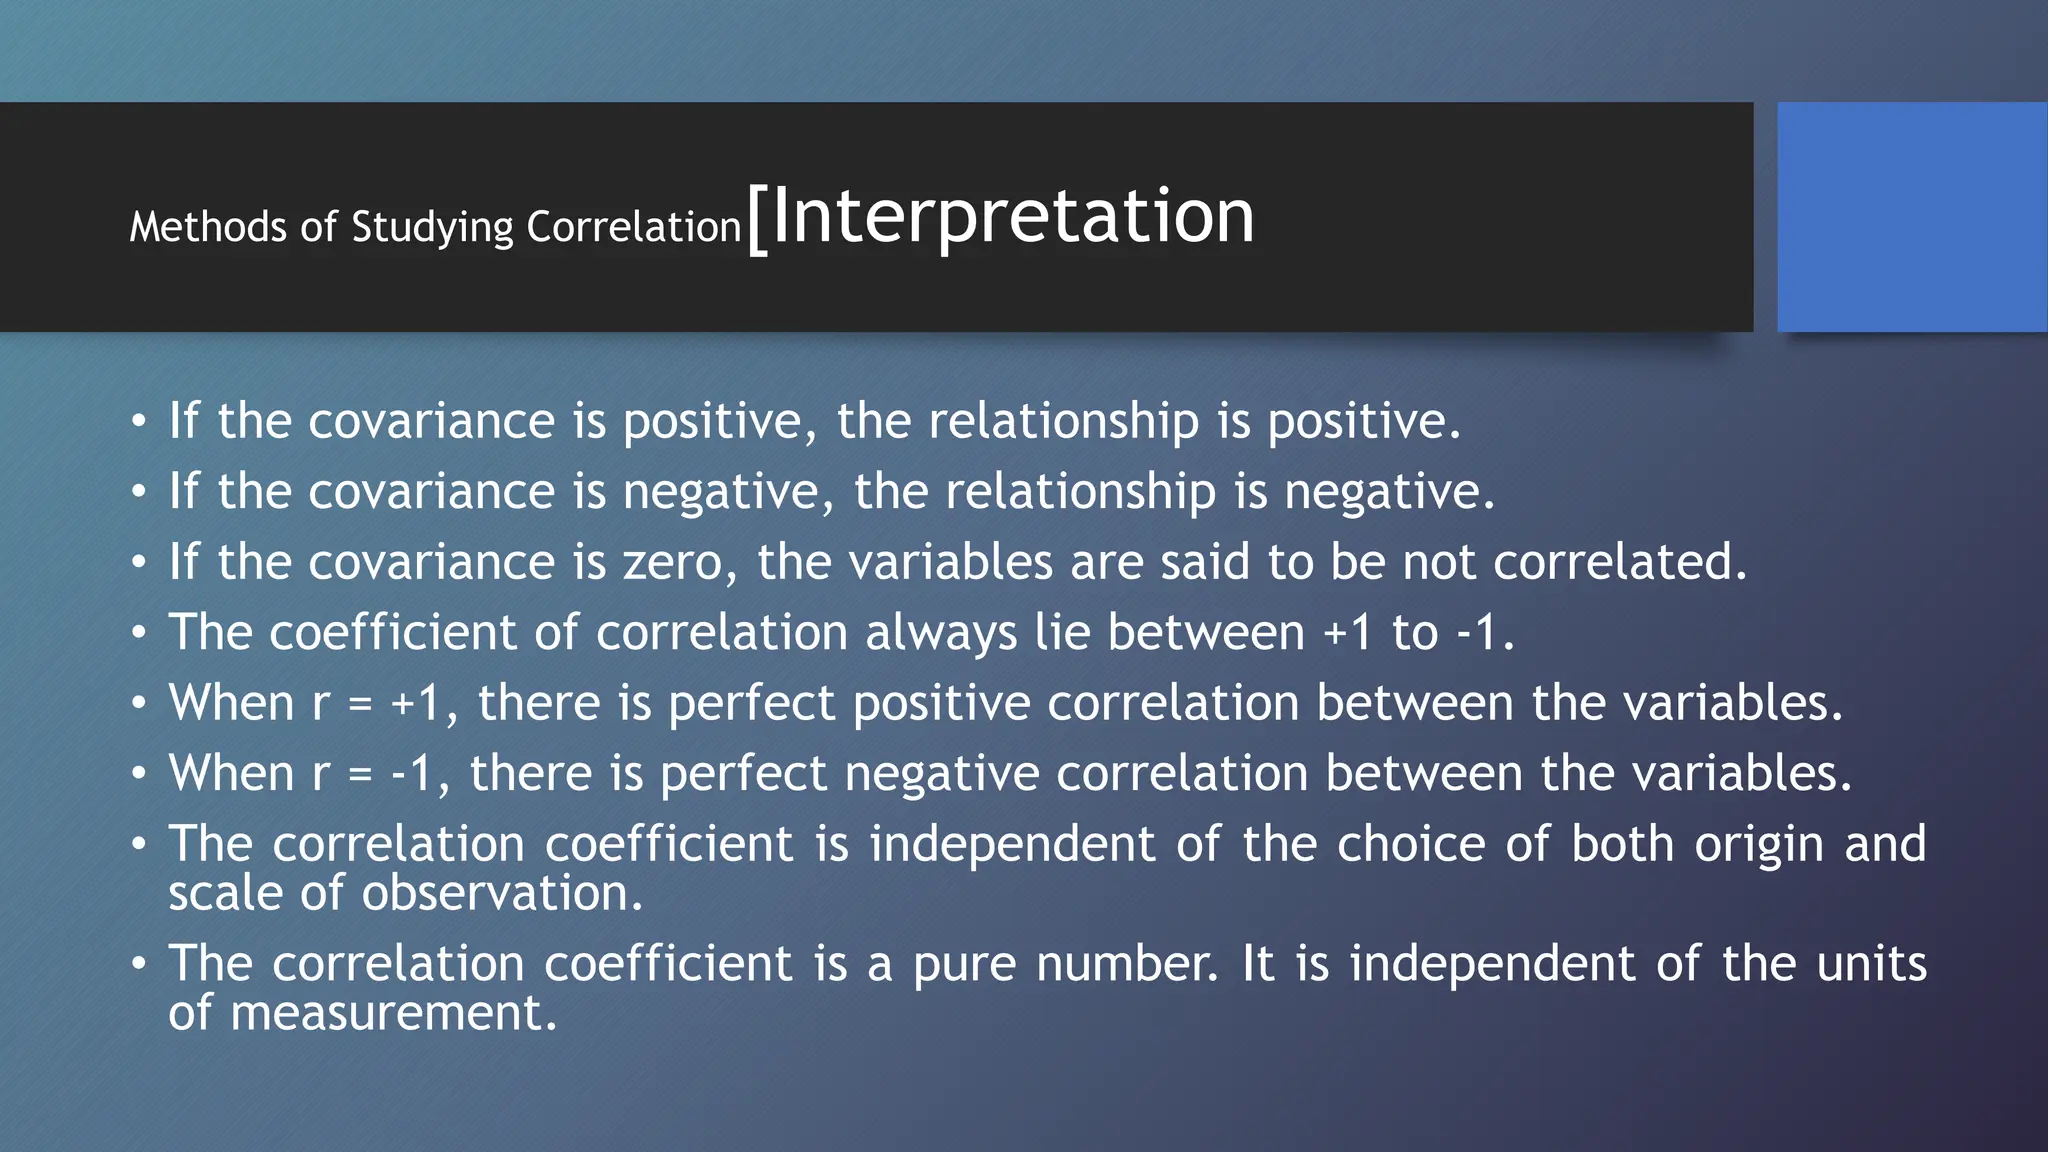
This document discusses correlation and methods for studying correlation. Correlation refers to the relationship between two variables, where a positive correlation means the variables change in the same direction and a negative correlation means they change in opposite directions. Methods for studying correlation include scatter plots, Karl Pearson's coefficient of correlation (denoted r), and the coefficient of determination (denoted r2). The coefficient of correlation quantifies the strength and direction of the linear relationship between variables while the coefficient of determination indicates how much variability in one variable can be predicted from the other variable.
Correlation and regression.
It shows different aspects of Correlation and regression.
A small comparison of these two is also listed in this presentation.
Correlation and regression.
It shows different aspects of Correlation and regression.
A small comparison of these two is also listed in this presentation.
Operation “Blue Star” is the only event in the history of Independent India where the state went into war with its own people. Even after about 40 years it is not clear if it was culmination of states anger over people of the region, a political game of power or start of dictatorial chapter in the democratic setup.
The people of Punjab felt alienated from main stream due to denial of their just demands during a long democratic struggle since independence. As it happen all over the word, it led to militant struggle with great loss of lives of military, police and civilian personnel. Killing of Indira Gandhi and massacre of innocent Sikhs in Delhi and other India cities was also associated with this movement.
Synthetic Fiber Construction in lab .pptxPavel ( NSTU)
Synthetic fiber production is a fascinating and complex field that blends chemistry, engineering, and environmental science. By understanding these aspects, students can gain a comprehensive view of synthetic fiber production, its impact on society and the environment, and the potential for future innovations. Synthetic fibers play a crucial role in modern society, impacting various aspects of daily life, industry, and the environment. ynthetic fibers are integral to modern life, offering a range of benefits from cost-effectiveness and versatility to innovative applications and performance characteristics. While they pose environmental challenges, ongoing research and development aim to create more sustainable and eco-friendly alternatives. Understanding the importance of synthetic fibers helps in appreciating their role in the economy, industry, and daily life, while also emphasizing the need for sustainable practices and innovation.
Read| The latest issue of The Challenger is here! We are thrilled to announce that our school paper has qualified for the NATIONAL SCHOOLS PRESS CONFERENCE (NSPC) 2024. Thank you for your unwavering support and trust. Dive into the stories that made us stand out!
A Strategic Approach: GenAI in EducationPeter Windle
Artificial Intelligence (AI) technologies such as Generative AI, Image Generators and Large Language Models have had a dramatic impact on teaching, learning and assessment over the past 18 months. The most immediate threat AI posed was to Academic Integrity with Higher Education Institutes (HEIs) focusing their efforts on combating the use of GenAI in assessment. Guidelines were developed for staff and students, policies put in place too. Innovative educators have forged paths in the use of Generative AI for teaching, learning and assessments leading to pockets of transformation springing up across HEIs, often with little or no top-down guidance, support or direction.
This Gasta posits a strategic approach to integrating AI into HEIs to prepare staff, students and the curriculum for an evolving world and workplace. We will highlight the advantages of working with these technologies beyond the realm of teaching, learning and assessment by considering prompt engineering skills, industry impact, curriculum changes, and the need for staff upskilling. In contrast, not engaging strategically with Generative AI poses risks, including falling behind peers, missed opportunities and failing to ensure our graduates remain employable. The rapid evolution of AI technologies necessitates a proactive and strategic approach if we are to remain relevant.
Unit 8 - Information and Communication Technology (Paper I).pdfThiyagu K
This slides describes the basic concepts of ICT, basics of Email, Emerging Technology and Digital Initiatives in Education. This presentations aligns with the UGC Paper I syllabus.
Palestine last event orientationfvgnh .pptxRaedMohamed3
An EFL lesson about the current events in Palestine. It is intended to be for intermediate students who wish to increase their listening skills through a short lesson in power point.
Embracing GenAI - A Strategic ImperativePeter Windle
Artificial Intelligence (AI) technologies such as Generative AI, Image Generators and Large Language Models have had a dramatic impact on teaching, learning and assessment over the past 18 months. The most immediate threat AI posed was to Academic Integrity with Higher Education Institutes (HEIs) focusing their efforts on combating the use of GenAI in assessment. Guidelines were developed for staff and students, policies put in place too. Innovative educators have forged paths in the use of Generative AI for teaching, learning and assessments leading to pockets of transformation springing up across HEIs, often with little or no top-down guidance, support or direction.
This Gasta posits a strategic approach to integrating AI into HEIs to prepare staff, students and the curriculum for an evolving world and workplace. We will highlight the advantages of working with these technologies beyond the realm of teaching, learning and assessment by considering prompt engineering skills, industry impact, curriculum changes, and the need for staff upskilling. In contrast, not engaging strategically with Generative AI poses risks, including falling behind peers, missed opportunities and failing to ensure our graduates remain employable. The rapid evolution of AI technologies necessitates a proactive and strategic approach if we are to remain relevant.
2024.06.01 Introducing a competency framework for languag learning materials ...Sandy Millin
http://sandymillin.wordpress.com/iateflwebinar2024
Published classroom materials form the basis of syllabuses, drive teacher professional development, and have a potentially huge influence on learners, teachers and education systems. All teachers also create their own materials, whether a few sentences on a blackboard, a highly-structured fully-realised online course, or anything in between. Despite this, the knowledge and skills needed to create effective language learning materials are rarely part of teacher training, and are mostly learnt by trial and error.
Knowledge and skills frameworks, generally called competency frameworks, for ELT teachers, trainers and managers have existed for a few years now. However, until I created one for my MA dissertation, there wasn’t one drawing together what we need to know and do to be able to effectively produce language learning materials.
This webinar will introduce you to my framework, highlighting the key competencies I identified from my research. It will also show how anybody involved in language teaching (any language, not just English!), teacher training, managing schools or developing language learning materials can benefit from using the framework.
Introduction to AI for Nonprofits with Tapp NetworkTechSoup
Dive into the world of AI! Experts Jon Hill and Tareq Monaur will guide you through AI's role in enhancing nonprofit websites and basic marketing strategies, making it easy to understand and apply.
2. Correlation
• Two variables are said to be correlated if the change in one variable results
in a corresponding change in the other variable.
• The correlation is a statistical tool which studies the relationship between
two variables.
• Correlation is concerned with the measurement of “strength of association
between variables”.
• The degree of association between two or more variables is termed as
correlation.
• Correlation analysis helps us to decide the strength of the linear
relationship between two variables.
3. Correlation
Definition:
“Correlation is a statistical tool, with the help of which, we can
determine whether or not two or more variables are correlate and if
they are correlated, what is the degree and direction of
correlation.”
“The correlation is the measure of the extent and the direction of
the relationship between two variables in a bivariate distribution.”
4. Correlation
Example:
• Height and weight of children.
• An increase in the price of the commodity by a decrease in the quantity
demanded.
Types of Correlation:
1. Positive and Negative Correlation.
2. Simple, Partial and Multiple Correlation.
3. Linear and Non-linear Correlation.
5. Correlation
1. Positive and Negative correlation:
If both the variables are varying in the same direction i.e. if one variable is
increasing and the other on an average is also increasing or if as one variable
is decreasing, the other on an average, is also decreasing, correlation is said
to be positive. If on the other hand, the variable is increasing, the other is
decreasing or vice versa, correlation is said to be negative.
• Example 1: heights and weights, amount of rainfall and yields of crops,
price and supply of a commodity, blood pressure and age.
• Example 2: price and demand of commodity, sales of woolen garments and
the summer days.
6. Correlation
2. Simple, Partial and Multiple Correlation:
When only two variables are studied, it is a case of simple
correlation. In partial and multiple correlation, three or more
variables are studied. In multiple correlation three or more variables
are studied simultaneously. In partial correlation, we have more than
two variables, but consider only two variables to be influencing each
other, the effect of the other variables being kept constant.
7. Correlation
3. Linear and Non-linear Correlation:
If the change in one variable tends to bear a constant ratio to the
change in the other variable, the correlation is said to be linear.
Correlation is said to be nonlinear if the amount of change in one
variable does nor bear a constant ratio to the amount of change in
the other variable.
8. Methods of Studying Correlation
1. Scatter diagram
• This is a graphic method of finding out relationship between the variables.
• Given data are plotted on a graph paper in the form of dots i.e. for each
pair of x and y values we put a dot and thus obtain as many points as the
number of observations.
• The greater the scatter of points over the graph, the lesser the relationship
between the variables.
10. Methods of Studying Correlation[Interpretation
• If all the points lie in a straight line, there is either perfect positive or perfect
negative correlation.
• If all the points lie on a straight falling from the lower left hand corner to the
upper right hand corner then the correlation is perfect positive. Perfect positive if
r = + 1.
• If all the points lie on a straight falling from the upper left hand corner to the
lower right hand corner then the correlation is perfect negative. Perfect negative
if r = -1.
• The nearer the points are to be straight line, the higher degree of correlation.
• The farthest the points from the straight line, the lower degree of correlation.
• If the points are widely scattered and no trend is revealed, the variables may be
un-correlated i.e. r = 0.
11. Methods of Studying Correlation
1. Karl Pearson’s Coefficient of Correlation
• A scatter diagram gives an idea about the type of relationship or association
between the variables under study. It does not tell us about the
quantification of the association between the two. In order to quantify the
relation ship between the variables a measure called correlation coefficient
developed by Karl Pearson.
• It is defined as the measure of the degree to which there is linear
association between two internally scaled variables.
• Thus, the coefficient of correlation is a number which indicates to what
extent two variables are related , to what extent variations in one go with
the variations in the other.
12. Methods of Studying Correlation
• The symbol ‘r’ or ‘rₓᵧ’ or ‘rᵧₓ’is denoted in this method and is calculated by:
r = {Cov(X,Y) ÷ Sₓ Sᵧ}
• Where Cov(X, Y) is the Sample Covariance between X and Y. Mathematically
it is defined by Cov(X, Y)={Σ(X–X̅)(Y–Y̅)} ÷(n – 1)
• Sₓ = Sample standard deviation of X, is given by Sₓ = {Σ(X – X̅)² ÷ (n – 1)}½
• Sᵧ = Sample standard deviation of Y, is given by Sᵧ = {Σ(Y – Y̅)² ÷ (n – 1)}½
𝑟 =
𝐶𝑜𝑣 𝑋, 𝑌
𝑉𝑎𝑟 𝑋 . 𝑉𝑎𝑟 𝑌
=
𝑋 − 𝑋 . 𝑌 − 𝑌
𝑋 − 𝑋 2 . 𝑌 − 𝑌 2
𝑟𝑥𝑦 =
𝑆𝑥𝑦
𝑆𝑥. 𝑆𝑦
=
𝑛 𝑋𝑌 − 𝑋 𝑌
𝑛 𝑋2 − 𝑋 2 𝑛 𝑌2 − 𝑌 2
13. Methods of Studying Correlation[Interpretation
• If the covariance is positive, the relationship is positive.
• If the covariance is negative, the relationship is negative.
• If the covariance is zero, the variables are said to be not correlated.
• The coefficient of correlation always lie between +1 to -1.
• When r = +1, there is perfect positive correlation between the variables.
• When r = -1, there is perfect negative correlation between the variables.
• The correlation coefficient is independent of the choice of both origin and
scale of observation.
• The correlation coefficient is a pure number. It is independent of the units
of measurement.
14. Methods of Studying Correlation[Properties
• The coefficient of correlation always lie between +1 to -1 i.e. -1⩽ r ⩽ +1.
• When r = 0, there is no correlation.
• When r = 0.7 to 0.999, there is high degree of correlation.
• When r = 0.5 to 0.699, there is a moderate degree of correlation.
• When r is less than 0.5, there is a low degree of correlation.
• If ‘r’ is near to +1 or -1, there is a strong linear association between the
variables.
• If ‘r’ is small(close to zero), there is low degree of correlation between the
variables.
• The coefficient of correlation is the geometric mean of the two regression
coefficients. Symbolically: r= √(bₓᵧ . bᵧₓ)
15. Coefficient of Determination
• The coefficient of determination(r²) is the square of the coefficient of
correlation.
• It is the measure of strength of the relationship between two variables.
• It is subject to more precise interpretation because it can be presented as a
proportion or as a percentage.
• The coefficient of determination gives the ratio of the explained variance
to the total variance.
• Thus, coefficient of determination:
𝑟2
=
𝑆𝑆𝑅
𝑆𝑆𝑇
= 1 −
𝑆𝑆𝐸
𝑆𝑆𝑇
𝑆𝑆𝑇 = 𝑌𝑖 − 𝑌 2
, 𝑆𝑆𝑅 = 𝑌𝑖 − 𝑌
2
, 𝑆𝑆𝐸 = 𝑌𝑖 − 𝑌𝑖
2
Regression Sum of Squares
17. Coefficient of Determination
• Definition:
“Coefficient of determination shows what amount of variability or change in
independent variable is accounted for by the variability of the dependent
variable.”
“The coefficient of determination, 𝑟2, is used to analyze how differences in
one variable can be explained by a difference in a second variable”
18. Coefficient of Determination[Properties
• The coefficient of determination is the square of the correlation(r), thus it ranges
from 0 to 1.
• With linear regression, the coefficient of determination is equal to the square of
the correlation between the x and y variables.
• If r² is equal to 0, then the dependent variable cannot be predicted from the
independent variable.
• If r² is equal to 1, then the dependent variable can be predicted from the
independent variable without any error.
• If r² is between 0 and 1, then it indicates the extent that the dependent variable
can be predictable. If R2 of 0.10 means, it is 10 percent of the variance in the y
variable is predicted from the x variable.
• Coefficient of determination (r²) is always non-negative and as such that it does
not tell us about the direction of the relationship (whether it is positive or
negative) between two series.