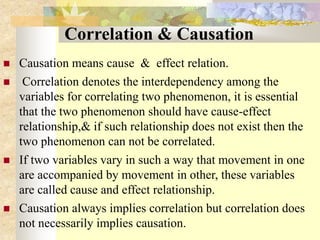
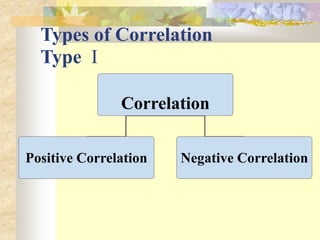
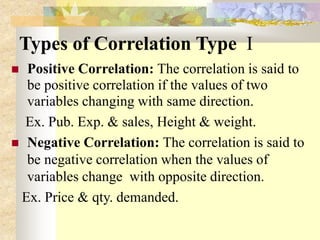
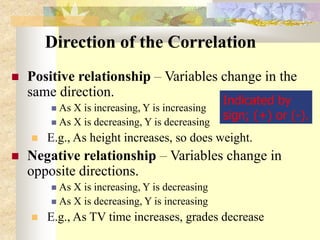
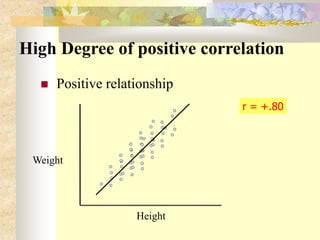
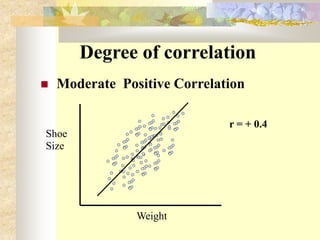
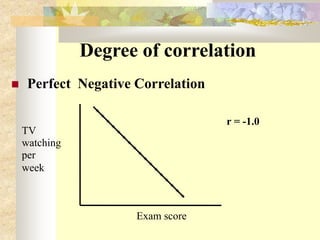
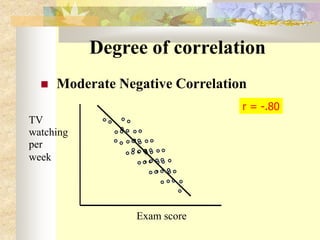
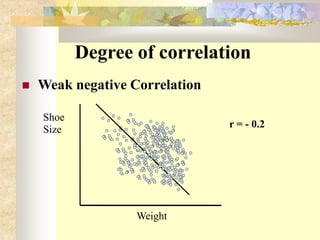
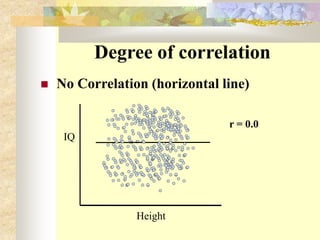
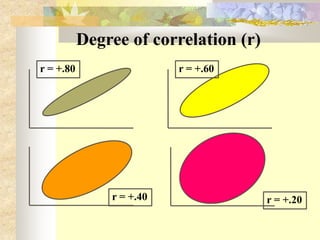
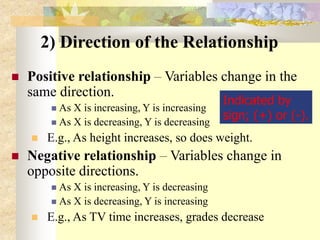
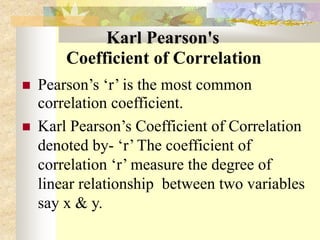
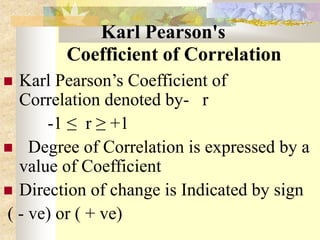
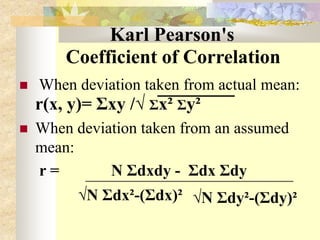
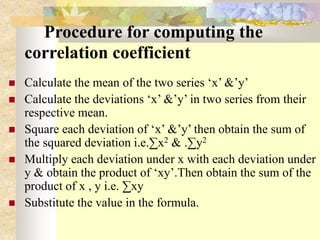
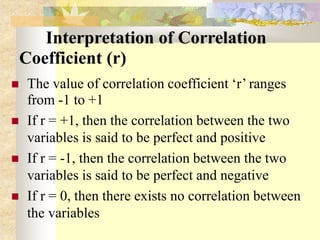
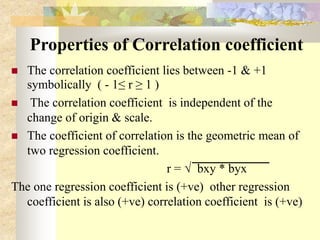
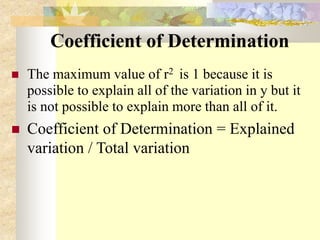
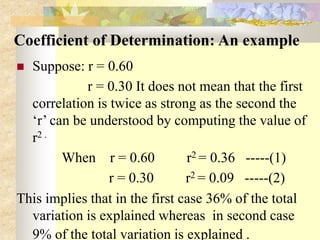
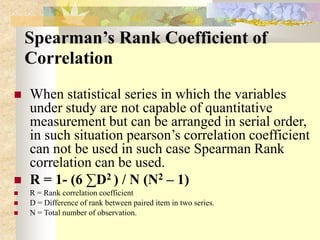
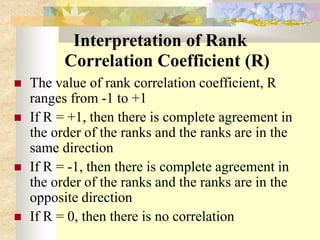
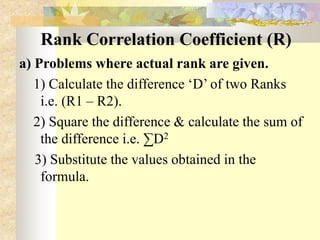
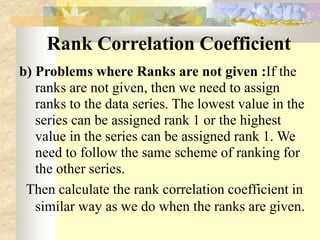
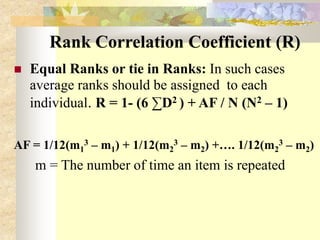
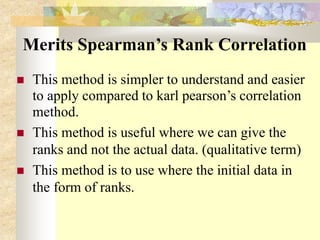
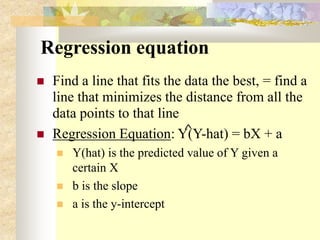
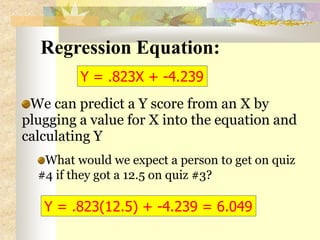
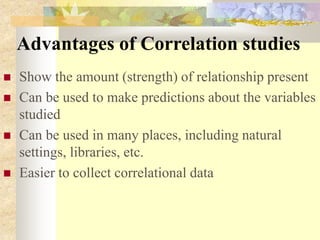
this ppt gives you adequate information about Karl Pearsonscoefficient correlation and its calculation. its the widely used to calculate a relationship between two variables. The correlation shows a specific value of the degree of a linear relationship between the X and Y variables. it is also called as The Karl Pearson‘s product-moment correlation coefficient. the value of r is alwys lies between -1 to +1. + 0.1 shows Lower degree of +ve correlation, +0.8 shows Higher degree of +ve correlation.-0.1 shows Lower degree of -ve correlation. -0.8 shows Higher degree of -ve correlation.
Regression Analysis is simplified in this presentation. Starting with simple linear to multiple regression analysis, it covers all the statistics and interpretation of various diagnostic plots. Besides, how to verify regression assumptions and some advance concepts of choosing best models makes the slides more useful SAS program codes of two examples are also included.
Unit-I, BP801T. BIOSTATISITCS AND RESEARCH METHODOLOGY (Theory)
Correlation: Definition, Karl Pearson’s coefficient of correlation, Multiple correlations -
Pharmaceuticals examples.
Correlation: is there a relationship between 2
variables.
In statistics, regression analysis is a statistical process for estimating the relationships among variables. It includes many techniques for modeling and analyzing several variables, when the focus is on the relationship between a dependent variable and one or more independent variables. More specifically, regression analysis helps one understand how the typical value of the dependent variable (or 'Criterion Variable') changes when any one of the independent variables is varied, while the other independent variables are held fixed. Most commonly, regression analysis estimates the conditional expectation of the dependent variable given the independent variables – that is, the average value of the dependent variable when the independent variables are fixed. Less commonly, the focus is on a quantile, or other location parameter of the conditional distribution of the dependent variable given the independent variables. In all cases, the estimation target is a function of the independent variables called the regression function. In regression analysis, it is also of interest to characterize the variation of the dependent variable around the regression function which can be described by a probability distribution.
Multiple regression analysis is a powerful technique used for predicting the unknown value of a variable from the known value of two or more variables.
The Spearman’s Rank Correlation Coefficient is the non-parametric statistical measure used to study the strength of association between the two ranked variables. This method is applied to the ordinal set of numbers, which can be arranged in order, i.e. one after the other so that ranks can be given to each. This presentation slides explains the procedure to find out the Rank Difference correlation and its applications.
This presentation covered the following topics:
1. Definition of Correlation and Regression
2. Meaning of Correlation and Regression
3. Types of Correlation and Regression
4. Karl Pearson's methods of correlation
5. Bivariate Grouped data method
6. Spearman's Rank correlation Method
7. Scattered diagram method
8. Interpretation of correlation coefficient
9. Lines of Regression
10. regression Equations
11. Difference between correlation and regression
12. Related examples
It is most useful for the students of BBA for the subject of "Data Analysis and Modeling"/
It has covered the content of chapter- Data regression Model
Visit for more on www.ramkumarshah.com.np/
To get a copy of the slides for free Email me at: japhethmuthama@gmail.com
You can also support my PhD studies by donating a 1 dollar to my PayPal.
PayPal ID is japhethmuthama@gmail.com
About
Indigenized remote control interface card suitable for MAFI system CCR equipment. Compatible for IDM8000 CCR. Backplane mounted serial and TCP/Ethernet communication module for CCR remote access. IDM 8000 CCR remote control on serial and TCP protocol.
• Remote control: Parallel or serial interface.
• Compatible with MAFI CCR system.
• Compatible with IDM8000 CCR.
• Compatible with Backplane mount serial communication.
• Compatible with commercial and Defence aviation CCR system.
• Remote control system for accessing CCR and allied system over serial or TCP.
• Indigenized local Support/presence in India.
• Easy in configuration using DIP switches.
Technical Specifications
Indigenized remote control interface card suitable for MAFI system CCR equipment. Compatible for IDM8000 CCR. Backplane mounted serial and TCP/Ethernet communication module for CCR remote access. IDM 8000 CCR remote control on serial and TCP protocol.
Key Features
Indigenized remote control interface card suitable for MAFI system CCR equipment. Compatible for IDM8000 CCR. Backplane mounted serial and TCP/Ethernet communication module for CCR remote access. IDM 8000 CCR remote control on serial and TCP protocol.
• Remote control: Parallel or serial interface
• Compatible with MAFI CCR system
• Copatiable with IDM8000 CCR
• Compatible with Backplane mount serial communication.
• Compatible with commercial and Defence aviation CCR system.
• Remote control system for accessing CCR and allied system over serial or TCP.
• Indigenized local Support/presence in India.
Application
• Remote control: Parallel or serial interface.
• Compatible with MAFI CCR system.
• Compatible with IDM8000 CCR.
• Compatible with Backplane mount serial communication.
• Compatible with commercial and Defence aviation CCR system.
• Remote control system for accessing CCR and allied system over serial or TCP.
• Indigenized local Support/presence in India.
• Easy in configuration using DIP switches.
Overview of the fundamental roles in Hydropower generation and the components involved in wider Electrical Engineering.
This paper presents the design and construction of hydroelectric dams from the hydrologist’s survey of the valley before construction, all aspects and involved disciplines, fluid dynamics, structural engineering, generation and mains frequency regulation to the very transmission of power through the network in the United Kingdom.
Author: Robbie Edward Sayers
Collaborators and co editors: Charlie Sims and Connor Healey.
(C) 2024 Robbie E. Sayers
Cosmetic shop management system project report.pdfKamal Acharya
Buying new cosmetic products is difficult. It can even be scary for those who have sensitive skin and are prone to skin trouble. The information needed to alleviate this problem is on the back of each product, but it's thought to interpret those ingredient lists unless you have a background in chemistry.
Instead of buying and hoping for the best, we can use data science to help us predict which products may be good fits for us. It includes various function programs to do the above mentioned tasks.
Data file handling has been effectively used in the program.
The automated cosmetic shop management system should deal with the automation of general workflow and administration process of the shop. The main processes of the system focus on customer's request where the system is able to search the most appropriate products and deliver it to the customers. It should help the employees to quickly identify the list of cosmetic product that have reached the minimum quantity and also keep a track of expired date for each cosmetic product. It should help the employees to find the rack number in which the product is placed.It is also Faster and more efficient way.
Student information management system project report ii.pdfKamal Acharya
Our project explains about the student management. This project mainly explains the various actions related to student details. This project shows some ease in adding, editing and deleting the student details. It also provides a less time consuming process for viewing, adding, editing and deleting the marks of the students.
Industrial Training at Shahjalal Fertilizer Company Limited (SFCL)MdTanvirMahtab2
This presentation is about the working procedure of Shahjalal Fertilizer Company Limited (SFCL). A Govt. owned Company of Bangladesh Chemical Industries Corporation under Ministry of Industries.
Welcome to WIPAC Monthly the magazine brought to you by the LinkedIn Group Water Industry Process Automation & Control.
In this month's edition, along with this month's industry news to celebrate the 13 years since the group was created we have articles including
A case study of the used of Advanced Process Control at the Wastewater Treatment works at Lleida in Spain
A look back on an article on smart wastewater networks in order to see how the industry has measured up in the interim around the adoption of Digital Transformation in the Water Industry.
NO1 Uk best vashikaran specialist in delhi vashikaran baba near me online vas...Amil Baba Dawood bangali
Contact with Dawood Bhai Just call on +92322-6382012 and we'll help you. We'll solve all your problems within 12 to 24 hours and with 101% guarantee and with astrology systematic. If you want to take any personal or professional advice then also you can call us on +92322-6382012 , ONLINE LOVE PROBLEM & Other all types of Daily Life Problem's.Then CALL or WHATSAPP us on +92322-6382012 and Get all these problems solutions here by Amil Baba DAWOOD BANGALI
#vashikaranspecialist #astrologer #palmistry #amliyaat #taweez #manpasandshadi #horoscope #spiritual #lovelife #lovespell #marriagespell#aamilbabainpakistan #amilbabainkarachi #powerfullblackmagicspell #kalajadumantarspecialist #realamilbaba #AmilbabainPakistan #astrologerincanada #astrologerindubai #lovespellsmaster #kalajaduspecialist #lovespellsthatwork #aamilbabainlahore#blackmagicformarriage #aamilbaba #kalajadu #kalailam #taweez #wazifaexpert #jadumantar #vashikaranspecialist #astrologer #palmistry #amliyaat #taweez #manpasandshadi #horoscope #spiritual #lovelife #lovespell #marriagespell#aamilbabainpakistan #amilbabainkarachi #powerfullblackmagicspell #kalajadumantarspecialist #realamilbaba #AmilbabainPakistan #astrologerincanada #astrologerindubai #lovespellsmaster #kalajaduspecialist #lovespellsthatwork #aamilbabainlahore #blackmagicforlove #blackmagicformarriage #aamilbaba #kalajadu #kalailam #taweez #wazifaexpert #jadumantar #vashikaranspecialist #astrologer #palmistry #amliyaat #taweez #manpasandshadi #horoscope #spiritual #lovelife #lovespell #marriagespell#aamilbabainpakistan #amilbabainkarachi #powerfullblackmagicspell #kalajadumantarspecialist #realamilbaba #AmilbabainPakistan #astrologerincanada #astrologerindubai #lovespellsmaster #kalajaduspecialist #lovespellsthatwork #aamilbabainlahore #Amilbabainuk #amilbabainspain #amilbabaindubai #Amilbabainnorway #amilbabainkrachi #amilbabainlahore #amilbabaingujranwalan #amilbabainislamabad
2. Correlation
key concepts:
Types of correlation
Methods of studying correlation
a) Scatter diagram
b) Karl pearson’s coefficient of correlation
c) Spearman’s Rank correlation coefficient
d) Method of least squares
3. Correlation
Correlation: The degree of relationship between the
variables under consideration is measure through the
correlation analysis.
The measure of correlation called the correlation coefficient
The degree of relationship is expressed by coefficient which
range from correlation ( -1 ≤ r ≥ +1)
The direction of change is indicated by a sign.
The correlation analysis enable us to have an idea about the
degree & direction of the relationship between the two
variables under study.
4. Correlation
Correlation is a statistical tool that helps
to measure and analyze the degree of
relationship between two variables.
Correlation analysis deals with the
association between two or more
variables.
5. Correlation & Causation
Causation means cause & effect relation.
Correlation denotes the interdependency among the
variables for correlating two phenomenon, it is essential
that the two phenomenon should have cause-effect
relationship,& if such relationship does not exist then the
two phenomenon can not be correlated.
If two variables vary in such a way that movement in one
are accompanied by movement in other, these variables
are called cause and effect relationship.
Causation always implies correlation but correlation does
not necessarily implies causation.
7. Types of Correlation Type I
Positive Correlation: The correlation is said to
be positive correlation if the values of two
variables changing with same direction.
Ex. Pub. Exp. & sales, Height & weight.
Negative Correlation: The correlation is said to
be negative correlation when the values of
variables change with opposite direction.
Ex. Price & qty. demanded.
8. Direction of the Correlation
Positive relationship – Variables change in the
same direction.
As X is increasing, Y is increasing
As X is decreasing, Y is decreasing
E.g., As height increases, so does weight.
Negative relationship – Variables change in
opposite directions.
As X is increasing, Y is decreasing
As X is decreasing, Y is increasing
E.g., As TV time increases, grades decrease
Indicated by
sign; (+) or (-).
9. More examples
Positive relationships
water consumption
and temperature.
study time and
grades.
Negative relationships:
alcohol consumption
and driving ability.
Price & quantity
demanded
11. Types of Correlation Type II
Simple correlation: Under simple correlation
problem there are only two variables are studied.
Multiple Correlation: Under Multiple
Correlation three or more than three variables
are studied. Ex. Qd = f ( P,PC, PS, t, y )
Partial correlation: analysis recognizes more
than two variables but considers only two
variables keeping the other constant.
Total correlation: is based on all the relevant
variables, which is normally not feasible.
13. Types of Correlation Type III
Linear correlation: Correlation is said to be linear
when the amount of change in one variable tends to
bear a constant ratio to the amount of change in the
other. The graph of the variables having a linear
relationship will form a straight line.
Ex X = 1, 2, 3, 4, 5, 6, 7, 8,
Y = 5, 7, 9, 11, 13, 15, 17, 19,
Y = 3 + 2x
Non Linear correlation: The correlation would be
non linear if the amount of change in one variable
does not bear a constant ratio to the amount of change
in the other variable.
14. Methods of Studying Correlation
Scatter Diagram Method
Graphic Method
Karl Pearson’s Coefficient of
Correlation
Method of Least Squares
15. Scatter Diagram Method
Scatter Diagram is a graph of observed
plotted points where each points
represents the values of X & Y as a
coordinate. It portrays the relationship
between these two variables graphically.
16. A perfect positive correlation
Height
Weight
Height
of A
Weight
of A
Height
of B
Weight
of B
A linear
relationship
17. High Degree of positive correlation
Positive relationship
Height
Weight
r = +.80
24. 2) Direction of the Relationship
Positive relationship – Variables change in the
same direction.
As X is increasing, Y is increasing
As X is decreasing, Y is decreasing
E.g., As height increases, so does weight.
Negative relationship – Variables change in
opposite directions.
As X is increasing, Y is decreasing
As X is decreasing, Y is increasing
E.g., As TV time increases, grades decrease
Indicated by
sign; (+) or (-).
25. Advantages of Scatter Diagram
Simple & Non Mathematical method
Not influenced by the size of extreme
item
First step in investing the relationship
between two variables
27. Karl Pearson's
Coefficient of Correlation
Pearson’s ‘r’ is the most common
correlation coefficient.
Karl Pearson’s Coefficient of Correlation
denoted by- ‘r’ The coefficient of
correlation ‘r’ measure the degree of
linear relationship between two variables
say x & y.
28. Karl Pearson's
Coefficient of Correlation
Karl Pearson’s Coefficient of
Correlation denoted by- r
-1 ≤ r ≥ +1
Degree of Correlation is expressed by a
value of Coefficient
Direction of change is Indicated by sign
( - ve) or ( + ve)
29. Karl Pearson's
Coefficient of Correlation
When deviation taken from actual mean:
r(x, y)= Σxy /√ Σx² Σy²
When deviation taken from an assumed
mean:
r = N Σdxdy - Σdx Σdy
√N Σdx²-(Σdx)² √N Σdy²-(Σdy)²
30. Procedure for computing the
correlation coefficient
Calculate the mean of the two series ‘x’ &’y’
Calculate the deviations ‘x’ &’y’ in two series from their
respective mean.
Square each deviation of ‘x’ &’y’ then obtain the sum of
the squared deviation i.e.∑x2 & .∑y2
Multiply each deviation under x with each deviation under
y & obtain the product of ‘xy’.Then obtain the sum of the
product of x , y i.e. ∑xy
Substitute the value in the formula.
31. Interpretation of Correlation
Coefficient (r)
The value of correlation coefficient ‘r’ ranges
from -1 to +1
If r = +1, then the correlation between the two
variables is said to be perfect and positive
If r = -1, then the correlation between the two
variables is said to be perfect and negative
If r = 0, then there exists no correlation between
the variables
32. Properties of Correlation coefficient
The correlation coefficient lies between -1 & +1
symbolically ( - 1≤ r ≥ 1 )
The correlation coefficient is independent of the
change of origin & scale.
The coefficient of correlation is the geometric mean of
two regression coefficient.
r = √ bxy * byx
The one regression coefficient is (+ve) other regression
coefficient is also (+ve) correlation coefficient is (+ve)
33. Assumptions of Pearson’s
Correlation Coefficient
There is linear relationship between two
variables, i.e. when the two variables are
plotted on a scatter diagram a straight line
will be formed by the points.
Cause and effect relation exists between
different forces operating on the item of
the two variable series.
34. Advantages of Pearson’s Coefficient
It summarizes in one value, the
degree of correlation & direction
of correlation also.
35. Limitation of Pearson’s Coefficient
Always assume linear relationship
Interpreting the value of r is difficult.
Value of Correlation Coefficient is
affected by the extreme values.
Time consuming methods
36. Coefficient of Determination
The convenient way of interpreting the value of
correlation coefficient is to use of square of
coefficient of correlation which is called
Coefficient of Determination.
The Coefficient of Determination = r2.
Suppose: r = 0.9, r2 = 0.81 this would mean that
81% of the variation in the dependent variable
has been explained by the independent variable.
37. Coefficient of Determination
The maximum value of r2 is 1 because it is
possible to explain all of the variation in y but it
is not possible to explain more than all of it.
Coefficient of Determination = Explained
variation / Total variation
38. Coefficient of Determination: An example
Suppose: r = 0.60
r = 0.30 It does not mean that the first
correlation is twice as strong as the second the
‘r’ can be understood by computing the value of
r2 .
When r = 0.60 r2 = 0.36 -----(1)
r = 0.30 r2 = 0.09 -----(2)
This implies that in the first case 36% of the total
variation is explained whereas in second case
9% of the total variation is explained .
39. Spearman’s Rank Coefficient of
Correlation
When statistical series in which the variables
under study are not capable of quantitative
measurement but can be arranged in serial order,
in such situation pearson’s correlation coefficient
can not be used in such case Spearman Rank
correlation can be used.
R = 1- (6 ∑D2 ) / N (N2 – 1)
R = Rank correlation coefficient
D = Difference of rank between paired item in two series.
N = Total number of observation.
40. Interpretation of Rank
Correlation Coefficient (R)
The value of rank correlation coefficient, R
ranges from -1 to +1
If R = +1, then there is complete agreement in
the order of the ranks and the ranks are in the
same direction
If R = -1, then there is complete agreement in
the order of the ranks and the ranks are in the
opposite direction
If R = 0, then there is no correlation
41. Rank Correlation Coefficient (R)
a) Problems where actual rank are given.
1) Calculate the difference ‘D’ of two Ranks
i.e. (R1 – R2).
2) Square the difference & calculate the sum of
the difference i.e. ∑D2
3) Substitute the values obtained in the
formula.
42. Rank Correlation Coefficient
b) Problems where Ranks are not given :If the
ranks are not given, then we need to assign
ranks to the data series. The lowest value in the
series can be assigned rank 1 or the highest
value in the series can be assigned rank 1. We
need to follow the same scheme of ranking for
the other series.
Then calculate the rank correlation coefficient in
similar way as we do when the ranks are given.
43. Rank Correlation Coefficient (R)
Equal Ranks or tie in Ranks: In such cases
average ranks should be assigned to each
individual. R = 1- (6 ∑D2 ) + AF / N (N2 – 1)
AF = 1/12(m1
3 – m1) + 1/12(m2
3 – m2) +…. 1/12(m2
3 – m2)
m = The number of time an item is repeated
44. Merits Spearman’s Rank Correlation
This method is simpler to understand and easier
to apply compared to karl pearson’s correlation
method.
This method is useful where we can give the
ranks and not the actual data. (qualitative term)
This method is to use where the initial data in
the form of ranks.
45. Limitation Spearman’s Correlation
Cannot be used for finding out correlation in a
grouped frequency distribution.
This method should be applied where N
exceeds 30.
46. Advantages of Correlation studies
Show the amount (strength) of relationship
present
Can be used to make predictions about the
variables under study.
Can be used in many places, including natural
settings, libraries, etc.
Easier to collect co relational data
47. Regression Analysis
Regression Analysis is a very
powerful tool in the field of statistical
analysis in predicting the value of one
variable, given the value of another
variable, when those variables are
related to each other.
48. Regression Analysis
Regression Analysis is mathematical measure of
average relationship between two or more
variables.
Regression analysis is a statistical tool used in
prediction of value of unknown variable from
known variable.
49. Advantages of Regression Analysis
Regression analysis provides estimates of
values of the dependent variables from the
values of independent variables.
Regression analysis also helps to obtain a
measure of the error involved in using the
regression line as a basis for estimations .
Regression analysis helps in obtaining a
measure of the degree of association or
correlation that exists between the two variable.
50. Existence of actual linear relationship.
The regression analysis is used to estimate the
values within the range for which it is valid.
The relationship between the dependent and
independent variables remains the same till the
regression equation is calculated.
The dependent variable takes any random value but
the values of the independent variables are fixed.
In regression, we have only one dependant variable
in our estimating equation. However, we can use
more than one independent variable.
Assumptions in Regression Analysis
51. Regression line
Regression line is the line which gives the best
estimate of one variable from the value of any
other given variable.
The regression line gives the average
relationship between the two variables in
mathematical form.
The Regression would have the following
properties: a) ∑( Y – Yc ) = 0 and
b) ∑( Y – Yc )2 = Minimum
52. Regression line
For two variables X and Y, there are always two
lines of regression –
Regression line of X on Y : gives the best
estimate for the value of X for any specific
given values of Y
X = a + b Y a = X - intercept
b = Slope of the line
X = Dependent variable
Y = Independent variable
53. Regression line
For two variables X and Y, there are always two
lines of regression –
Regression line of Y on X : gives the best
estimate for the value of Y for any specific given
values of X
Y = a + bx a = Y - intercept
b = Slope of the line
Y = Dependent variable
x= Independent variable
54. The Explanation of Regression Line
In case of perfect correlation ( positive or
negative ) the two line of regression coincide.
If the two R. line are far from each other then
degree of correlation is less, & vice versa.
The mean values of X &Y can be obtained as
the point of intersection of the two regression
line.
The higher degree of correlation between the
variables, the angle between the lines is
smaller & vice versa.
55. Regression Equation / Line
& Method of Least Squares
Regression Equation of y on x
Y = a + bx
In order to obtain the values of ‘a’ & ‘b’
∑y = na + b∑x
∑xy = a∑x + b∑x2
Regression Equation of x on y
X = c + dy
In order to obtain the values of ‘c’ & ‘d’
∑x = nc + d∑y
∑xy = c∑y + d∑y2
56. Regression Equation / Line when
Deviation taken from Arithmetic Mean
Regression Equation of y on x:
Y = a + bx
In order to obtain the values of ‘a’ & ‘b’
a = Y – bX b = ∑xy / ∑x2
Regression Equation of x on y:
X = c + dy
c = X – dY d = ∑xy / ∑y2
57. Regression Equation / Line when
Deviation taken from Arithmetic Mean
Regression Equation of y on x:
Y – Y = byx (X –X)
byx = ∑xy / ∑x2
byx = r (σy / σx )
Regression Equation of x on y:
X – X = bxy (Y –Y)
bxy = ∑xy / ∑y2
bxy = r (σx / σy )
58. Properties of the Regression Coefficients
The coefficient of correlation is geometric mean of the two
regression coefficients. r = √ byx * bxy
If byx is positive than bxy should also be positive & vice
versa.
If one regression coefficient is greater than one the other
must be less than one.
The coefficient of correlation will have the same sign as
that our regression coefficient.
Arithmetic mean of byx & bxy is equal to or greater than
coefficient of correlation. byx + bxy / 2 ≥ r
Regression coefficient are independent of origin but not of
scale.
59. Standard Error of Estimate.
Standard Error of Estimate is the measure of
variation around the computed regression line.
Standard error of estimate (SE) of Y measure the
variability of the observed values of Y around the
regression line.
Standard error of estimate gives us a measure about
the line of regression. of the scatter of the
observations about the line of regression.
60. Standard Error of Estimate.
Standard Error of Estimate of Y on X is:
S.E. of Yon X (SExy) = √∑(Y – Ye )2 / n-2
Y = Observed value of y
Ye = Estimated values from the estimated equation that correspond
to each y value
e = The error term (Y – Ye)
n = Number of observation in sample.
The convenient formula:
(SExy) = √∑Y2 _ a∑Y_ b∑YX / n – 2
X = Value of independent variable.
Y = Value of dependent variable.
a = Y intercept.
b = Slope of estimating equation.
n = Number of data points.
61. Correlation analysis vs.
Regression analysis.
Regression is the average relationship between two
variables
Correlation need not imply cause & effect
relationship between the variables understudy.- R A
clearly indicate the cause and effect relation ship
between the variables.
There may be non-sense correlation between two
variables.- There is no such thing like non-sense
regression.
65. What is regression?
Fitting a line to the data using an equation in order
to describe and predict data
Simple Regression
Uses just 2 variables (X and Y)
Other: Multiple Regression (one Y and many X’s)
Linear Regression
Fits data to a straight line
Other: Curvilinear Regression (curved line)
We’re doing: Simple, Linear Regression
66. From Geometry:
Any line can be described by an equation
For any point on a line for X, there will be a
corresponding Y
the equation for this is y = mx + b
m is the slope, b is the Y-intercept (when X = 0)
Slope = change in Y per unit change in X
Y-intercept = where the line crosses the Y axis
(when X = 0)
67. Regression equation
Find a line that fits the data the best, = find a
line that minimizes the distance from all the
data points to that line
Regression Equation: Y(Y-hat) = bX + a
Y(hat) is the predicted value of Y given a
certain X
b is the slope
a is the y-intercept
^
68. Regression Equation:
We can predict a Y score from an X by
plugging a value for X into the equation and
calculating Y
What would we expect a person to get on quiz
#4 if they got a 12.5 on quiz #3?
Y = .823X + -4.239
Y = .823(12.5) + -4.239 = 6.049
69. Advantages of Correlation studies
Show the amount (strength) of relationship present
Can be used to make predictions about the variables
studied
Can be used in many places, including natural
settings, libraries, etc.
Easier to collect correlational data