Download as PDF, PPTX

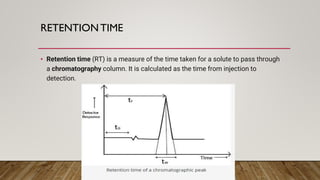
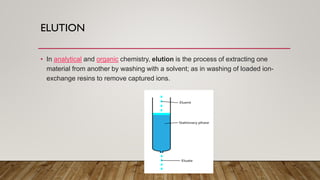
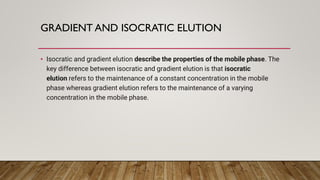
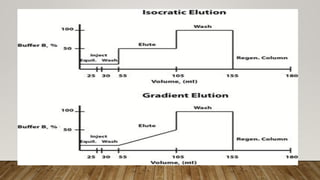
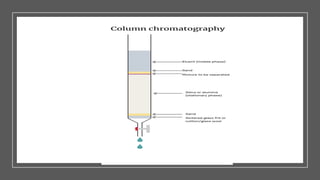
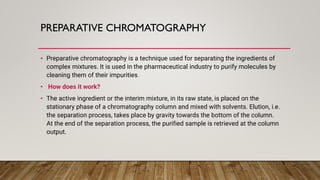
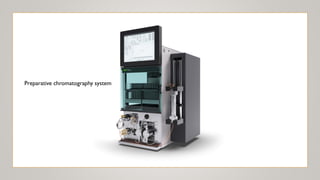


This document provides an overview of key concepts in chromatography. It defines terminology like stationary phase, mobile phase, retention time, and gradient vs isocratic elution. It also describes different types of chromatography like normal phase vs reverse phase, planar chromatography, column chromatography, and preparative chromatography. Quantitative analysis techniques and factors that influence column performance are also briefly covered.


