Dr. Ahmed M.Abdel-Megied
Dr. Ahmed M. Abdel-Megied,
Ph.D
Lecturer of Pharmaceutical Analytical Chemistry
Lec (2)
Analytical Chemistry
Instrumental Analysis
2.
Dr. Ahmed M.Abdel-Megied
Separation techniques
Introduction to CHROMATOGRAPHY
3.
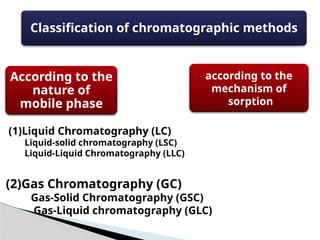
Classification of chromatographicmethods
according to the
mechanism of
sorption
According to the
nature of
mobile phase
(1)Liquid Chromatography (LC)
Liquid-solid chromatography (LSC)
Liquid-Liquid Chromatography (LLC)
(2)Gas Chromatography (GC)
Gas-Solid Chromatography (GSC)
Gas-Liquid chromatography (GLC)
4.
Dr. Ahmed M.Abdel-Megied
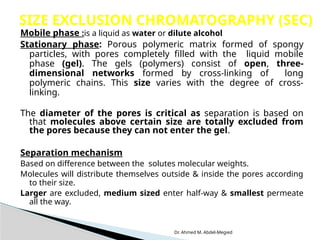
Mobile phase :is a liquid as water or dilute alcohol
Stationary phase: Porous polymeric matrix formed of spongy
particles, with pores completely filled with the liquid mobile
phase (gel). The gels (polymers) consist of open, three-
dimensional networks formed by cross-linking of long
polymeric chains. This size varies with the degree of cross-
linking.
The diameter of the pores is critical as separation is based on
that molecules above certain size are totally excluded from
the pores because they can not enter the gel.
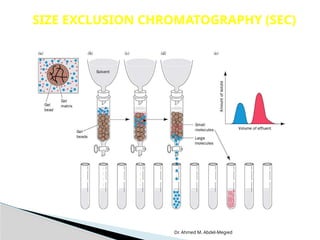
Separation mechanism
Based on difference between the solutes molecular weights.
Molecules will distribute themselves outside & inside the pores according
to their size.
Larger are excluded, medium sized enter half-way & smallest permeate
all the way.
SIZE EXCLUSION CHROMATOGRAPHY (SEC)
5.
Dr. Ahmed M.Abdel-Megied
SIZE EXCLUSION CHROMATOGRAPHY (SEC)
6.
Dr. Ahmed M.Abdel-Megied
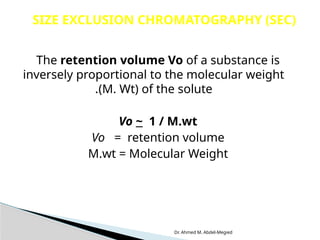
The retention volume Vo of a substance is
inversely proportional to the molecular weight
(M. Wt) of the solute
.
Vo ~ 1 / M.wt
Vo = retention volume
M.wt = Molecular Weight
SIZE EXCLUSION CHROMATOGRAPHY (SEC)
7.
Dr. Ahmed M.Abdel-Megied
Determination of M. wt. of peptides, proteins &
polysaccharides.
Desalting of colloids e.g. desalting of albumin
prepared with 2% (NH4)2SO4.
Separation of mixture of mono- & polysaccharides.
Separation of amino acids from peptides & proteins.
Separation of proteins of different molecular
weights.
Separation of mucopolysaccharides & soluble RNA.
Separation of alkaloids & purification of enzymes.
Applicatio
ns
SIZE EXCLUSION CHROMATOGRAPHY (SEC)
8.
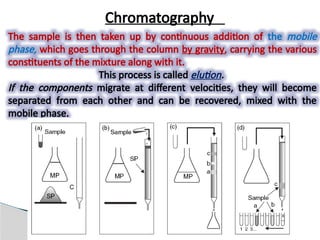
Chromatography
The sample isthen taken up by continuous addition of the mobile
phase, which goes through the column by gravity, carrying the various
constituents of the mixture along with it.
This process is called elution.
If the components migrate at different velocities, they will become
separated from each other and can be recovered, mixed with the
mobile phase.
9.
Chromatography
This basic procedure,carried out in a column, has been used since its
discovery on a large scale for the separation or purification of numerous
compounds (preparative column chromatography), but it has also progressed
into a stand-alone analytical technique, particularly once the idea of
measuring the migration times of the different compounds as a mean to
identify them had been conceived, without the need for their collection.
To do that, an optical device was placed at the column exit, which indicated
the variation of the composition of the eluting phase with time.
This form of chromatography, whose goal is not simply to recover the
components but to control their migration, first appeared around 1940
though its development since has been relatively slow.
10.
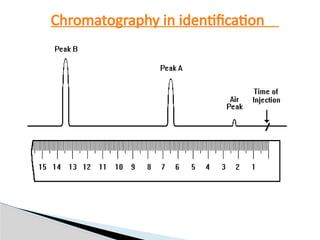
Chromatography in identification
Theidentification of a compound by chromatography is achieved by
comparison:
-To identify a compound which may be A or B, a solution of this unknown is run
on a column.
-Next, its retention time is compared with those for the two reference
compounds A and B previously recorded using the same apparatus and the
same experimental conditions.
-The choice between A and B for the unknown is done by comparison of the
retention times.
In this experiment a true separation had not been effected (A and B were pure
products) but only a comparison of their times of migration was performed.
The essential recordingthat is obtained for each separation is called a
chromatogram.
It corresponds to a two-dimensional diagram traced on a chart paper
or a screen that reveals the variations of composition of the eluting
mobile phase as it exits the column.
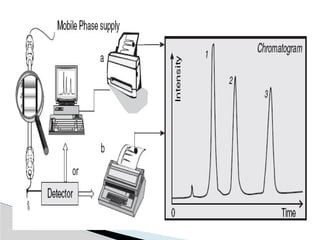
To obtain this document, a sensor, of which there exists a great variety,
needs to be placed at the outlet of the column.
The detector signal appears as the ordinate of the chromatogram while
time or alternatively elution volume appears on the abscissa.
Chromatogram
15.
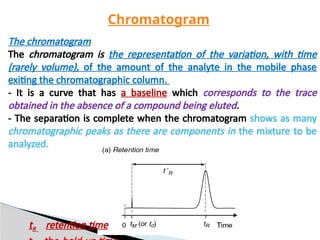
The chromatogram
The chromatogramis the representation of the variation, with time
(rarely volume), of the amount of the analyte in the mobile phase
exiting the chromatographic column.
- It is a curve that has a baseline which corresponds to the trace
obtained in the absence of a compound being eluted.
- The separation is complete when the chromatogram shows as many
chromatographic peaks as there are components in the mixture to be
analyzed.
Chromatogram
tR retention time
16.
Dr. Ahmed M.Abdel-Megied
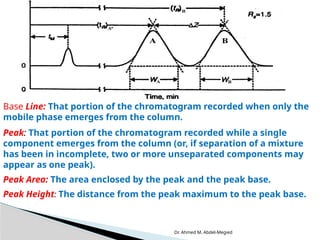
Base Line: That portion of the chromatogram recorded when only the
mobile phase emerges from the column.
Peak: That portion of the chromatogram recorded while a single
component emerges from the column (or, if separation of a mixture
has been in incomplete, two or more unseparated components may
appear as one peak).
Peak Area: The area enclosed by the peak and the peak base.
Peak Height: The distance from the peak maximum to the peak base.
17.
Dr. Ahmed M.Abdel-Megied
Peak Width (W): The magnitude of the peak base intercepted by the
tangents to the inflection points of the peak.
Retention time (tR): The time between sample injection and the appearance
of a solute peak at the detector of a chromatographic column.
Dead time (tM): The time it takes for an unretained species (mobile
phase) to pass through a column.
adjusted Retention Time (tR) is the time solute spent in the stationary
phase, and equals to [tR -tM].
18.
Dr. Ahmed M.Abdel-Megied
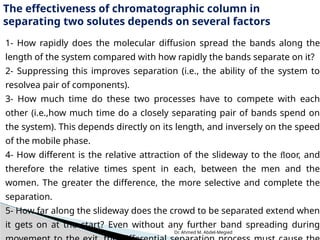
The effectiveness of chromatographic column in
separating two solutes depends on several factors
1- How rapidly does the molecular diffusion spread the bands along the
length of the system compared with how rapidly the bands separate on it?
2- Suppressing this improves separation (i.e., the ability of the system to
resolvea pair of components).
3- How much time do these two processes have to compete with each
other (i.e.,how much time do a closely separating pair of bands spend on
the system). This depends directly on its length, and inversely on the speed
of the mobile phase.
4- How different is the relative attraction of the slideway to the floor, and
therefore the relative times spent in each, between the men and the
women. The greater the difference, the more selective and complete the
separation.
5- How far along the slideway does the crowd to be separated extend when
it gets on at the start? Even without any further band spreading during
19.
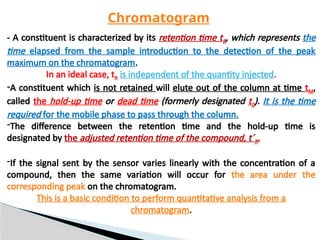
- A constituentis characterized by its retention time tR, which represents the
time elapsed from the sample introduction to the detection of the peak
maximum on the chromatogram.
In an ideal case, tR is independent of the quantity injected.
-A constituent which is not retained will elute out of the column at time tM,
called the hold-up time or dead time (formerly designated t0). It is the time
required for the mobile phase to pass through the column.
-The difference between the retention time and the hold-up time is
designated by the adjusted retention time of the compound, t´R.
-If the signal sent by the sensor varies linearly with the concentration of a
compound, then the same variation will occur for the area under the
corresponding peak on the chromatogram.
This is a basic condition to perform quantitative analysis from a
chromatogram.
Chromatogram
20.
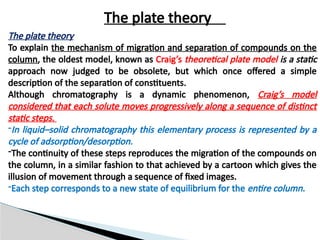
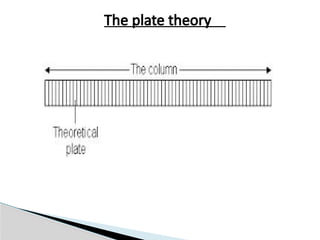
The plate theory
Theplate theory
To explain the mechanism of migration and separation of compounds on the
column, the oldest model, known as Craig’s theoretical plate model is a static
approach now judged to be obsolete, but which once offered a simple
description of the separation of constituents.
Although chromatography is a dynamic phenomenon, Craig’s model
considered that each solute moves progressively along a sequence of distinct
static steps.
-In liquid–solid chromatography this elementary process is represented by a
cycle of adsorption/desorption.
-The continuity of these steps reproduces the migration of the compounds on
the column, in a similar fashion to that achieved by a cartoon which gives the
illusion of movement through a sequence of fixed images.
-Each step corresponds to a new state of equilibrium for the entire column.
21.
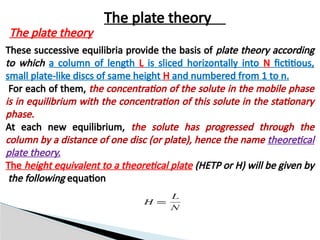
These successive equilibriaprovide the basis of plate theory according
to which a column of length L is sliced horizontally into N fictitious,
small plate-like discs of same height H and numbered from 1 to n.
For each of them, the concentration of the solute in the mobile phase
is in equilibrium with the concentration of this solute in the stationary
phase.
At each new equilibrium, the solute has progressed through the
column by a distance of one disc (or plate), hence the name theoretical
plate theory.
The height equivalent to a theoretical plate (HETP or H) will be given by
the following equation
The plate theory
The plate theory
Dr. Ahmed M.Abdel-Megied
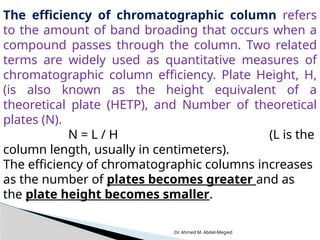
The efficiency of chromatographic column refers
to the amount of band broading that occurs when a
compound passes through the column. Two related
terms are widely used as quantitative measures of
chromatographic column efficiency. Plate Height, H,
(is also known as the height equivalent of a
theoretical plate (HETP), and Number of theoretical
plates (N).
N = L / H (L is the
column length, usually in centimeters).
The efficiency of chromatographic columns increases
as the number of plates becomes greater and as
the plate height becomes smaller.
![Dr. Ahmed M. Abdel-Megied
Peak Width (W): The magnitude of the peak base intercepted by the
tangents to the inflection points of the peak.
Retention time (tR): The time between sample injection and the appearance
of a solute peak at the detector of a chromatographic column.
Dead time (tM): The time it takes for an unretained species (mobile
phase) to pass through a column.
adjusted Retention Time (tR) is the time solute spent in the stationary
phase, and equals to [tR -tM].](https://image.slidesharecdn.com/lecture2-copy-251228164131-38dde66c/85/Instrumental-analysis_-Chromatography_-Lecture-2-17-320.jpg)