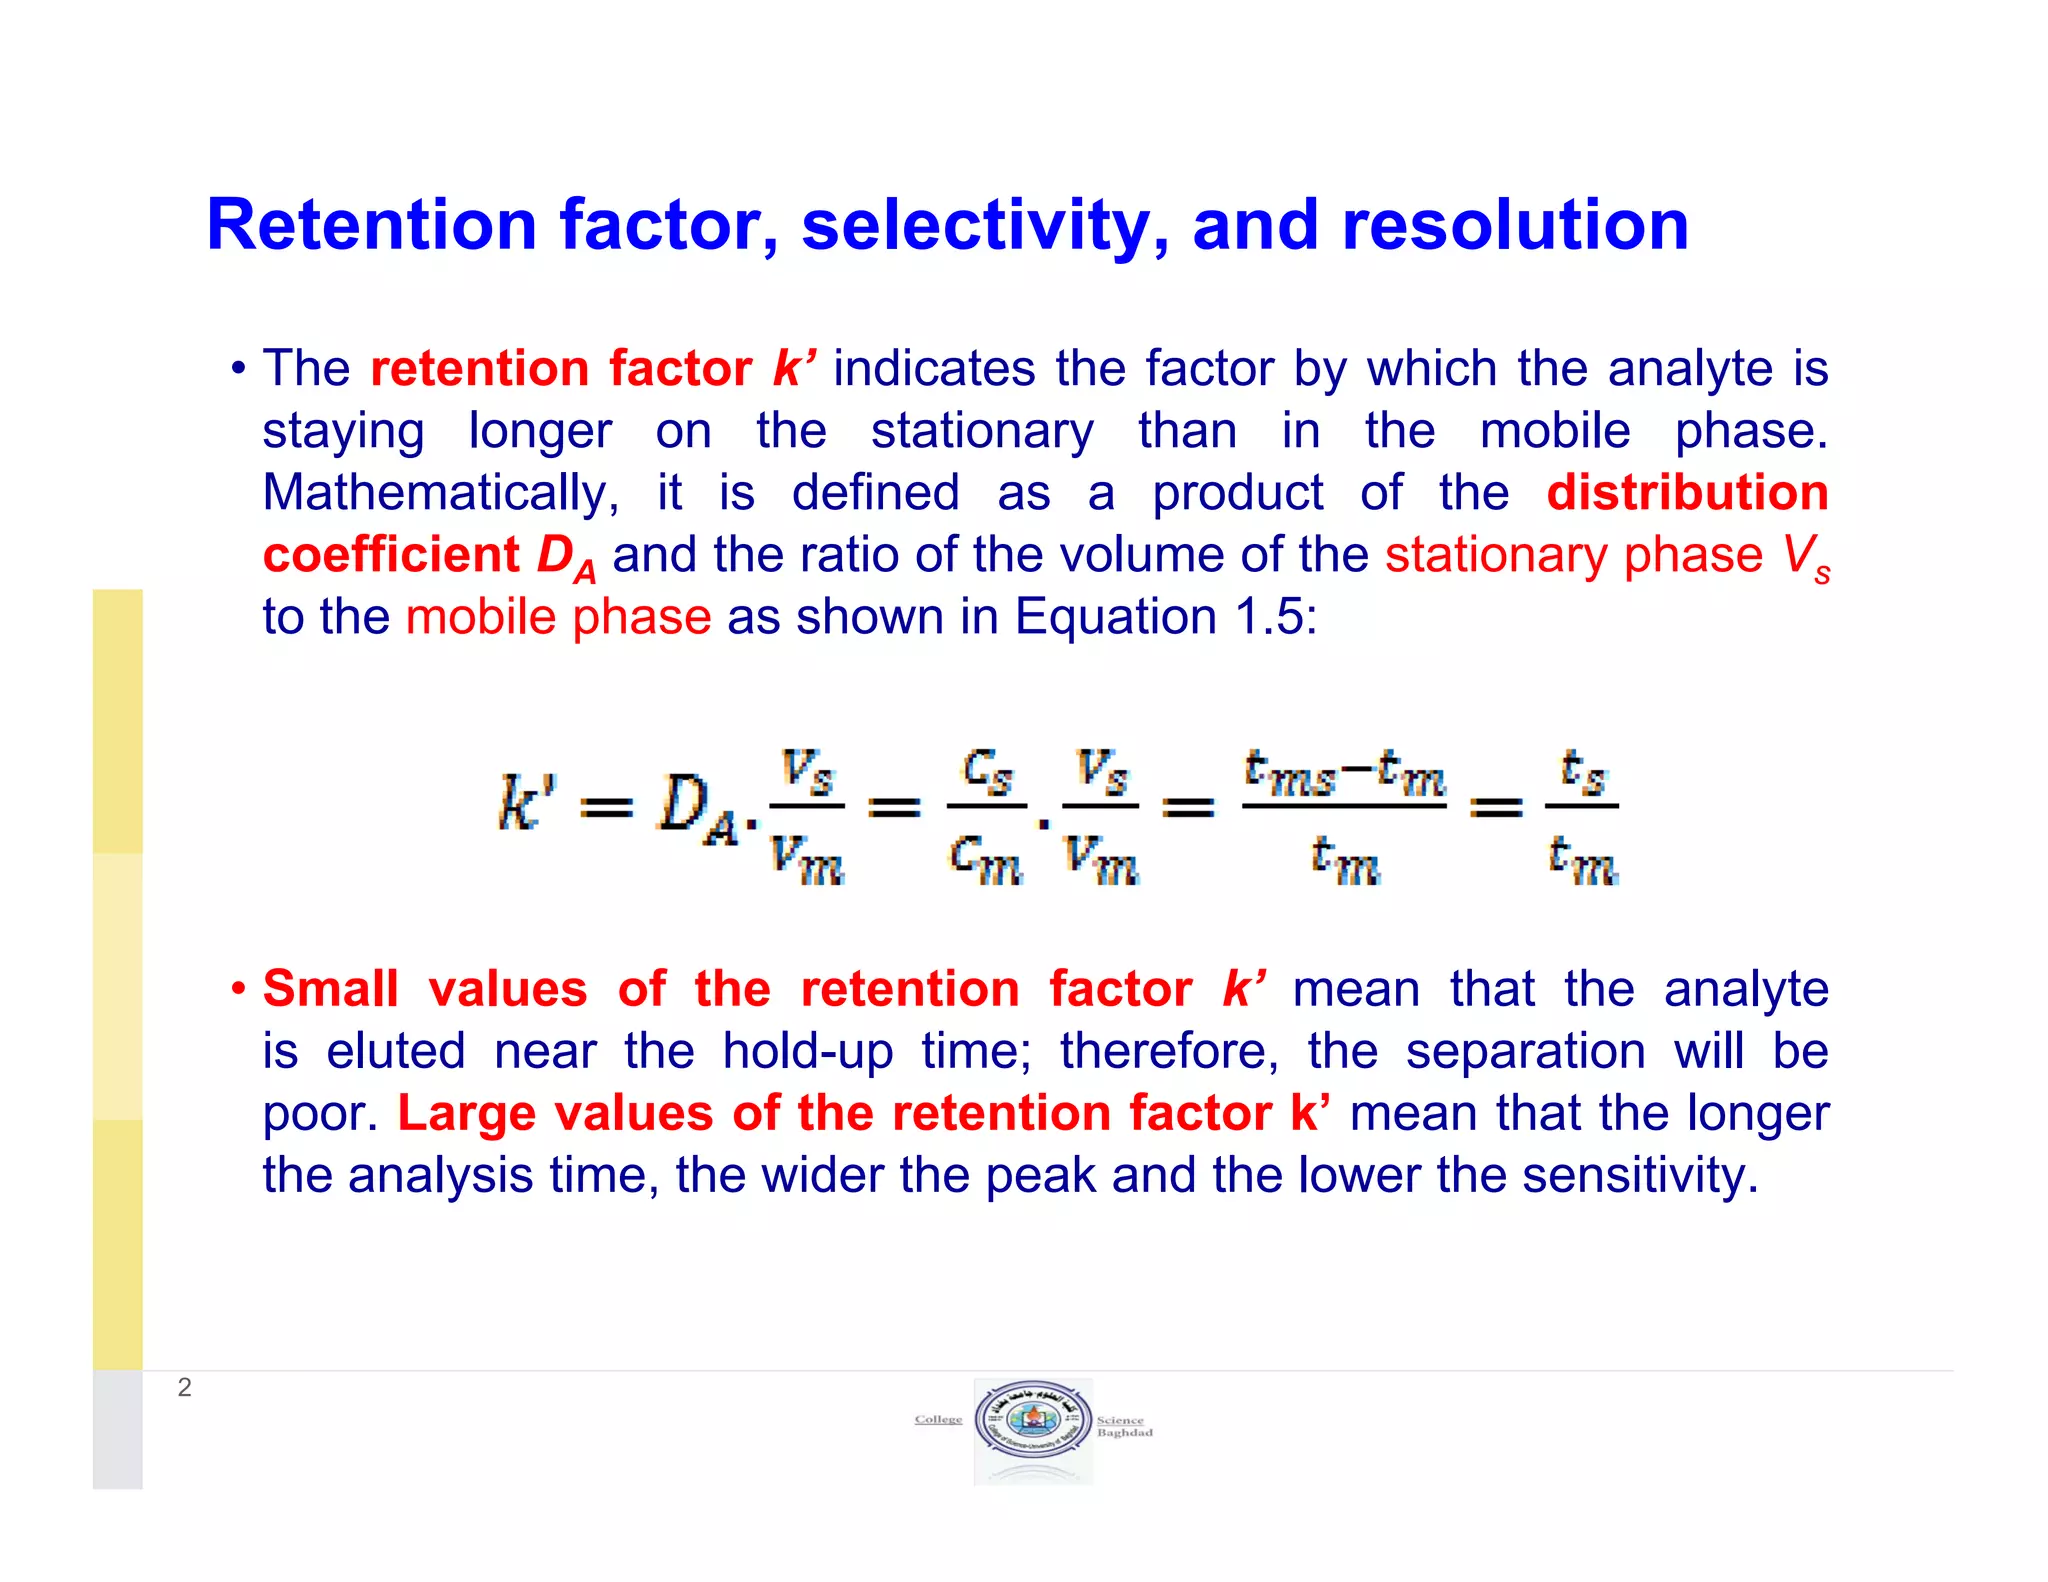
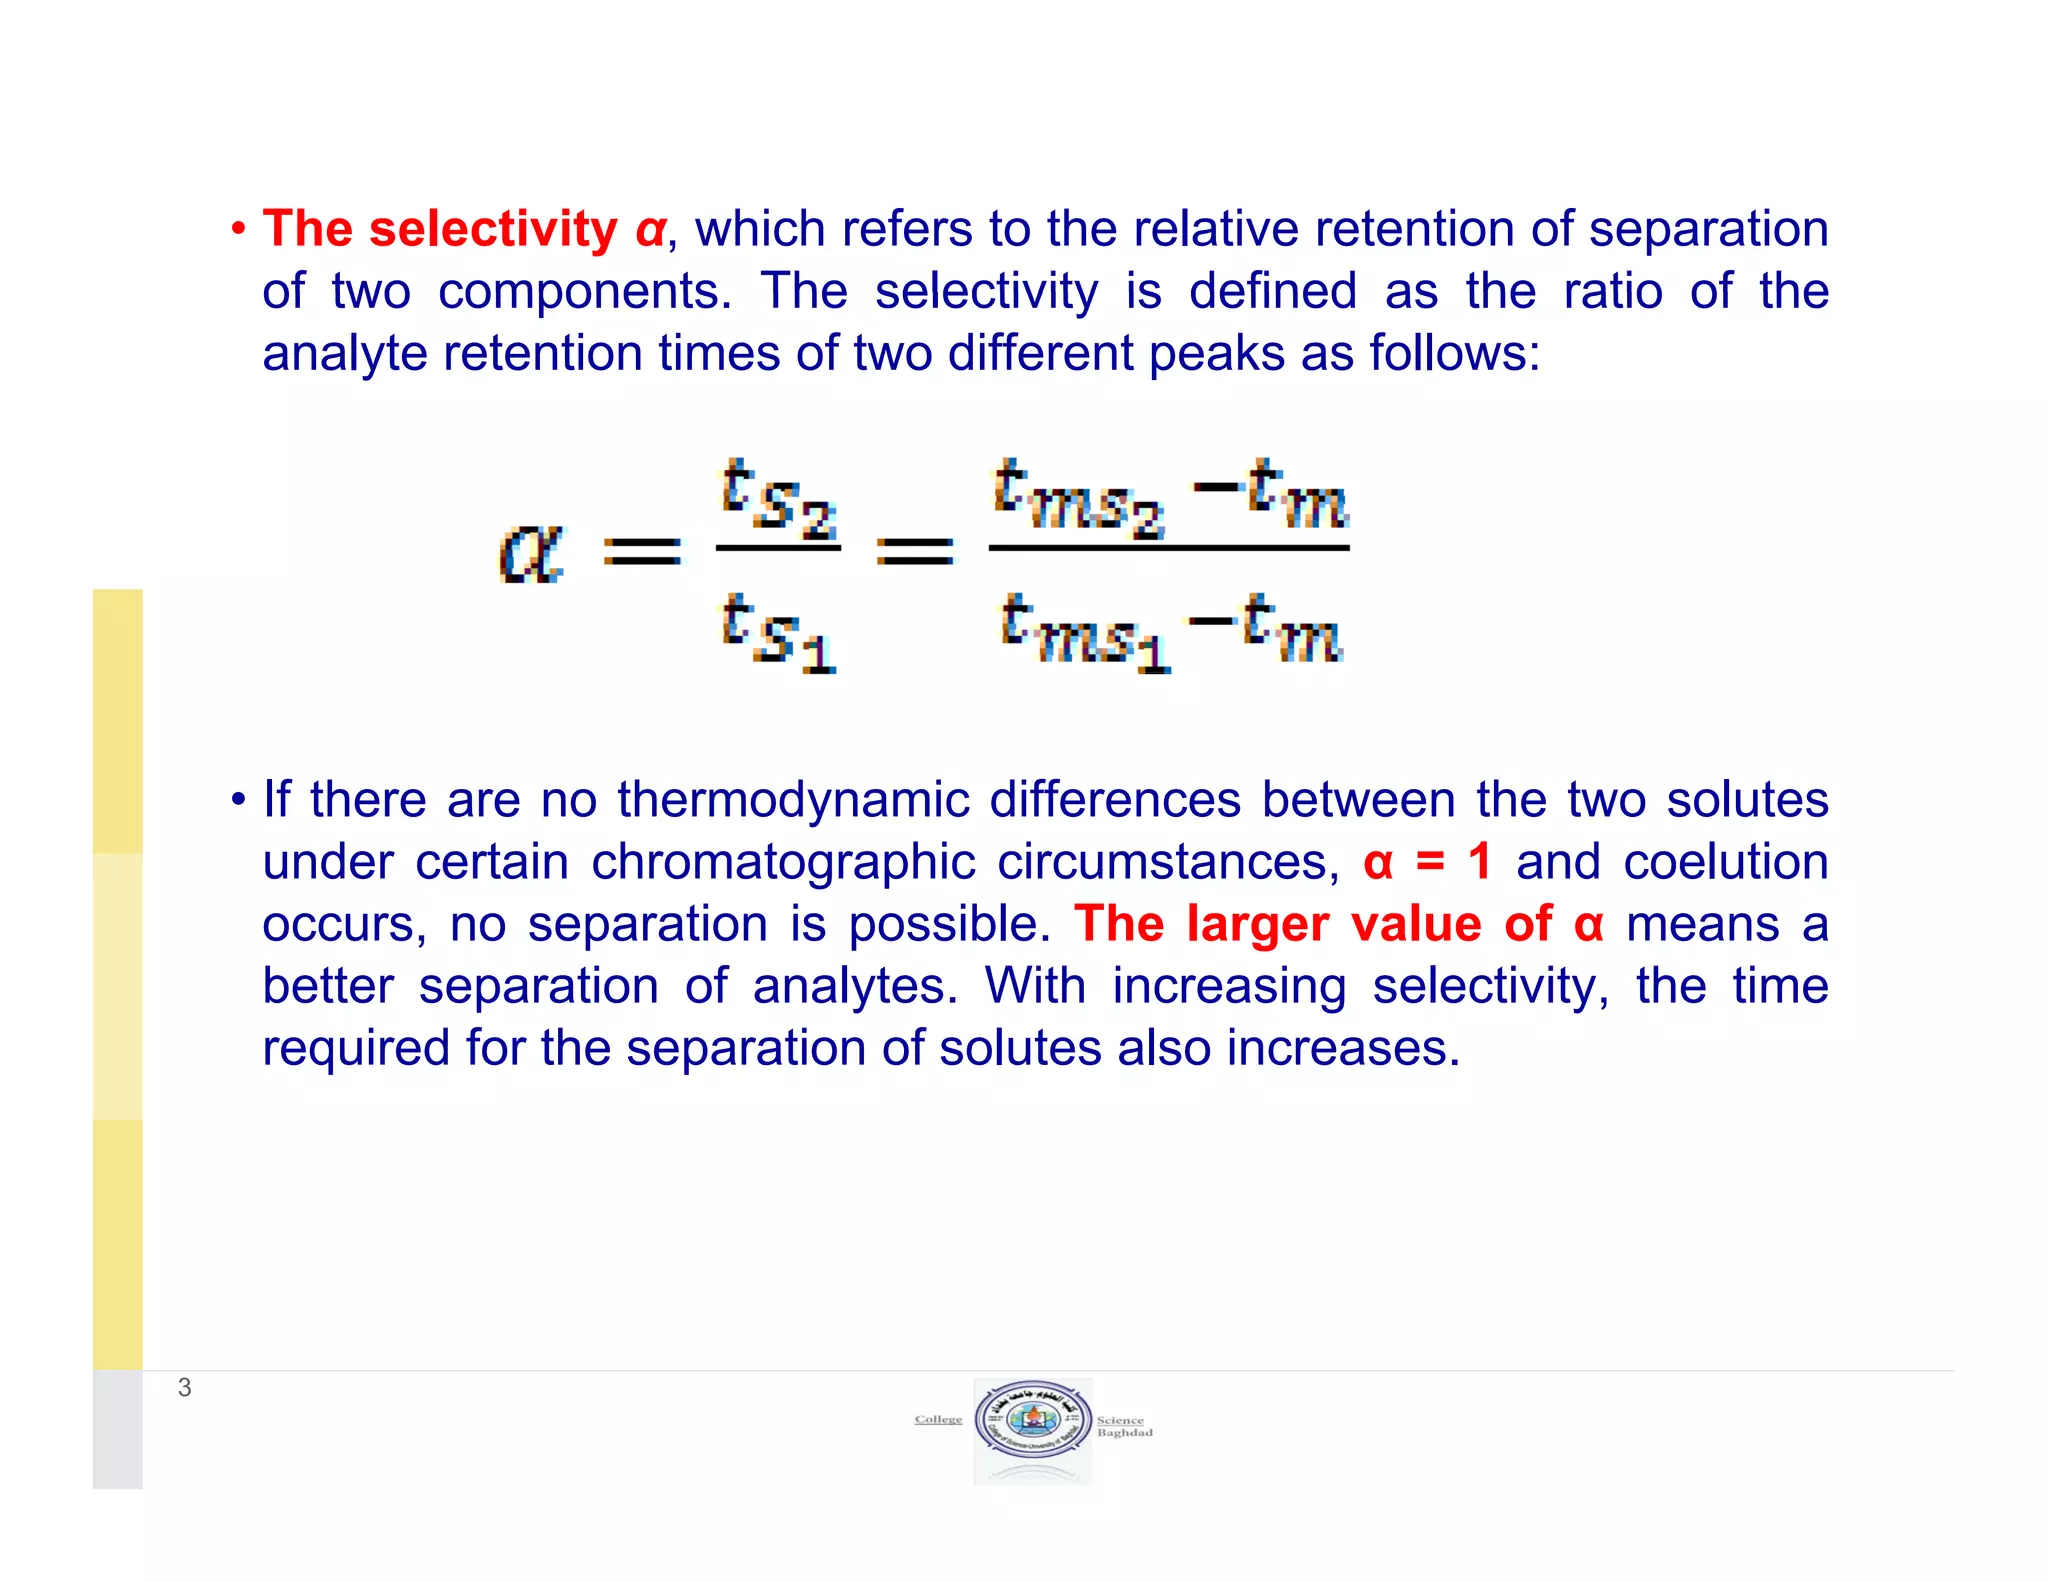
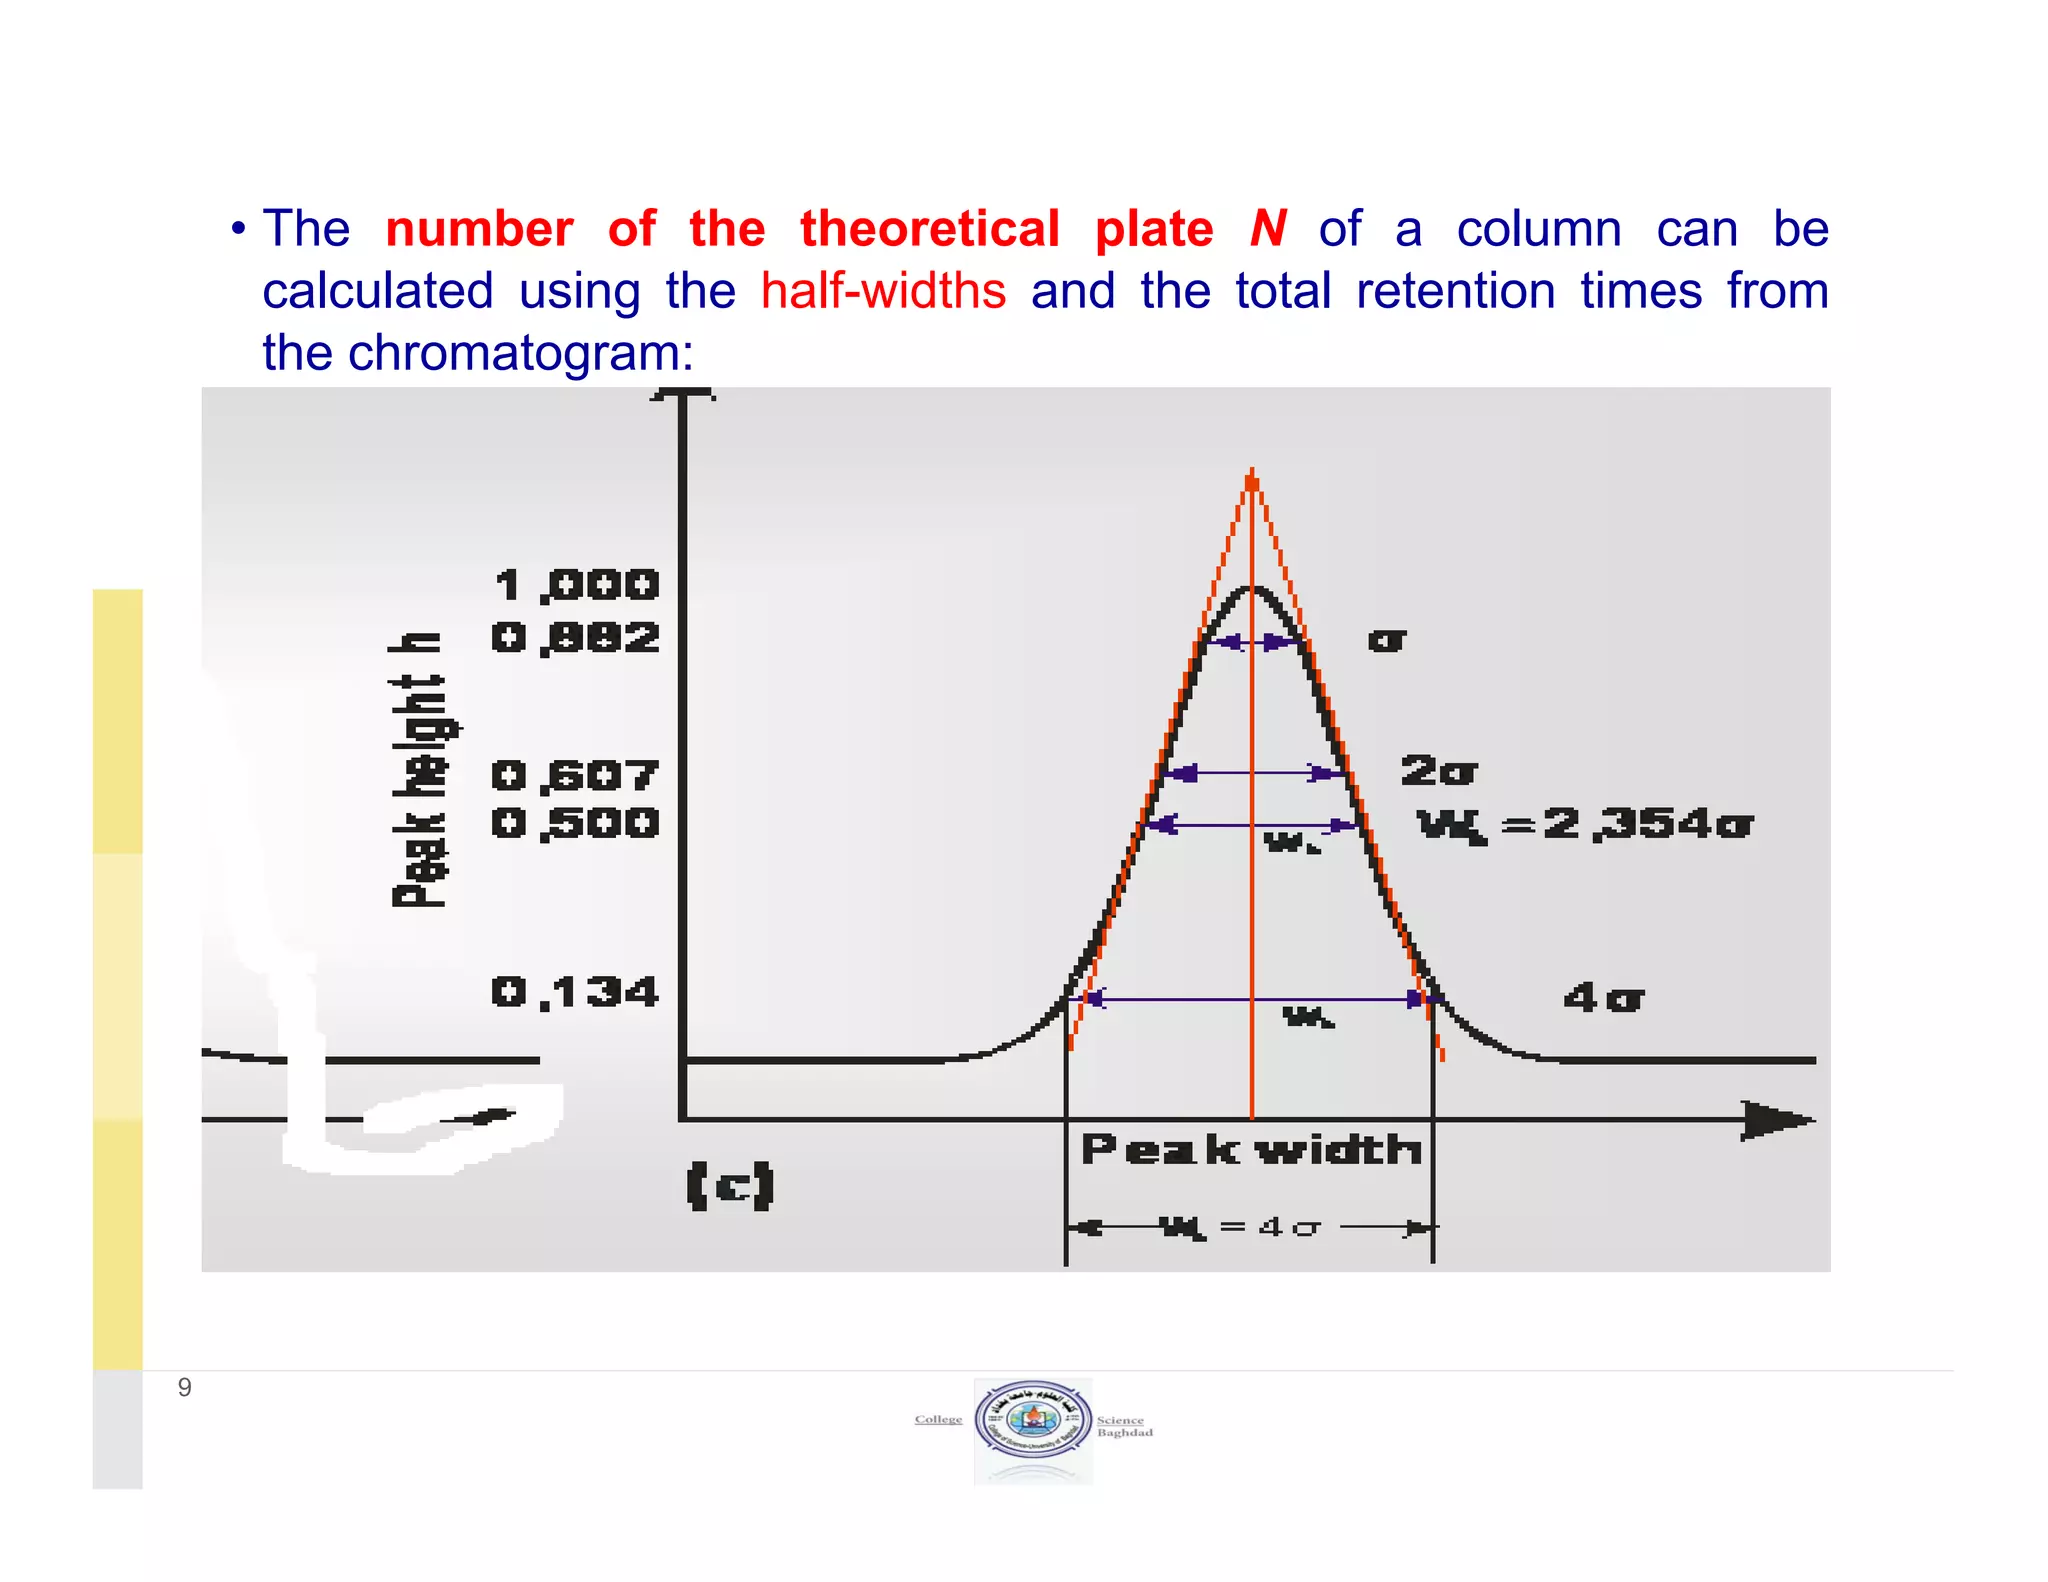
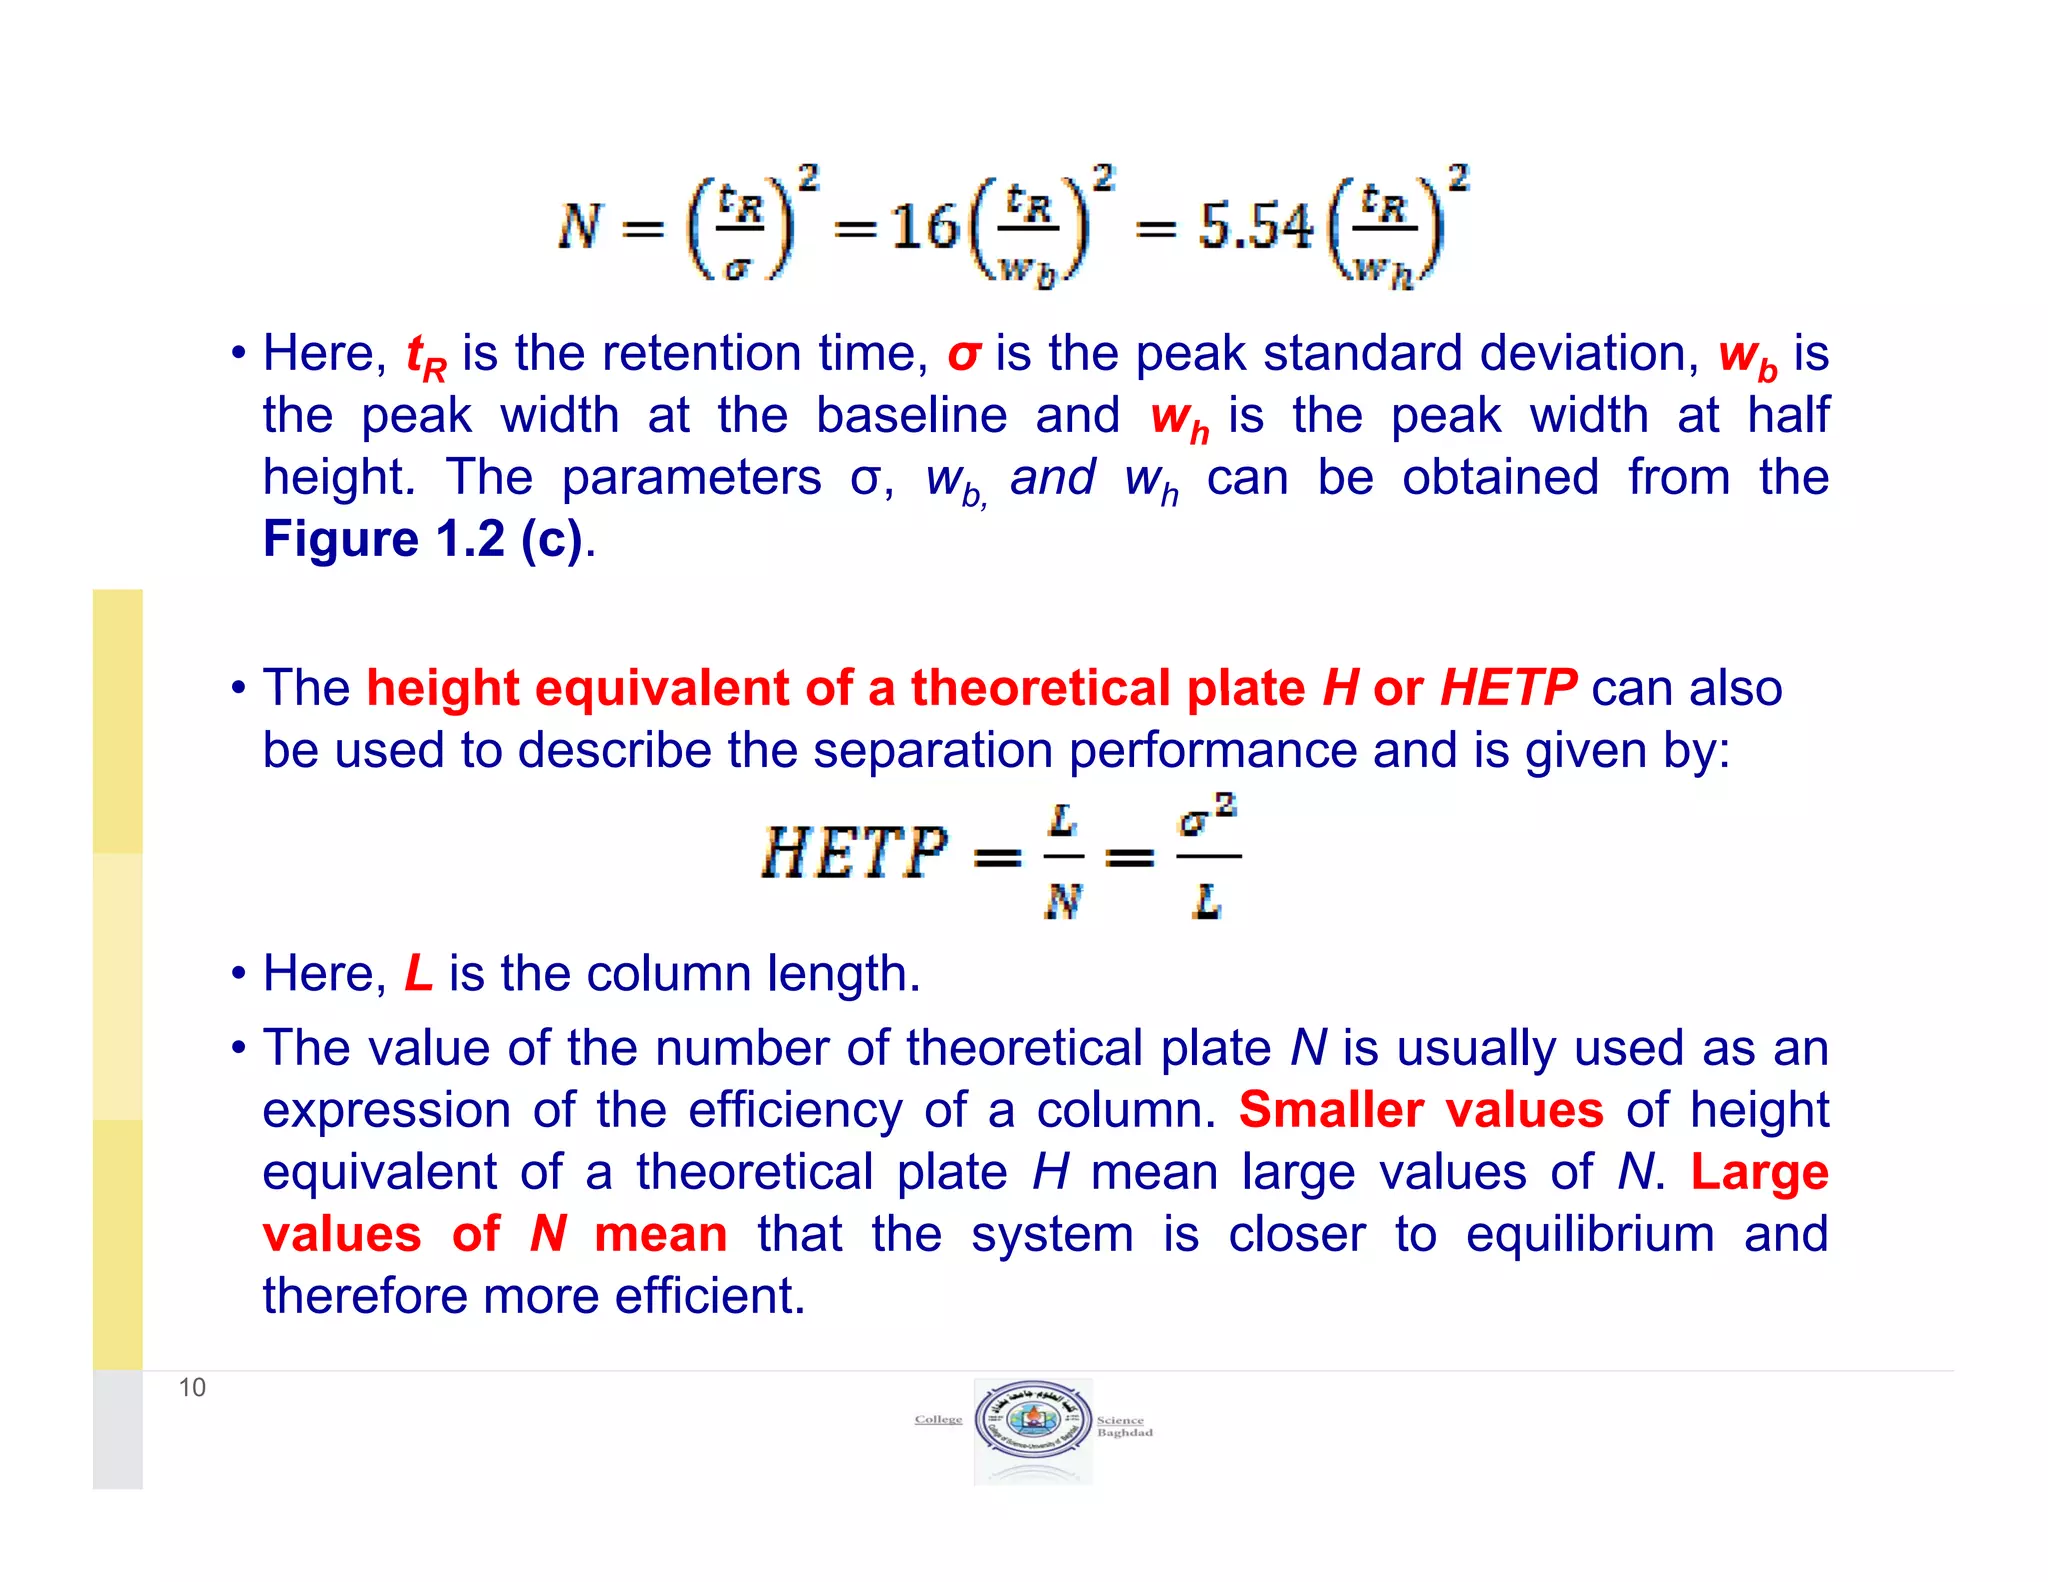
Lecture three
ChromatographyChromatography
Analytical Chemistry 4
Second stage
Dr.Ashraf Saad Rasheed
Retention factor, selectivity, and resolution
• The retention factor k’ indicates the factor by which the analyte is
staying longer on the stationary than in the mobile phase.
Mathematically it is defined as a product of the distributionMathematically, it is defined as a product of the distribution
coefficient DA and the ratio of the volume of the stationary phase Vs
to the mobile phase as shown in Equation 1.5:
• Small values of the retention factor k’ mean that the analyte
is eluted near the hold-up time; therefore, the separation will be
poor. Large values of the retention factor k’ mean that the longer
the analysis time, the wider the peak and the lower the sensitivity.
2
• The selectivity α, which refers to the relative retention of separation
of two components The selectivity is defined as the ratio of theof two components. The selectivity is defined as the ratio of the
analyte retention times of two different peaks as follows:
• If there are no thermodynamic differences between the two solutes
under certain chromatographic circumstances, α = 1 and coelution
occurs, no separation is possible. The larger value of α means a
better separation of analytes. With increasing selectivity, the time
required for the separation of solutes also increases.
3
• α is increased by one of the following procedures:
1 Ch i bil h iti1. Changing mobile phase composition
2. Changing column temperature
3. Changing composition of stationary phase
4
• The ultimate goal of any chromatographic separation is to
t th l t f i t i t t b d A b ttseparate the solutes of a mixture into separate bands. A better
measure to describe the quality of separation is the resolution R.
• The resolution R of two signals is defined as the difference between
th di t f t k i di id d b th ith tithe distances of two peaks maxima divided by the arithmetic mean
of peak width w at base:
• If the difference in retention times of two peaks with the base width
is large, we obtain a high resolution. A resolution of R = 2.0 is not
desirable because the items related to cost are too large forg
analysis. At a resolution of R = 0.5, it is still possible to be
recognized as separate peaks of two analytes. A qualitative
separation requires a resolution of R = 1; for quantification, a
resolutions in the range of R = 1.2-1.5 is required.
5
6
Theoretical concepts of the chromatography
• Therefore, there are two theories to explain the chromatography
process.
• First the plate theory (developed by Martin and Synge) and• First, the plate theory (developed by Martin and Synge) and
• second, the dynamic theory (proposed by Van Deemter).
7
1. The plate theorye p ate t eo y
• In 1940, Martin and Synge introduced the plate theory to describe
chromatography by analogy to distillation and extraction.
• The plate model supposes that the chromatographic column
contains a large number of separate layers, called theoretical plates
(Figure 1.3).
• Separate equilibrations of the sample between the stationary and
mobile phase occur in these "plates" The analyte moves down themobile phase occur in these plates . The analyte moves down the
column by transfer of equilibrated mobile phase from one plate to
the nex
8
• The number of the theoretical plate N of a column can be
calculated using the half-widths and the total retention times fromcalculated using the half-widths and the total retention times from
the chromatogram:
9
• Here, tR is the retention time, σ is the peak standard deviation, wb is
the peak width at the baseline and wh is the peak width at half
height. The parameters σ, wb and wh can be obtained from theheight. The parameters σ, wb, and wh can be obtained from the
Figure 1.2 (c).
• The height equivalent of a theoretical plate H or HETP can also• The height equivalent of a theoretical plate H or HETP can also
be used to describe the separation performance and is given by:
• Here, L is the column length.
• The value of the number of theoretical plate N is usually used as an
f ff f S fexpression of the efficiency of a column. Smaller values of height
equivalent of a theoretical plate H mean large values of N. Large
values of N mean that the system is closer to equilibrium and
therefore more efficienttherefore more efficient.
10

Lecture 3 analytical chemistry 4-second stage

  • 1.
  • 2.
    Retention factor, selectivity,and resolution • The retention factor k’ indicates the factor by which the analyte is staying longer on the stationary than in the mobile phase. Mathematically it is defined as a product of the distributionMathematically, it is defined as a product of the distribution coefficient DA and the ratio of the volume of the stationary phase Vs to the mobile phase as shown in Equation 1.5: • Small values of the retention factor k’ mean that the analyte is eluted near the hold-up time; therefore, the separation will be poor. Large values of the retention factor k’ mean that the longer the analysis time, the wider the peak and the lower the sensitivity. 2
  • 3.
    • The selectivityα, which refers to the relative retention of separation of two components The selectivity is defined as the ratio of theof two components. The selectivity is defined as the ratio of the analyte retention times of two different peaks as follows: • If there are no thermodynamic differences between the two solutes under certain chromatographic circumstances, α = 1 and coelution occurs, no separation is possible. The larger value of α means a better separation of analytes. With increasing selectivity, the time required for the separation of solutes also increases. 3
  • 4.
    • α isincreased by one of the following procedures: 1 Ch i bil h iti1. Changing mobile phase composition 2. Changing column temperature 3. Changing composition of stationary phase 4
  • 5.
    • The ultimategoal of any chromatographic separation is to t th l t f i t i t t b d A b ttseparate the solutes of a mixture into separate bands. A better measure to describe the quality of separation is the resolution R. • The resolution R of two signals is defined as the difference between th di t f t k i di id d b th ith tithe distances of two peaks maxima divided by the arithmetic mean of peak width w at base: • If the difference in retention times of two peaks with the base width is large, we obtain a high resolution. A resolution of R = 2.0 is not desirable because the items related to cost are too large forg analysis. At a resolution of R = 0.5, it is still possible to be recognized as separate peaks of two analytes. A qualitative separation requires a resolution of R = 1; for quantification, a resolutions in the range of R = 1.2-1.5 is required. 5
  • 6.
  • 7.
    Theoretical concepts ofthe chromatography • Therefore, there are two theories to explain the chromatography process. • First the plate theory (developed by Martin and Synge) and• First, the plate theory (developed by Martin and Synge) and • second, the dynamic theory (proposed by Van Deemter). 7
  • 8.
    1. The platetheorye p ate t eo y • In 1940, Martin and Synge introduced the plate theory to describe chromatography by analogy to distillation and extraction. • The plate model supposes that the chromatographic column contains a large number of separate layers, called theoretical plates (Figure 1.3). • Separate equilibrations of the sample between the stationary and mobile phase occur in these "plates" The analyte moves down themobile phase occur in these plates . The analyte moves down the column by transfer of equilibrated mobile phase from one plate to the nex 8
  • 9.
    • The numberof the theoretical plate N of a column can be calculated using the half-widths and the total retention times fromcalculated using the half-widths and the total retention times from the chromatogram: 9
  • 10.
    • Here, tRis the retention time, σ is the peak standard deviation, wb is the peak width at the baseline and wh is the peak width at half height. The parameters σ, wb and wh can be obtained from theheight. The parameters σ, wb, and wh can be obtained from the Figure 1.2 (c). • The height equivalent of a theoretical plate H or HETP can also• The height equivalent of a theoretical plate H or HETP can also be used to describe the separation performance and is given by: • Here, L is the column length. • The value of the number of theoretical plate N is usually used as an f ff f S fexpression of the efficiency of a column. Smaller values of height equivalent of a theoretical plate H mean large values of N. Large values of N mean that the system is closer to equilibrium and therefore more efficienttherefore more efficient. 10