This document provides an overview of high performance liquid chromatography (HPLC). It discusses the basic principles of chromatographic separation and defines key terms like retention time and resolution. It also describes different HPLC techniques including normal phase, reversed phase, ion exchange, size exclusion, and ion-pair chromatography. The document outlines the typical instrumentation used in HPLC including the pump, injector, chromatography column, detectors, and data collection system. It provides details on how each component works and its purpose. Overall, the document serves as a comprehensive introduction to HPLC principles, methodology, and instrumentation.


![SEC RETENTION MECHANISM
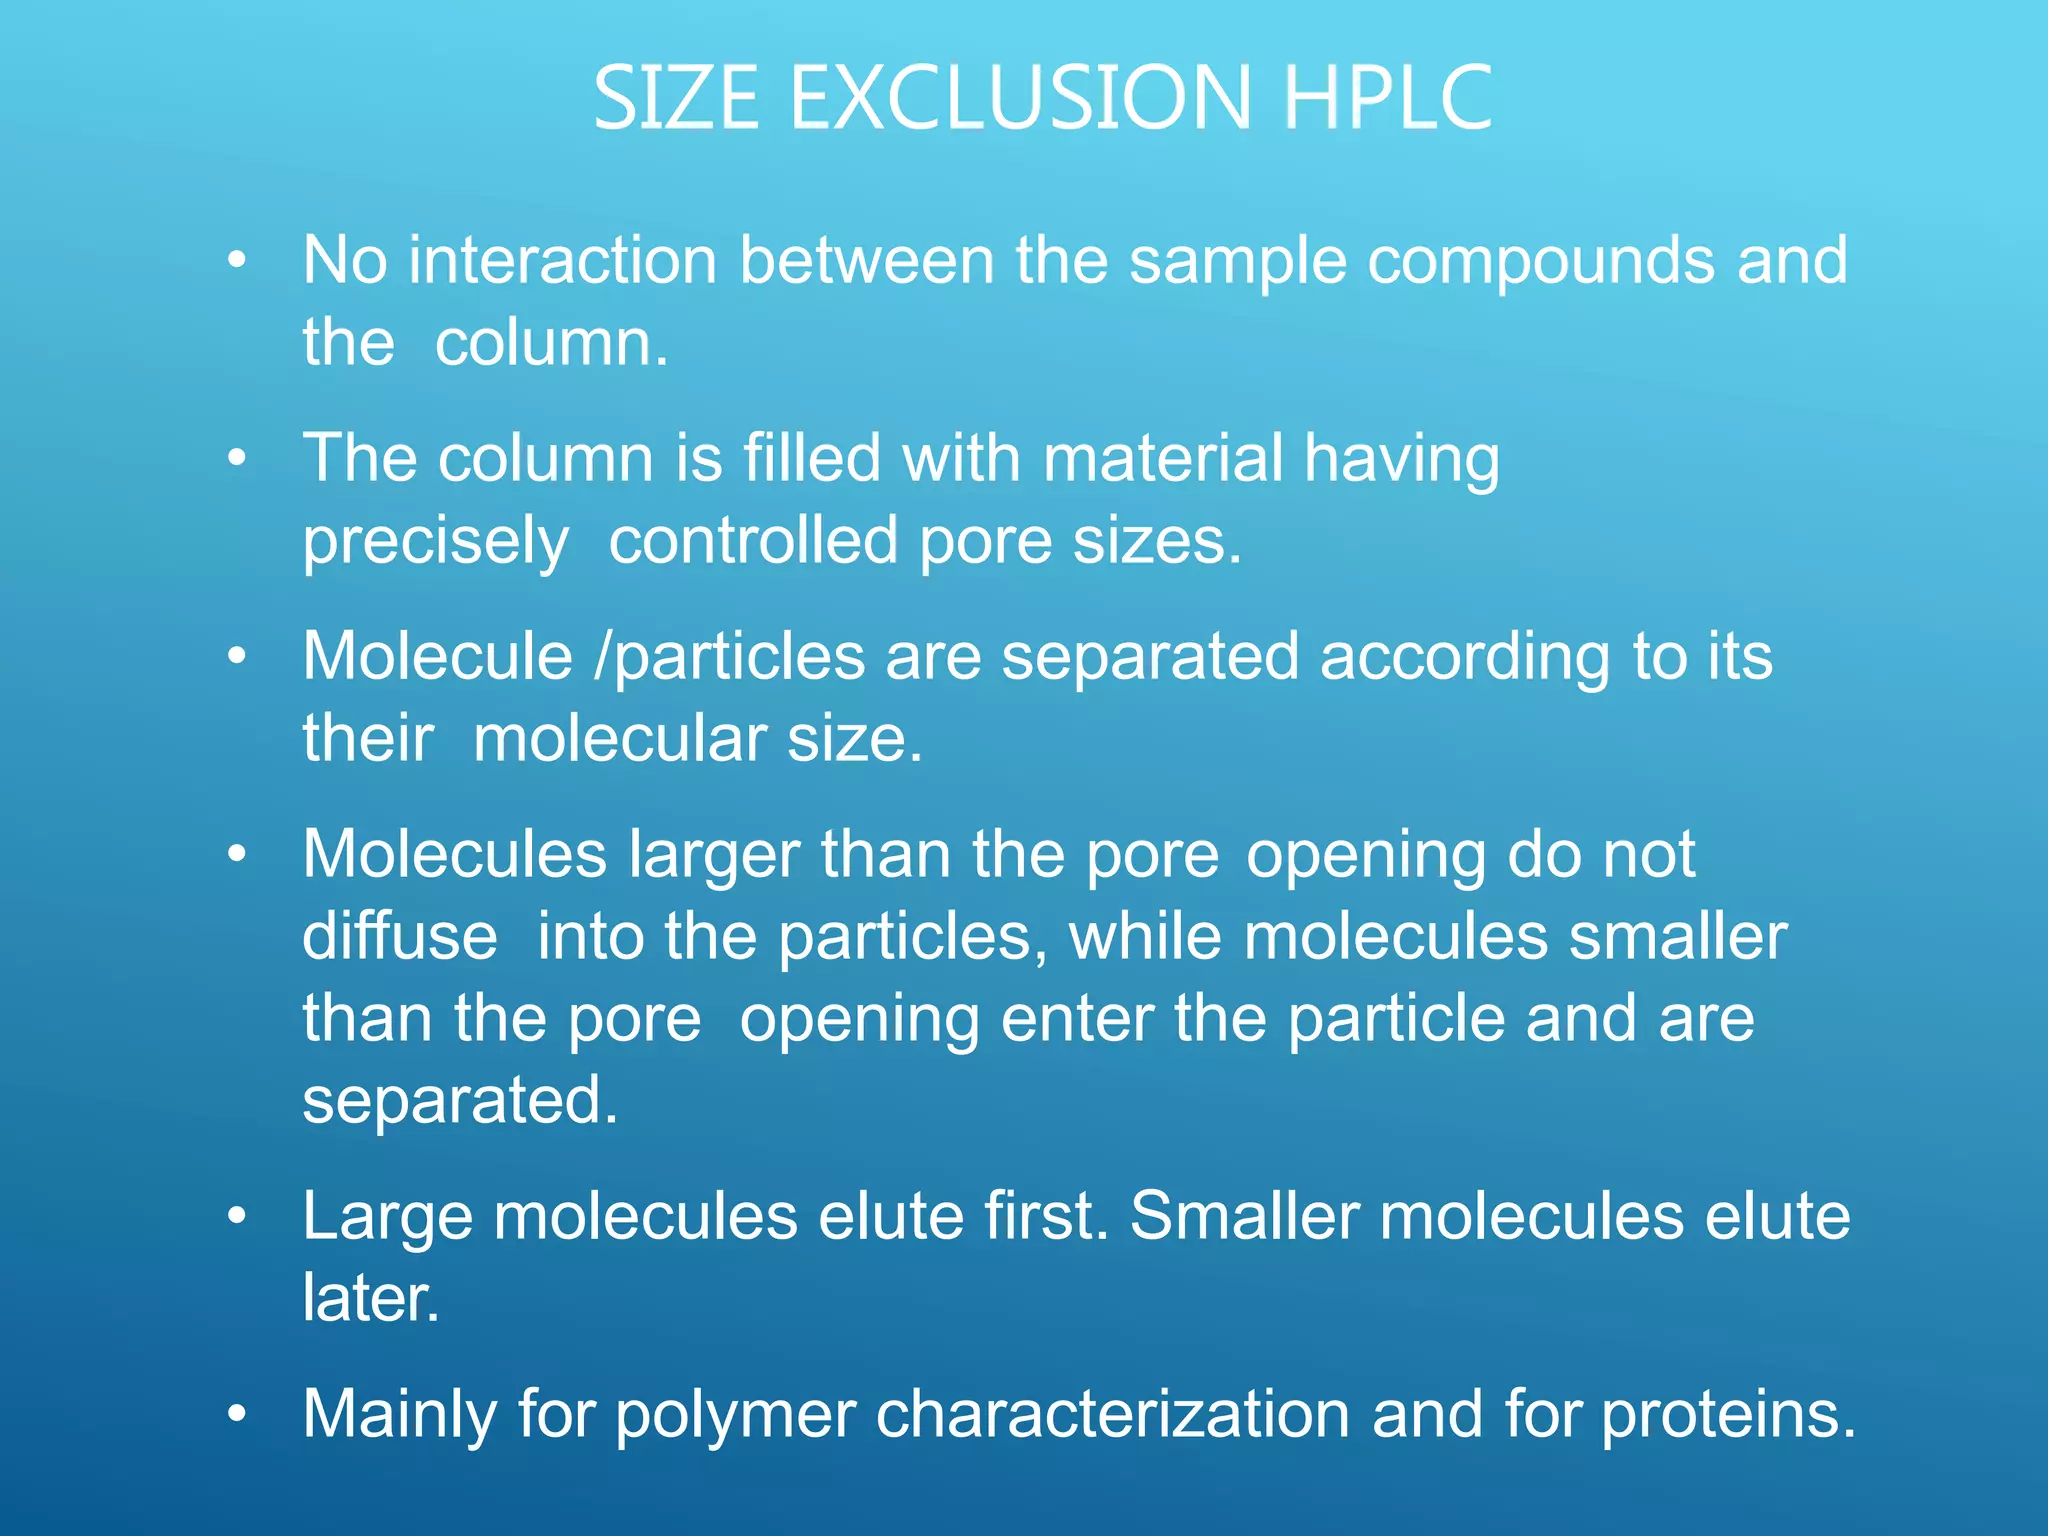
Molecular Size in solution
• Analytes are dissolved in solution, injected into mobile
phase
•Analytes are separated by their size once they are in
solution There are two modes:
• Non-aqueous SEC [Gel Permeation Chromatography
(GPC)]
– Used in polymer separations
• Aqueous SEC [Gel Filtration Chromatography (GFC)].
– Used in biomolecule separations.](https://image.slidesharecdn.com/hplc-210626072806/75/HPLC-Principle-Instrumentation-and-Application-17-2048.jpg)


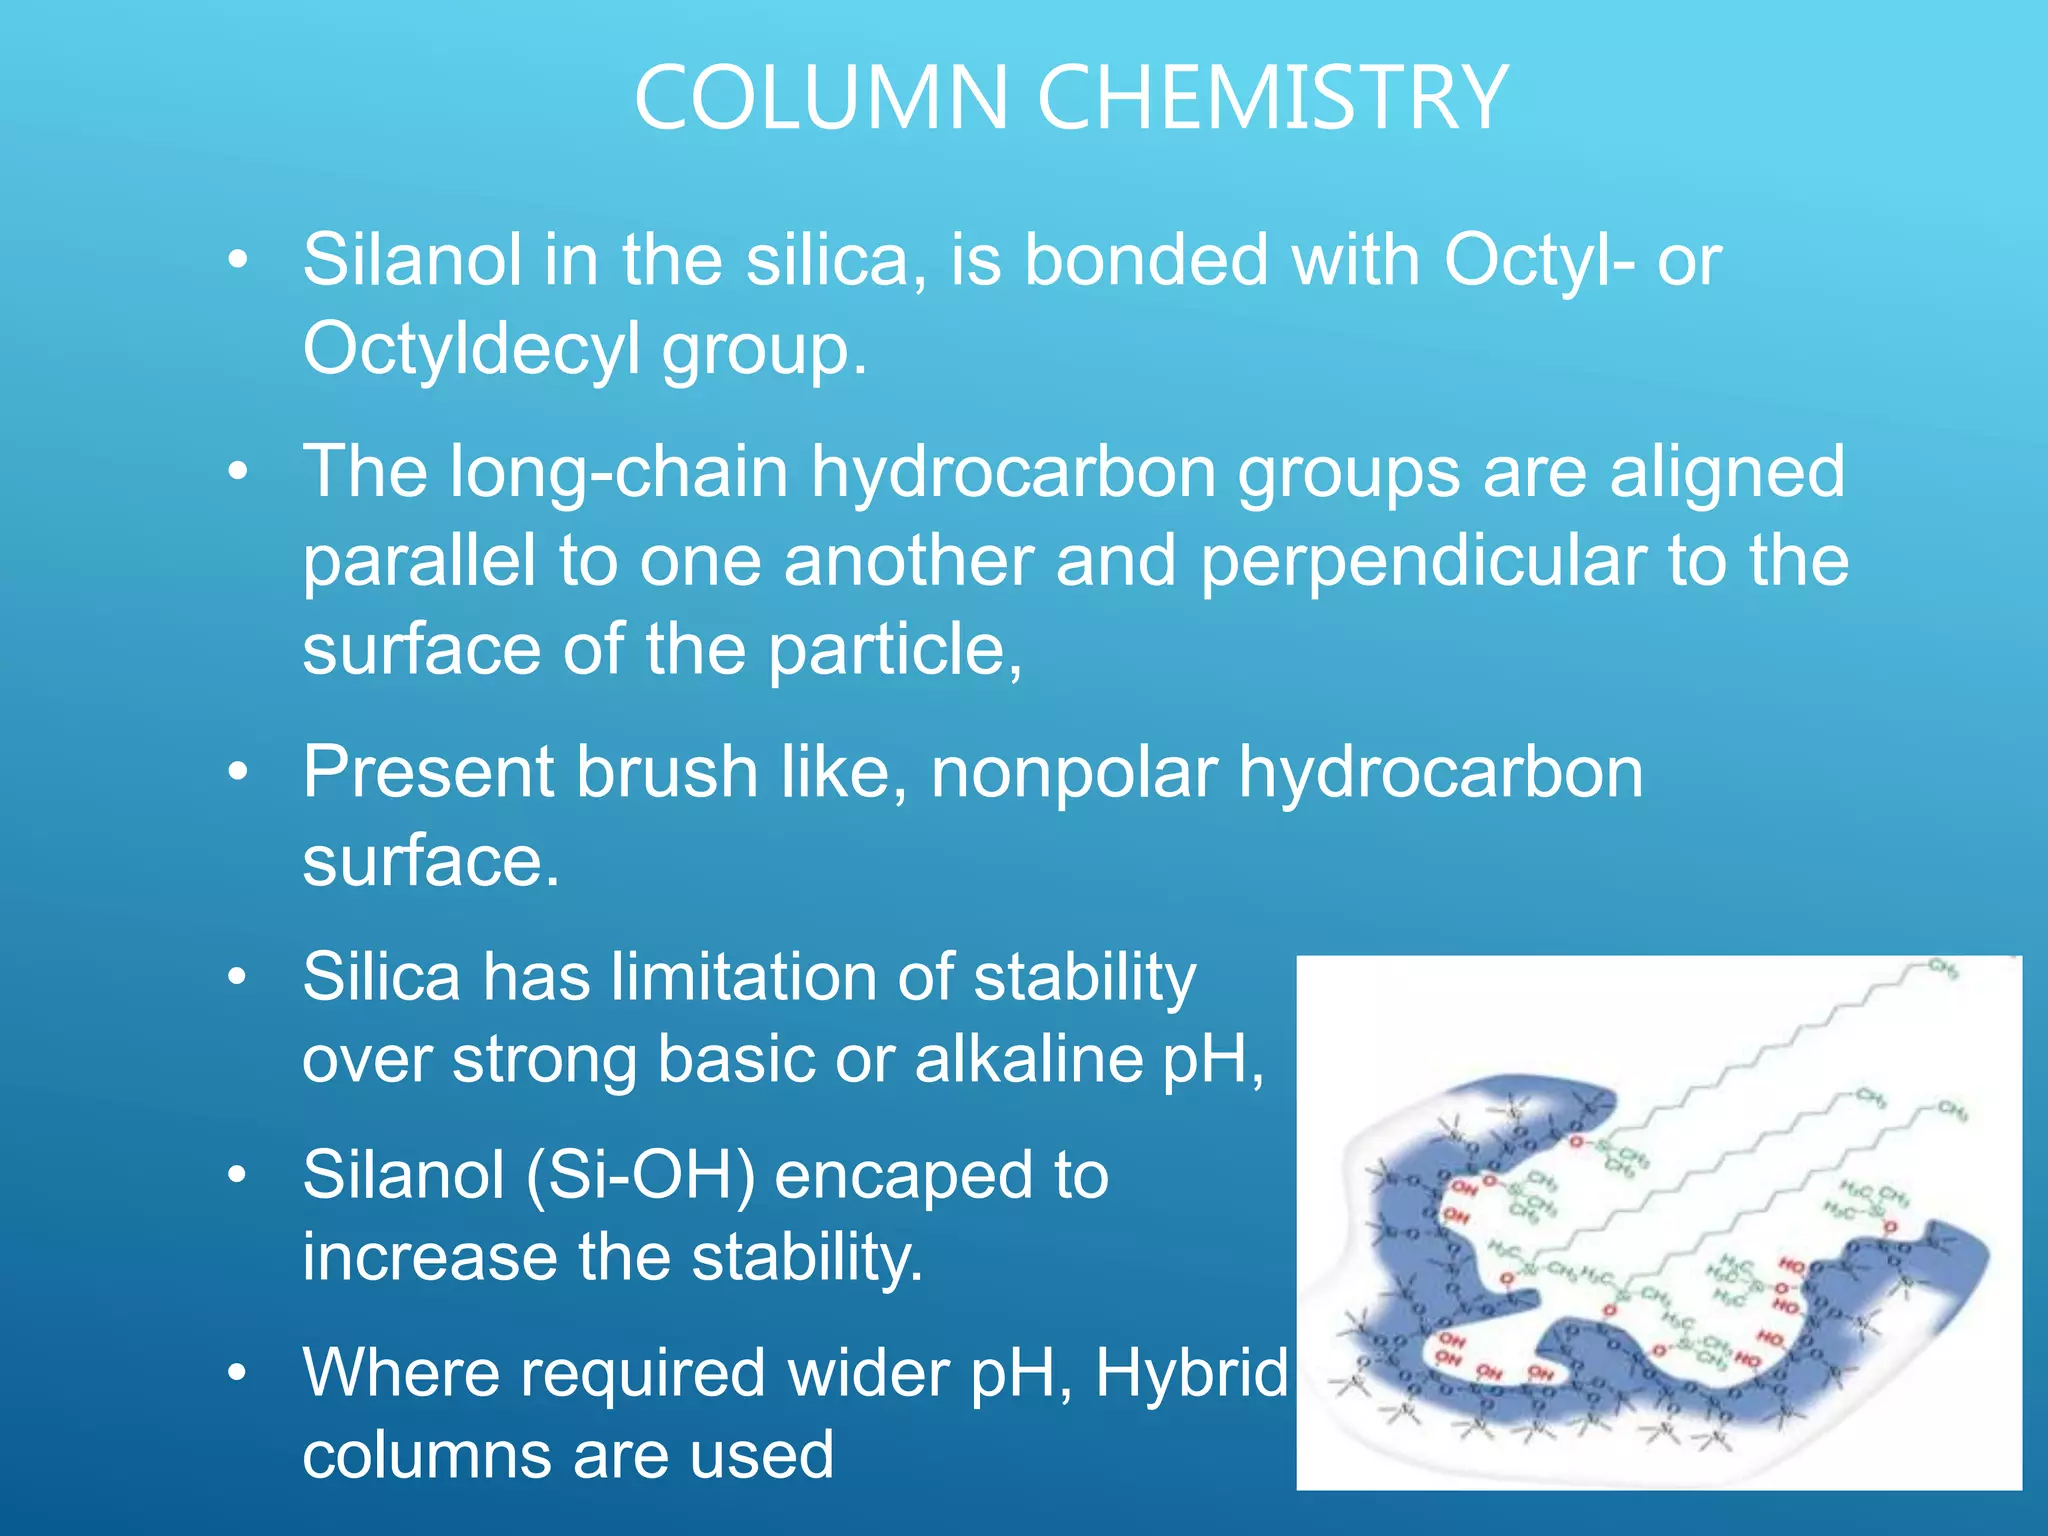
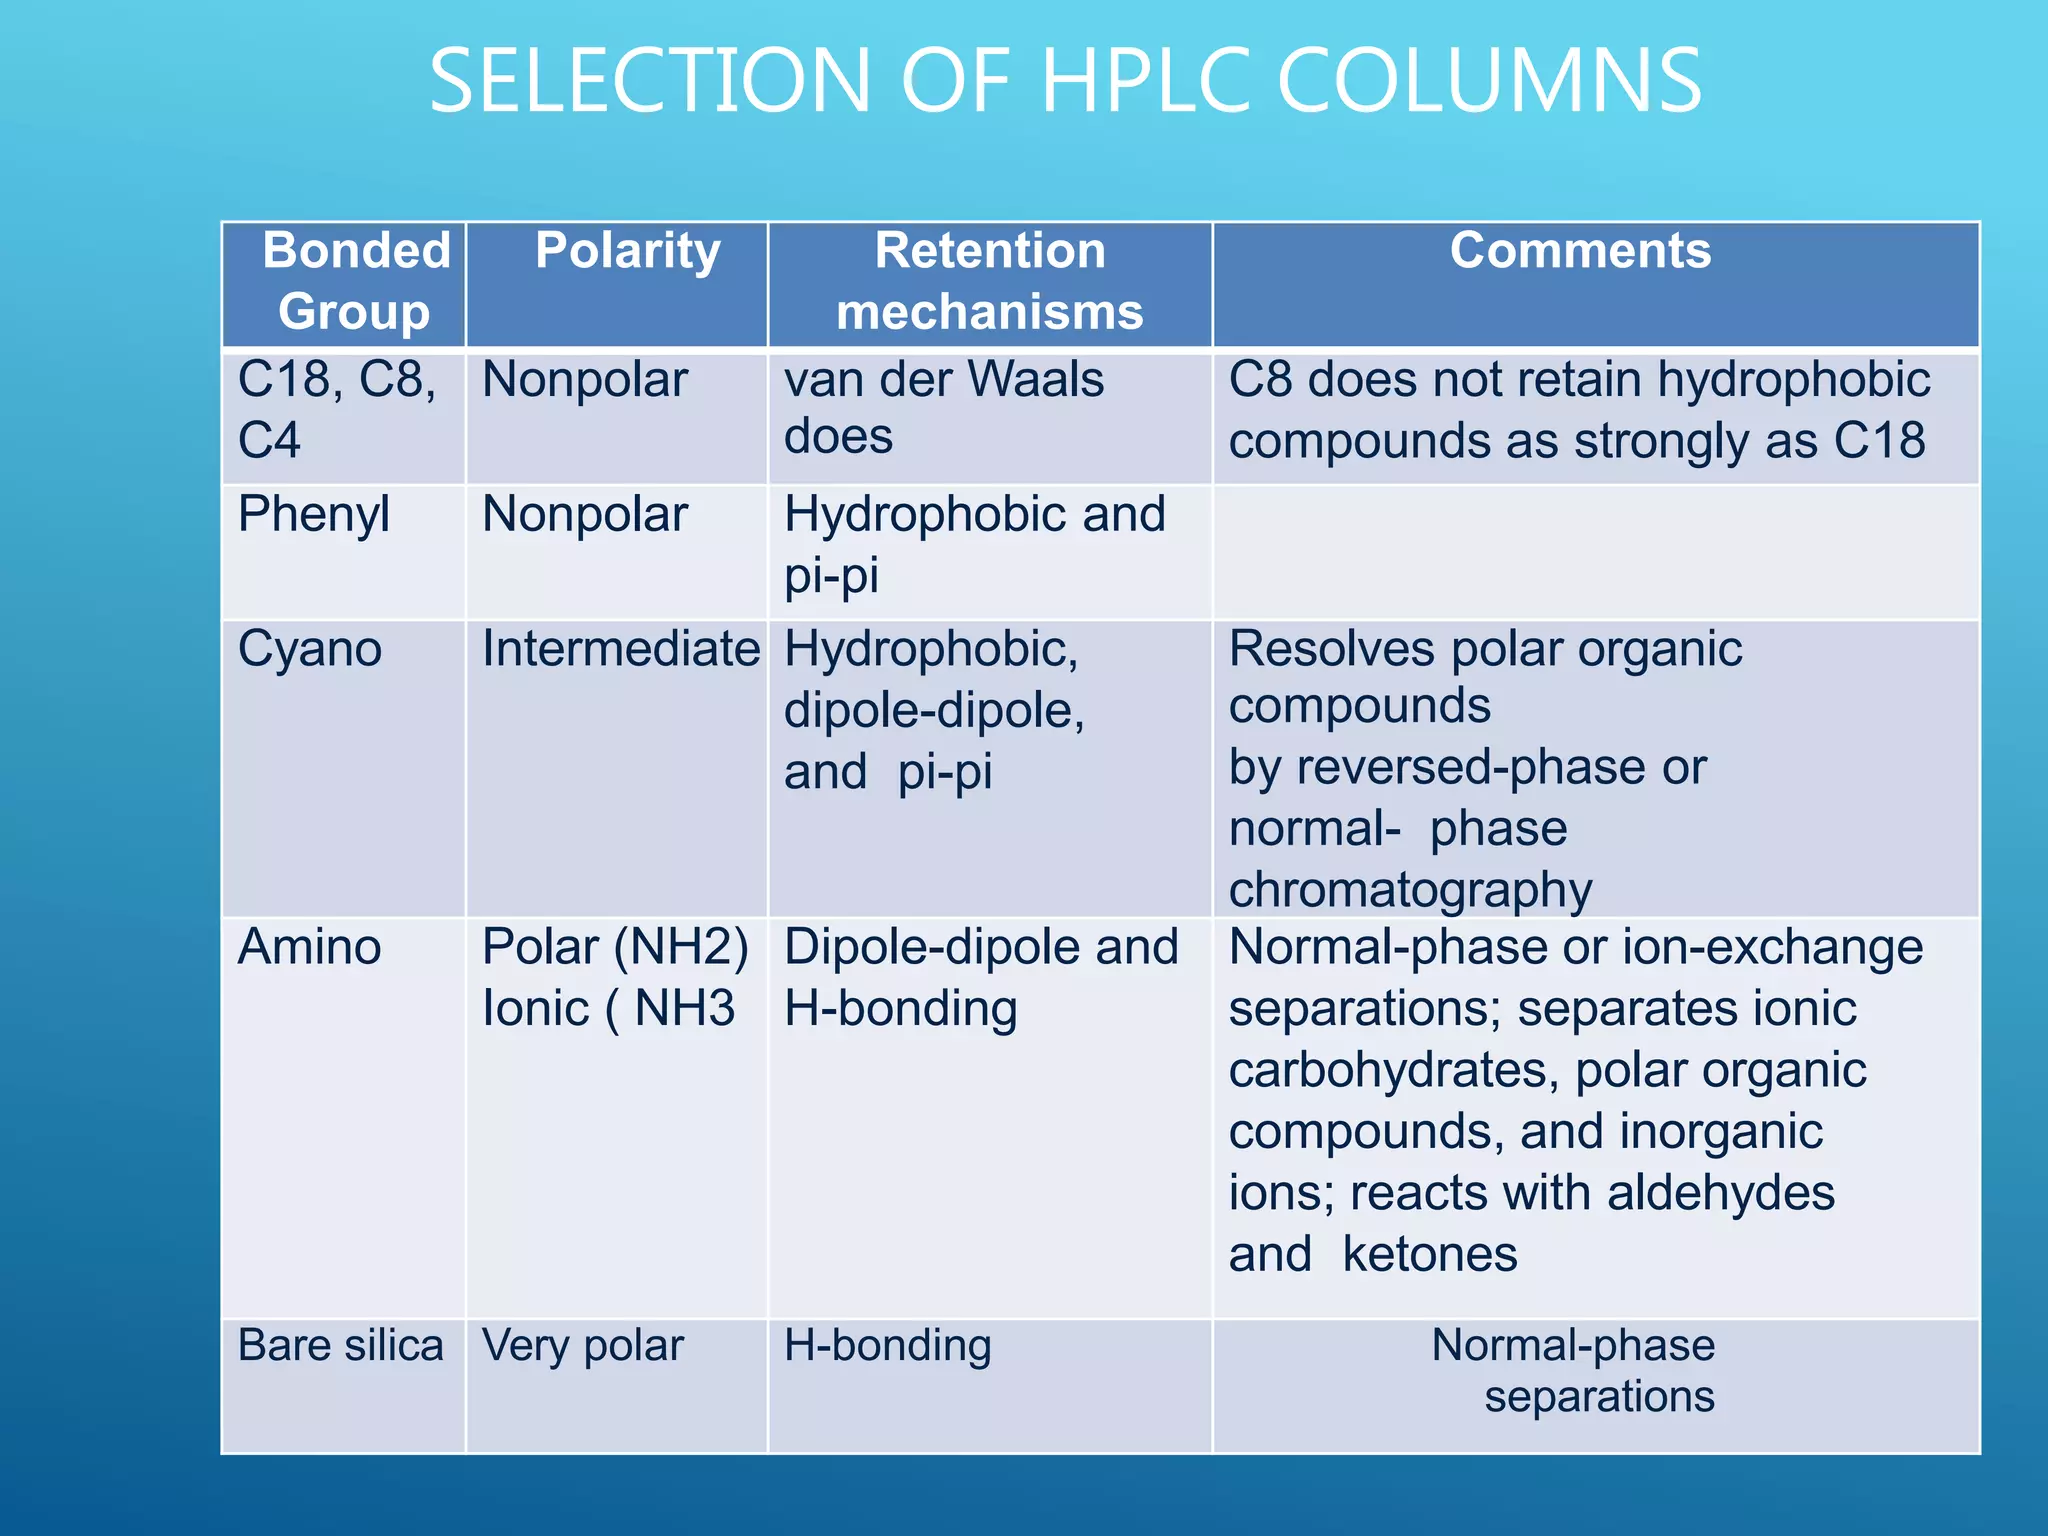
![COLUMN CHEMISTRY
Reverse
phases:
Phenyl : R = -C6H5,
C8 (octyl silane):R = -(CH2)7CH3,
moderate
less hydrophobic
C18/ODS: R = -(CH2)17CH3, hydrophobic
Normal phases :
Cyanopropyl
Diol:
Amino :
Dimethylamino,
[R = (CH2)3CN], less polar
[R = -(CH2)2OCH2CH(OH)CH2OH],
[R = -(CH2)3NH2],
[R = -(CH2)3N(CH3)2] more polar
Silica based columns have limited lifetime at pH levels below 2 or above 8.](https://image.slidesharecdn.com/hplc-210626072806/75/HPLC-Principle-Instrumentation-and-Application-41-2048.jpg)